Monthly Archives: August 2014

Capex firms as iron ore bleeds

This morning the ABS released its survey of private new capital expenditure and expected expenditure, the big brother to yesterday’s construction work done release. Construction work done is based on the value of projects being undertaken by construction companies, whereas today’s release is based on the capitalised value of those projects to the businesses paying for them, as reported in their financial statements.

Encouragingly, the headline figure rose to a seasonally-adjusted $32.6bn, up 1.1% on the previous quarter, while the trend (a moving average of the previous 7 quarters) continued to decline.

Screen Shot 2014-08-28 at 4.27.06 pm

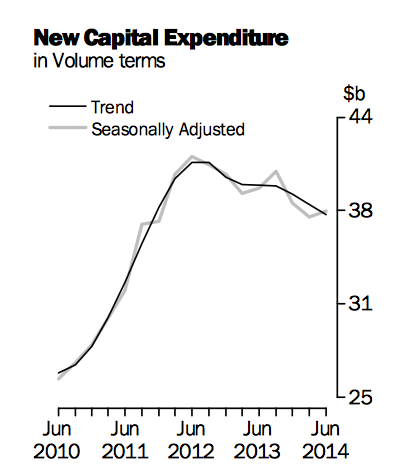
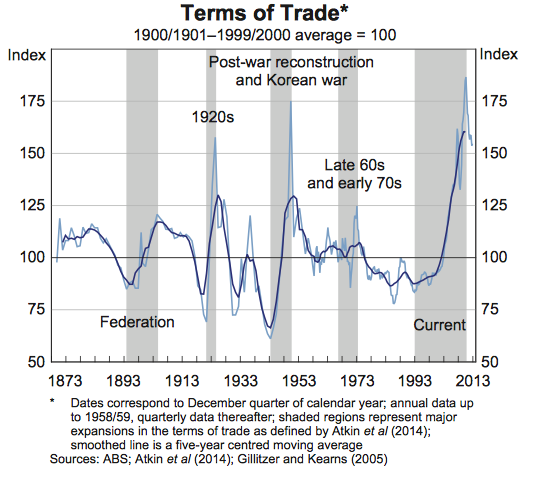
This level of capital expenditure remains very high by historical standards (h/t RBA). And it’s been almost entirely driven by investment in the resources sector.
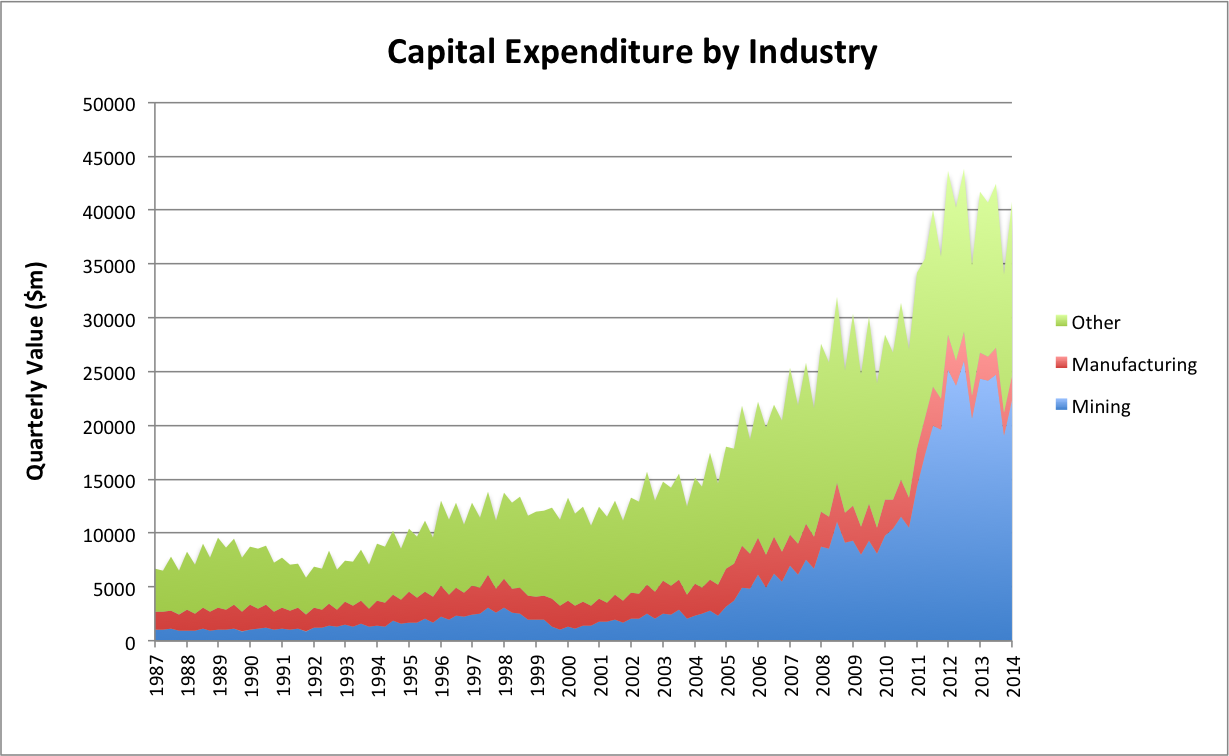
CAPEX_historical
Chart source: ABS

There have been well-publicised concerns that this bloated level of mining investment could reverse quickly, leaving a hole in the economy which will be difficult to fill (the ‘mining cliff’, as some referred to this scenario). It’s therefore welcome to see capex continue to bounce along at elevated levels.

Nevertheless, with the winding down of investment in LNG export capacity drawing ever-nearer, and the stubborn exchange rate rendering new investment difficult to justify in any industry outside home-building, there remains significant downside risks to this figure going forward. This is somewhat reflected in expectations for new capex in 2014-2015, which continue to show a decline from last year, albeit well above initial forecasts.

Screen Shot 2014-08-28 at 5.08.44 pm

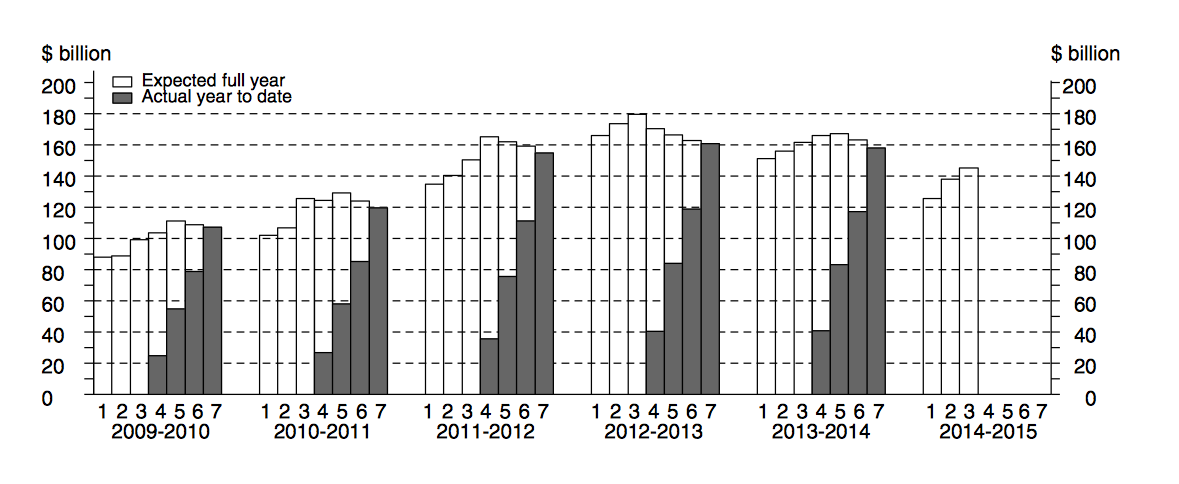
In all, the release surpassed expectations and indicates a gentler descent than had previously been expected.

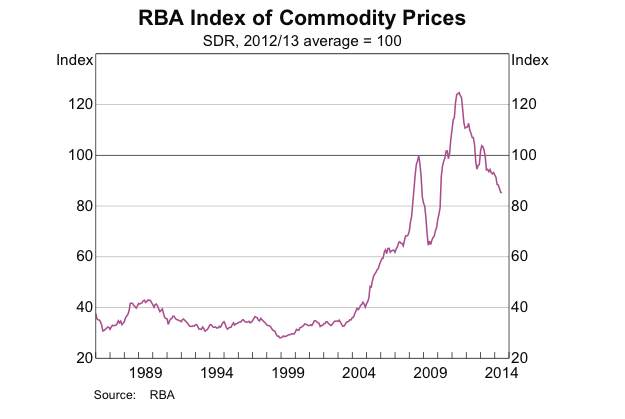
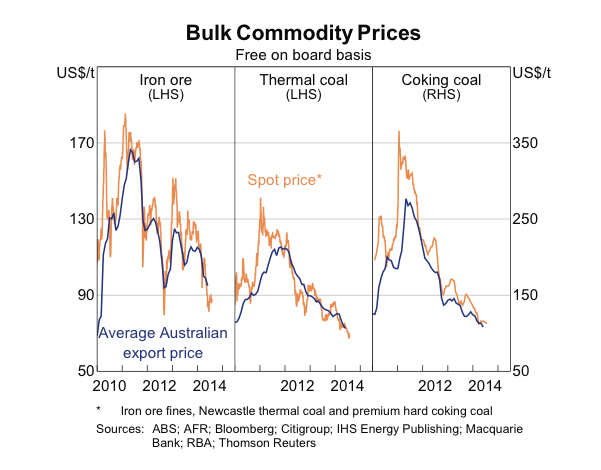
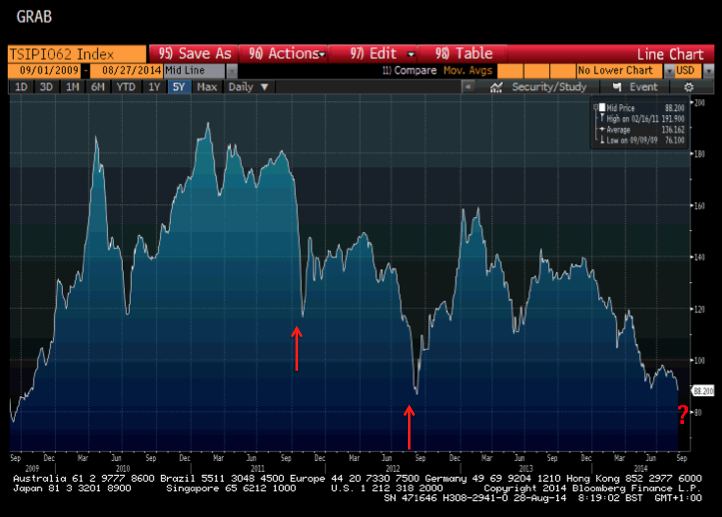
Raining on capex’s parade today was the advancing rout in iron ore prices, which are exhibiting all the trappings of a classic Q3 capitulation.

Screen Shot 2014-08-28 at 5.33.58 pm

This observed pattern in iron ore prices reflects seasonal conditions in China. As the days grow shorter, construction work slows and demand for input materials cools. Chief among these are steel and iron ore. This tradition was interrupted last year, largely as a result of stimulus measures from the Chinese government and a consequent build-up of iron ore inventories at Chinese ports.

Screenshot-2014-06-03-19.02.03

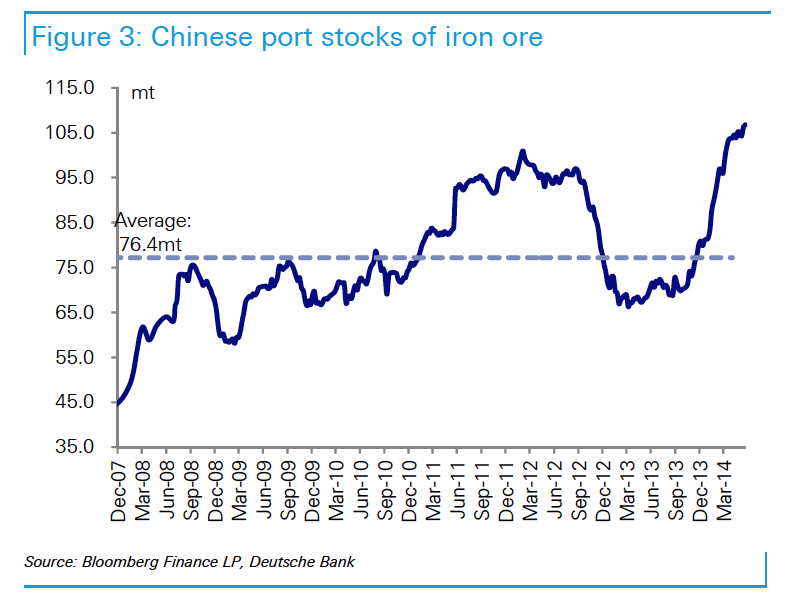
Notably, this surge in port stocks merely held prices in a tight range, and we didn’t see the usual run up in prices into the year’s end. Once the rate of increase in stockpiles slowed this year, prices could not withstand the onslaught of new supply and tumbled accordingly, with spot now down almost 40% for the year in AUD-terms.

With spot falling to $88.20 a tonne overnight, we’ve decisively broken through support at the year’s previous low of $89. This was an important level and so right on cue iron ore futures traded on China’s Dalian exchange copped a hiding today. Iron ore and steel futures both notched up new all-time contract lows, although this has been happening every other day for a fortnight. As always Reuters has the inside word on today’s market action: Iron ore rout extends as Dalian futures sink 2.7 pct amid tight credit

Spot is now a mere $1.50 above its September 2012 low. It is quite possible that we see this go tonight and iron ore fall to its lowest level since 2009. If it does, there’s nothing but air all the way down to… who knows, picking a bottom is crapshoot, but a bottom it will find. Once it does, it should bounce back strongly. But this is very much a market of lower lows and lower highs, the glory days are long behind and there is precious little comprehension in the national psyche of the ramifications of this new reality.

Hold on to your hardhat, Gina!

Construction continues to soften

Data for construction work done was released by the ABS this morning, and continues to provide a neat snapshot of a bifurcated economy. 

Total value of construction work done for the June quarter came in at approximately $52bn, down 1.2% on the previous quarter. Expectations were for a 0.5% decline. 

Building rose by 1.5% in seasonally adjusted terms, led again by residential construction. However, this was more than offset by a 3.1% fall in engineering work done (mostly resource sector investment). 

Policymakers’ game plan for tackling the slowdown in resource sector investment activity has been to boost construction in the property sector, especially residential. The uptrend in building activity over the past two years is welcome, and suggests a measure of success for this strategy, even if it’s taken 225bps of RBA slashing to get it moving.

However, it’s also plain enough that home-building is not going to be able to completely fill the open-cut pit left behind by waning mining investment. In addition, current elevated levels of residential construction are being underpinned by high immigration, foreign demand for Australian property assets, and an unusually high rate of participation by domestic investors in the property market. These are not especially healthy characteristics and the risks are growing of a downturn in the property sector occurring at the most inopportune of times for the Australian economy. 

All-important private capital expenditure data out tomorrow, which will shed greater light on activity in the resources space. 

Strayan Rates – Part 2: Terms and Conditions

The most recent resource boom in Australia has by most measures been the biggest. The prices we receive for our exports relative to our imports, the terms of trade, reached never-before-seen heights. Furthermore, the boom ran longer than any preceding it.

Screen Shot 2014-08-26 at 11.20.29 am

This experience dramatically realigned Australia’s trading relationships.

Screen Shot 2014-08-26 at 11.48.18 am

And greatly accelerated the evolution of the industrial composition of the economy, with manufacturing’s share of output now among the lowest in the OECD.

Screen Shot 2014-08-26 at 11.50.34 am

The cornucopia was at its fullest in 2011, and since then the trend in commodity prices has been down…

Screen Shot 2014-08-26 at 11.19.45 am

…led by iron ore and the coals, which together account for roughly 35% of Australia’s exports.

Screen Shot 2014-08-26 at 11.34.33 am

Commodity prices move in familiar cycles: Demand rises, with supply initially unable to keep apace, sending prices higher. Over time, elevated prices encourage large amounts of capital to be allocated towards supply expansions. Often, demand peaks and starts to decline around the same time that supply catches up, and prices bust.

Australia has witnessed enormous investment into its commodity sectors, raising output of key exports; we are right in the thick of the supply expansion stage.

Screen Shot 2014-08-26 at 11.41.32 am

This dizzying surge in export volumes is regularly adduced to assuage concerns around lower prices. However, if we consider iron ore, it must be remembered that the recent price decline (over 35% this year in AUD-terms) has largely been a consequence of increased supply. If Chinese demand cools materially, the combined effects of rising supply and falling demand risk another more serious leg down in prices. At that point, increasing supply may well be self-defeating (though there are undoubtedly industry-specific strategic factors to consider).

That the boom will pass is something of a truism; in the long run, all commodity booms are dead. The issue for Australia today is whether the adjustment is gradual and orderly, giving us time to adjust our economic settings, or whether it happens in a hurry, with our naked bodies left embarrassingly exposed by the receding tide.

Of course, this process has certainly already begun. Thus far, however, the timidity of a clique of cadres in Beijing has deferred a more serious correction emanating from China. At the same time, Australia has made progress shifting its growth drivers away from mining, towards other sectors. Mostly, housing is picking up the slack. While the uplift in residential construction is welcome, the surge in house prices is less so, and is likely compounding the risks that have been brewing to our north for the past couple of years.

Part 3: China

All charts courtesy of the RBA

Strayan Rates – Part 1

The economic fate of the world’s inhabitants is remarkably beholden to the trajectories of its key interest rates. Of these, the apex rates are those on US government debt securities. Considerable (though far from absolute) influence is exercised the over these rates by the Federal Reserve, and thus rivers of ink are flowing at present in service of the question, When will the Fed adjust the target federal funds rate?

The answer may not be as momentous, but we’re asking a similar question in Australia. Picking the path for the RBA’s cash rate is a prime task for any would-be economic forecaster, as it’s both a key indicator of economic conditions as well as a critical determinant of them.

Let’s take a look.

Presently the cash rate sits at 2.5%. This is generally reported as being the lowest on record. It certainly is since inflation targeting was gradually adopted in the early 1990s, the period over which comparisons are most relevant.

Screen Shot 2014-08-26 at 1.05.25 pm

Last week Tim Toohey of Goldman Sachs caved and discarded his 2014 rate cut call. That leaves industry forecasters in unanimous agreement (so far as I am aware): the RBA is not cutting interest rates again. Time to fix those mortgages!

So if no more cuts, when will the RBA hike? AMP, CBA, Barclays, HSBC, and St. George reckon Q1 next year. Citigroup and ANZ think Q2. Westpac and JPMorgan are eyeing Q3, and Deutsche Bank thinks not before 2016.

The RBA is evidently happy to maintain its inaction for a while yet, reiterating in the last monetary policy statement that “the most prudent course is likely to be a period of stability in interest rates.” Such tranquillity is unusual. Indeed, if we make it through to April next year, it will mark the longest period absent a change in interest rates we’ve ever known.

In a country like Australia, changes to interest rates tend to be quite effective in influencing economic conditions. Lower rates stoke borrowing, asset prices and consumption, giving way to higher rates, and vice versa. Why then are we drifting across a calm blue ocean of low interest rates?

Primarily due to the uneasy schism that has emerged in our economy. On the one hand we have the descent from what has almost certainly been the biggest terms of trade/investment boom in our nation’s history. On the other we have a raging house bubble boom. Which force prevails in this struggle will determine the short- to medium-term direction of interest rates.

Part 2: Terms and Conditions

Strayanomics. Get around it.

I arrive a tardy guest at the econ blogosoirée. Not the most erudite of attendees, or the best-dressed, but an eager one nonetheless.

Australia is where I live. Among other things, it’s an economy. The economic forces that churn behind the scenes in the daily lives of Australians are of great interest to me. Of course, these forces are not confined to our shores; they bubble and rage from across the seas, enriching or imperilling us at their leisure.

They will also form the principal subject of this blog, as they do for a pantheon of other excellent blogs today.

Economic exchange is a fundamental activity of human civilization. When folks exchange things, a market arises. The craziest of all markets are financial. As peaceful as it would be to partition financial markets from the rest of our lives, they are deeply intertwined.

And so the vicissitudes of global financial markets will feature regularly, as again, they usually do on these sorts of sites.

I’ve adopted yet another mangled compound of the word economics as the title of this blog. Soz.

Australia. Economics.

Strayanomics.