Monthly Archives: September 2014

Straya T’day 16/9/2014 (updated)

Iron rockets

As discussed on the weekend, Chinese data seriously undershot expectations, taking industrial production growth to the slowest pace since the GFC. I mentioned that the market reaction would be interesting since such poor data would push the government further towards more aggressive stimulus measures (at least in the market’s eyes).

The other point I highlighted in the weekend post was the clear signs of stabilisation in the iron ore and steel markets last week.

With iron ore futures in contango, low steel mill inventories, and terrible data, we had the perfect conditions for a rebound in iron ore, and indeed we got it: spot soared 3.9% to $85.20.

ironore16

So, the rebound is upon us, with iron ore and steel futures jumping again this morning in China. Mills have been running lean inventories, and many buyers have been sidelined over the past few weeks in anticipation of lower prices. We’ll likely see a healthy squeeze from here, but I will be most surprised if spot makes it into triple figures, given the chronic oversupply situation emerging in iron ore, the ongoing flush out of property excesses, and the inexorable down trend in fixed asset investment (FAI) growth generally.

To see iron ore stage a sustained recovery above $100 we would need to see a complete abandonment of the Chinese leadership’s commitment to structural reform, and a wholesale re-adoption of FAI stimulus. This remains a remote possibility. Just last week, Chinese Premier Li Keqiang had the following to say at the World Economic Forum:

Growth in emerging market economies has slowed down, and the Chinese economy faces greaterdownward pressure. Facing this challenging environment, we have continued to follow the general principle of making progress while maintaining stability. We have stayed thecourse and pursued a proactive approach. Instead of adopting strong economic stimulusor easing monetary policy, we have vigorously promoted reform and economic readjustment, and made efforts to improve people’s lives.

Despite growing downward pressure on the economy, more jobs were created, thanks to new steps of reform taken.

The message is unmistakable: As long as employment growth is holding up, China is not going to undertake large-scale stimulus of the sort that sends demand for steel and iron ore soaring. As China shifts to a more services-oriented economic model, with a higher share going to consumption, it is quite possible for it to sustain adequate urban jobs growth, without pumping up FAI, aided as always by gushing credit. (I’ve discussed this process in more detail in a previous post).

We saw a limited set of supportive macroeconomic policy measures from the second quarter, lasting until about a month ago. This in turn supported demand for raw material imports, but as soon as the policy support faded, iron ore and steel tanked, exacerbated by seasonal factors.

Without massive monetary support for property, iron ore is not going to go much above it’s last high of $98 on this bounce. And if it does, it will not last long. In that scenario, which is my base case, the iron ore miners will begin toppling in earnest from late Q1 2015 onwards.

Arrium’s recent equity raising was but a taste of the pain to come.

Update

The bounce in steel is looking decidedly lacklustre, with rebar pretty much falling across the curve today. This has taken the steam out of iron ore futures, with the January contract managing a mere .3% gain.

I have been loath to commit to the point too aggressively, lest a strong Q4 restock befool me, but there are very good reasons to suspect that this year the iron ore rebound will be much more muted than it has been in recent years. We should still see a rally from current low prices by the end of the year, but the risks are heavily skewed to the downside.

China data disappoints

This was supposed to be a fairly upbeat post courtesy of iron ore’s more positive price action this past week; spot fell 1.9%, after dropping close to 5% the week prior. Although it was the fifth consecutive week of declines, there was clear indications that the market was bottoming for the time being.

iron ore spot

Steel futures managed to eke out a small gain on friday, as did spot iron ore. Dalian iron ore futures dropped like a stone on wednesday before staging a heroic recovery, and although spot dropped that day it was stable into the week’s end, suggesting the worst may have been behind it, at least in the short-term.

Chinese data dump muddies the pond

Alas, the good news ended there with a fairly miserable set of figures from China’s stats bureau yesterday.

Growth in industrial production plummeted to 6.9% in August, down from 9% in July, on expectations of 8.8%.

CHina industrial production

Fixed asset investment (the long-time driver of Chinese growth), came in at 16.5%, form 17% last month, well below expectations for 16.9%.

fixed asset investment

Retail slipped as well, to 11.9%, down from 12.2% on expectations of 12.1%. They’re holding up better than FAI, which is a plus for Chinese rebalancing.

retail sales

In the most basic sense, for China to successfully rebalance, retail sales need to grow faster than FAI for an extended period, such that the investment share of GDP declines from its extraordinarily high levels it reached in the aftermath of the financial crisis.

China, as with all countries in the early phases of development, has long been characterised by elevated levels of investment. However, in response to the Asian financial crisis in 1997-1998, China pushed its investment share up to defend its growth rates. This effectively meant China was growing more and more dependent on external final consumption demand. This was fine as long as China could run very large current account surpluses with the rest of the world. However, when the global financial crisis hit, this foreign demand dried up, and China doubled down on internal investment demand (in infrastructure and property, primarily) to support growth.

In so doing it saw its current account surplus shrink as it sucked in imports of raw materials and suffered the loss of demand for its manufactures. Investment’s share climbed to levels virtually unseen in large economies. The issue was, without large current account surpluses, China had to flood its own economy with credit to support extremely high levels of investment.

Rebalancing therefore means investment growing more slowly than consumption, as well as  credit growing more slowly than nominal GDP. Credit growth has slowed, but it will need to remain at roughly the pace it is at present if China is to meaningfully rebalance its economy. The trouble is the economy is blatantly running out of puff each time credit and/or investment slows.

The central conundrum of the rebalancing process is that consumption falls when investment falls (since income is reduced) and nominal GDP growth slows when credit growth slows. How far each of these must slow before the the economy reaches a sustainable state is not known. But it is ever-more apparent that it’s not going to be as smooth a transition as the China bulls expect (‘believers’ is a preferable term to bulls, I think, in keeping with Michael Pettis’ terminology).

Market reaction

How the markets react to this in the coming week is going to be very interesting. The calls for stimulus will be deafening now, and the government is likely to respond with supportive measures of some kind. I still find it highly unlikely that an about-face is coming regarding ‘big bang’ investment stimulus, and the markets are going to be very disappointed if that turns out to be the case.

An exciting week ahead!

Straya T’day – 12/9/2014

History rhymes for valiant AUD

Despite its well-earned moniker, something finally stuck to the ‘teflon’ Aussie dollar and it’s been absolutely creamed this week, with interesting parallels to the early stages of last year’s rout.

Screen Shot 2014-09-12 at 2.28.52 pm

The staggering jobs figure yesterday didn’t provide an iota of support for the AUDUSD beyond the hour or so after the data hit the wires. In fact, the impact was just the opposite, with the pair ruthlessly sold later in the day. Something very similar happened in May 2013.

As in the past few months, the AUDUSD traded in a well-defined range up to May last year. The 1.0200 level was a widely recognised line in the sand; this year .9200 was the key support. The primary source of demand for AUD-denominated assets in each case was the attractive interest rate differential between Australia and other major economies (known as the ‘carry trade’). Carry trades can be lucrative for as long as a currency is stable or appreciating, however an aggressive reversal can erase profits in a very short space of time. This fact actually makes reversals more likely to be aggressive, since long positions profiting from carry are always on high alert for a change in the trend and thus prone to stampeding for the exits.

The RBA began hacking away at the interest rate differential in late 2011, however there was little reaction in the exchange rate, in part owing to the still-wide gap between local and foreign interest rates, but also because of the announced return of QE by the Fed in September 2012. The Aussie battled on.

As has been the case this year, there was no shortage of bearish sentiment in the lead-up to May 2013, the rationale for which was outlined in this perfectly timed piece from the Macro Man blog. The terms of trade had clearly peaked, the sharp drop in LNG mining investment over the following few years was being recognised, and the unemployment rate was trending higher.

Screen Shot 2014-09-12 at 5.48.10 pm

Signs that the RBA was likely to continue chopping at the cash rate began weighing on the Aussie early in 2013, pushing it to the lower bound of the range, but 1.0200 held nonetheless.

Then whispers of a scaling back of the Fed’s bond buying program began to seep out. One of the first manifestations of this concern was in gold, which was simply massacred, falling close to 20% in a month.

gold

The Aussie dollar wasn’t far behind. Following a soft CPI reading in late August, the RBA cut the cash rate on May 7, dragging the AUDUSD beneath critical support at 1.0200. This year it was renewed vitality in the USD, especially against the yen, that drove the initial move in the AUDUSD below support, but coincidentally, in both instances a stomping seasonally-adjusted jobs figure briefly resuscitated the pair just after the initial break (the 2013 figure was later revised down, no doubt a similar revision will transpire for the 2014 one).

2013
AUDhistory1

2014
AUD3

In both cases, the failure to re-establish support after the bullish data release was about as bearish a signal as you’ll see, and acted as the catalyst for the subsequent collapse. Longs still committed prior to the jobs report were forced to accept reality when a wave of selling arrived above the previous support levels, and folded shortly thereafter.

It’s hard to say exactly what the magnitude of the drop will be for the AUDUSD now, since so much is riding on the words and actions of the Fed. The taper of QE was announced by Bernanke in late May, and the associated plunge in US bonds was a major reason for the severity of the decline in the AUDUSD (that is to say, USD strength played a significant role).

Therefore, as is so often the case in our modern markets, we await the Fed for a sense of how big this AUDUSD selloff will be. It’s fair to say that the spike in US yields won’t be as pronounced as the first ‘taper tantrum’, so that may well limit the speed of the move. But few would look at the AUDUSD chart tonight without seeing the infirmity written all over.

Straya T’day 11/9/2014

Drowning in Jobs

Yesterday I said the market would be looking for a strong result from today’s employment report, along with reassurances that last month’s leap in the unemployment rate was a ‘statistical aberration’. Evidently the ABS has a sense of humour, because calling today’s report a statistical aberration significantly undersells it.

Supposedly 121k new jobs were created in August, in seasonally-adjsuted terms, with the labour force participation rate jumping and the unemployment rate diving back to 6.1%, from 6.4% last month.

Unsurprisingly, the result met with swift derision.

Screen Shot 2014-09-11 at 6.23.23 pm Screen Shot 2014-09-11 at 6.22.40 pmScreen Shot 2014-09-11 at 6.23.07 pm

As far as interpreting this data goes, it’s best to ignore the seasonally adjusted figure, which has long been renowned for it’s volatility, and instead focus on the trend. On this, the news was still reasonably good, with 18k jobs created, however the unemployment rate ticked up to 6.2%. The headwinds for jobs do still remain owing to Australia’s poor competitiveness profile, however fast-moving developments in the currency markets suggest some relief may be in the offing.

The price action on the Aussie battler was particularly informative. The algos leapt at the enormous beat, and pushed the AUDUSD back above the key .9200 support level which had been taken out in the previous session. This didn’t last long though, with heavy selling pressure arriving each time it retested .9200 in the afternoon. Once it was clear this level would not be re-established, the once-indomitable Aussie battler quickly gave up the fight.

AUD_11:9:14

This suggests a fairly aggressive unwind of the popular leveraged carry trade, with longs looking to get out before the all-important Fed meeting next week. Now that this range has been decisively broken, it will take a very dovish Fed to prevent a move down to the .9000 and below.

The bias is clearly lower; a break of critical support, followed by a retest and rejection after an extremely bullish (if noisy) data release, very bearish price action.

AUD2chart

I’ve had a bearish long-term view on this old boy for about 3 years. The voracious global yield hunt has supported it this year, helping it to gleefully brush aside the unfolding terms of trade bust (the booming domestic housing sector did the rest). There’s no assurances that the Fed won’t once again massage down expectations of tighter monetary settings, but the stage is definitely set for a substantially lower AUDUSD.

It took the market’s wild taper tantrum last year to really send the AUDUSD into a tailspin.

Screen Shot 2014-09-12 at 8.10.10 pm

We probably aren’t going to see such a violent sell off in bonds this year, so the pace of the sell off isn’t likely to be a ferocious. But a stampeding exit from the carry trade combined with sizeable re-positioning of shorts provides plenty of scope of a decent down move in the near future.

Stay tuned for the Fed.

Iron ore

The market is now quite clearly searching for a bottom. Futures contracts have stabilised in China in the past two sessions, which has typically signalled a turn. It looks as though we’ll only see spot prices in the 70s only briefly on this move, if at all. Alas, steel remains weak. Consequently, Chinese steel mills are running on razor thin inventories, reluctant to tie up more capital than they absolutely need to. This provides the conditions for a healthy rebound in spot iron ore prices if and when the steel price recovers and mills replenish their inventories of iron ore.

This is what the miners, and the bullish sections of the sell-side, are pinning their hopes on. There’s wide scope for disappointment here. Steel capacity in China is enormous, any turnaround in prices will be met with a rapid expansion in supply, and so prices are likely to remain in structural decline unless demand stages a heroic recovery. This I do not believe is likely, as I’ve outlined previously. Therefore I expect the inevitable rebound in spot iron ore prices to be quite muted, certainly by the standards of late 2012. If property doesn’t improve soon, then there is the risk of little seasonal rebound in iron ore prices at all.

I’ll stick my neck out and say I’m looking for a recovery just above $90 on the reversal of this down move, peaking in December, before the next leg down form January onwards, which will drive out all Australian juniors who produce at a break-even above FMG. Whether FMG can wrench its costs down fast enough to survive the reckoning is going to be one of the most enthralling corporate melodramas of our day.

Straya T’day 10/9/2014

Confidence Ebbs

The NAB Monthly Business Survey for August was released yesterday, and showed a moderation in sentiment from last month’s strong result.

NAB monthly biz

As in the Roy Morgan survey, NAB’s continues to show the finance and insurance sector, as well as the real estate sector, tearing it up, countering ongoing weakness elsewhere. Notably, the survey found a “sharp decline in profits and sales” leading to the lower result, though both remain positive.

Overall the survey is consistent with a gentle if fairly uninspiring expansion in activity.

Sadly the news wasn’t so sanguine on the consumer confidence front. Consumer sentiment was poleaxed in the wake of the first Abbott/Hockey budget. There have been signs of a thawing lately, but this survey pours cool water on that promise.

Main takeaways:

  • Federal Budget concerns remain at the forefront. This is likely to be an issue going forward since the recent drop in iron ore, if sustained, will further weigh on budget revenues. The Mid-Year Economic and Fiscal Outlook at the end of the year could therefore see a further exacerbation of budget worries.
  • The five year economic outlook took a beating, indicating that households are cognisant of the problems unfolding due to the passing of the twin terms-of-trade and investment booms.
  • Consumers expect further gains in house prices, however there was a dive in the proportion of respondents agreeing that is good time to buy a house. The housing market is entering treacherous waters.

Not good news, and if it translates to more scrimping by consumers, will weigh on business sentiment.

Iron ore 

More harrowing news on iron ore, I’m afraid, with spot dropping to $82.22. This was in spite of a big bounce in Dalian futures after an absolute hammering in early trade. The market is fishing for bottom, but unfortunately that’s going to be difficult to find while steel keeps bleeding; until there is a material improvement in Chinese steel prices, spot iron ore can happily continue the slide. And there is little to arrest the decline in steel demand as long as the property sector continues to reel.

Employment, Ahoy!

The big release tomorrow is employment. The market will be looking for a solid improvement, with expectations for a gain of 15k jobs over the month and confirmation that the last unemployment figure was largely a statistical aberration. The Aussie battler has copped a hiding this week, crashing out of its multi-month range.

chart

The market is very long, and the .9200 level very important. Tomorrow’s employment data is therefore about as critical as you get. If it beats strongly, the market will gleefully gobble up the battler and we can probably put this down to a false break. If, on the other hand, it misses, the chance of a big move lower is high.

Strayan Rates – Part 4: Safe as a House

It was a sensible thing to do, after our forebears discovered that food could be summoned from the earth beneath their feet; rather than roam, they remained. And where they remained, they built shelter. As they settled down, they came to recognise their reliance on the vagaries of the weather; indeed there seemed to be something almost human-like in its caprices. And so great sacrifices were made to propitiate these vital but fearsome forces in the sky.

In outward appearance, houses are much evolved since the days of those sedentary pioneers, but the basic function is unchanged: to provide shelter from the elements. Well, almost unchanged. Advanced civilisation has managed to assign a second function to houses: wealth-generation. In some places, so powerful has this function become that an apotheosis of sorts has been realized for the once-humble abode, and we find ourselves appeasing this latter-day deity with all the enthusiasm of our trembling forebears.


No inquiry into the direction of Aussie interest rates would be close to complete without a look at the almighty housing sector, and the unique position it holds in the modern Australian economy.

So that’s what we have here.

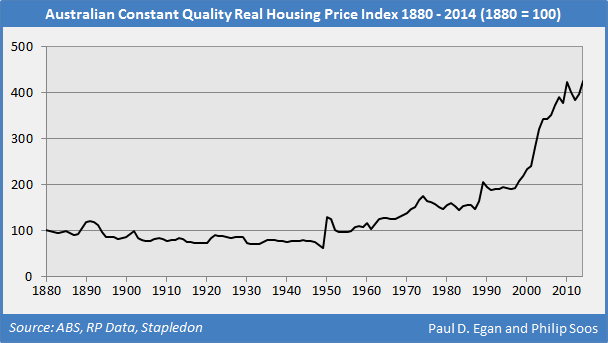
For the 60 years or so between the 1890s depression and the post-war reconstruction/Korean wool boom of the 1950s, Australian housing was a pretty lousy bet, as illustrated in this chart from Philip Soos and Paul D. Egan.

Philip_Soos_HP_03

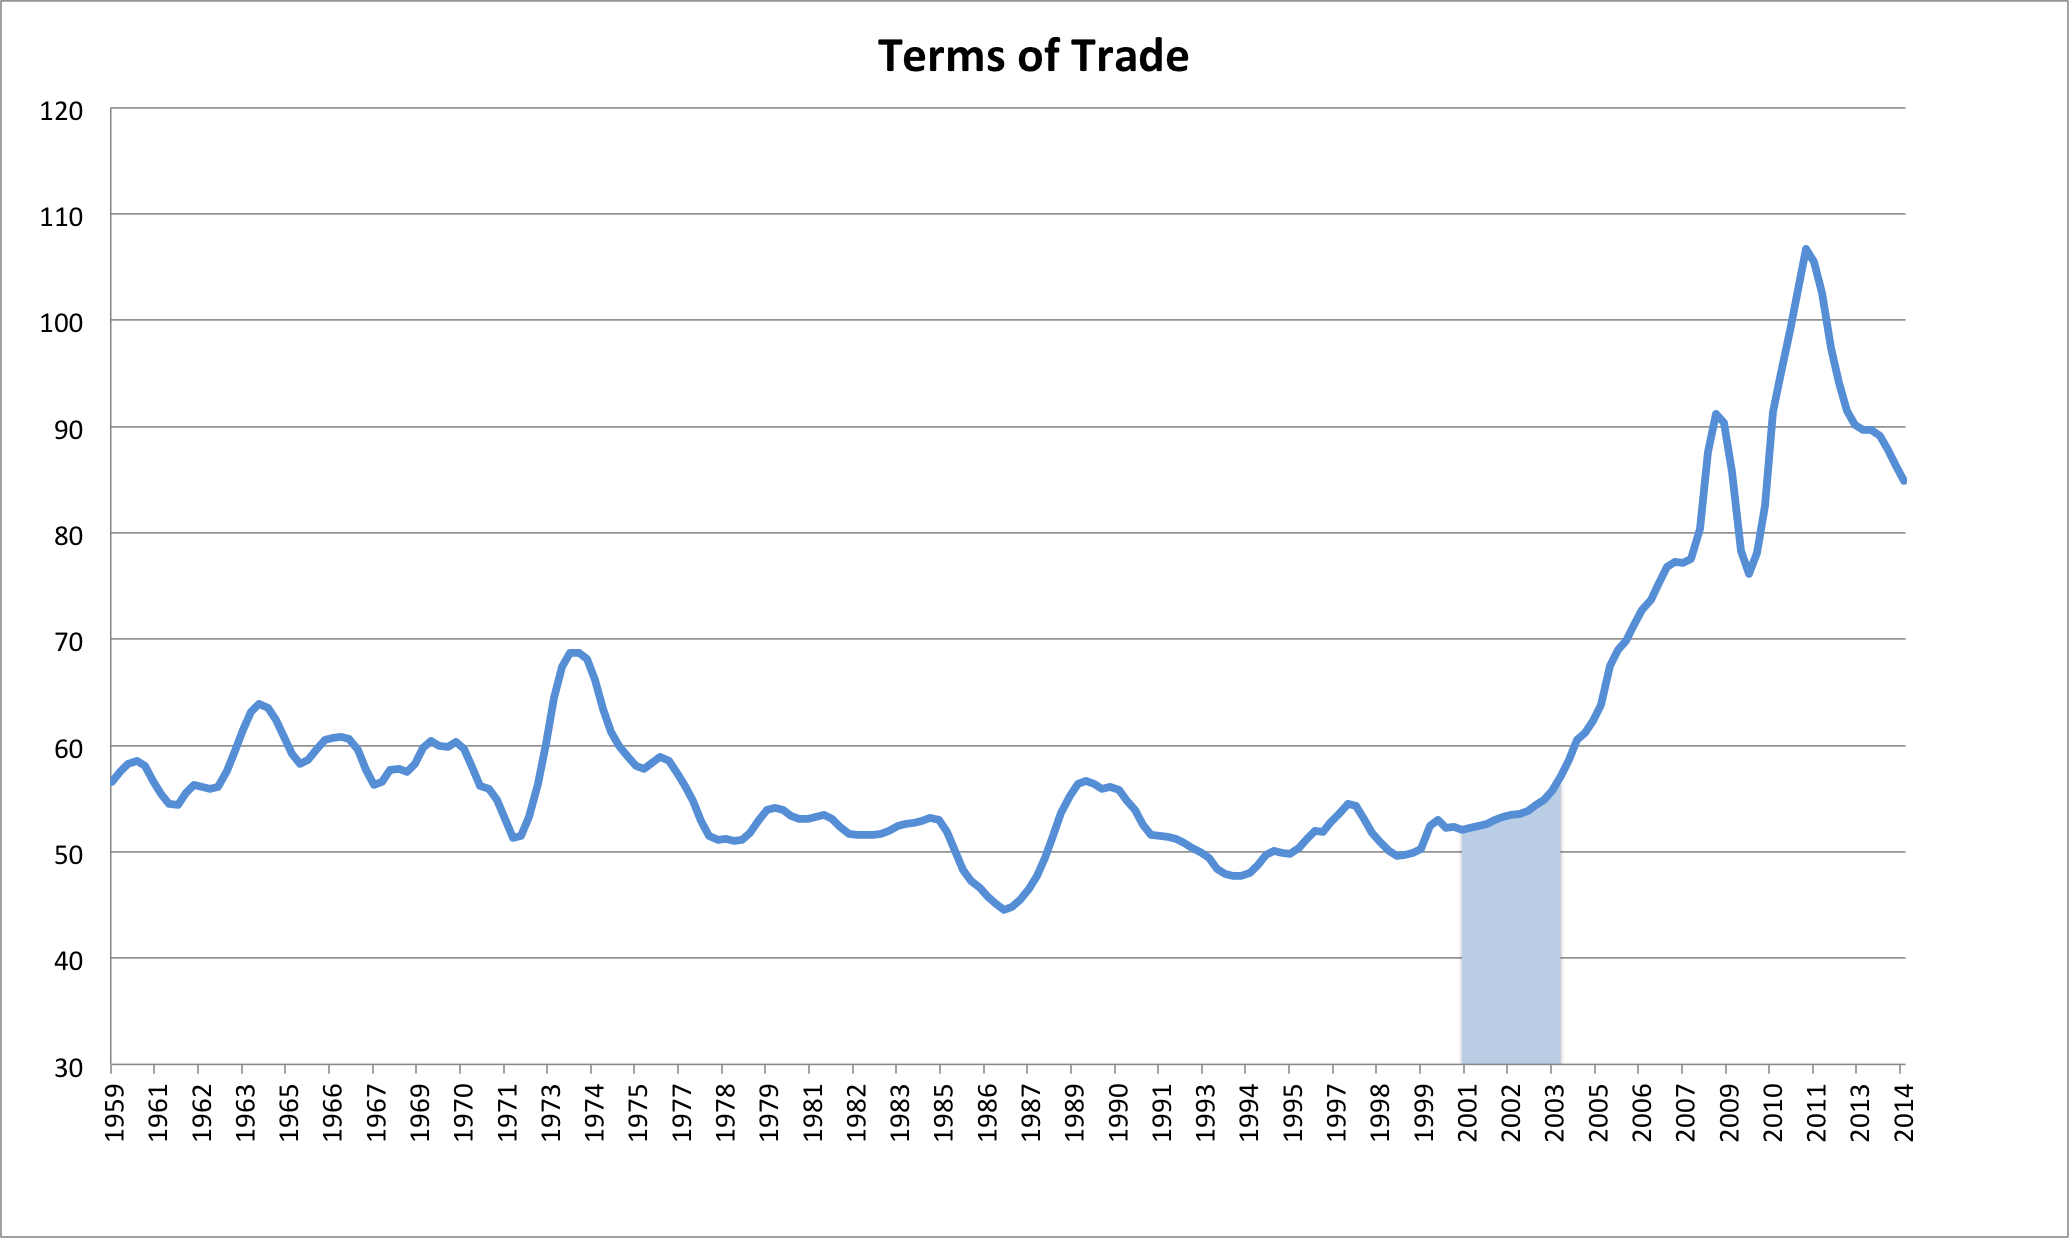
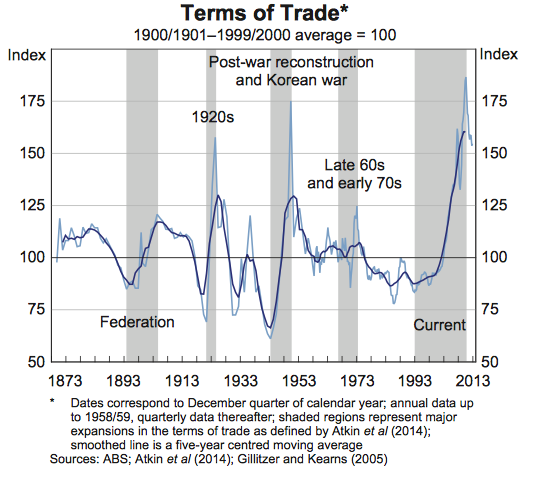
Even after the trend reversed with the post-war boom (see terms of trade chart for reference), house price growth through to the late 1990s largely tracked the long-term growth in per capita incomes. Then as the millennium approached, and despite plausible claims that confused computers would end civilization as we knew it, Australians learnt to stop worrying and love the abode.

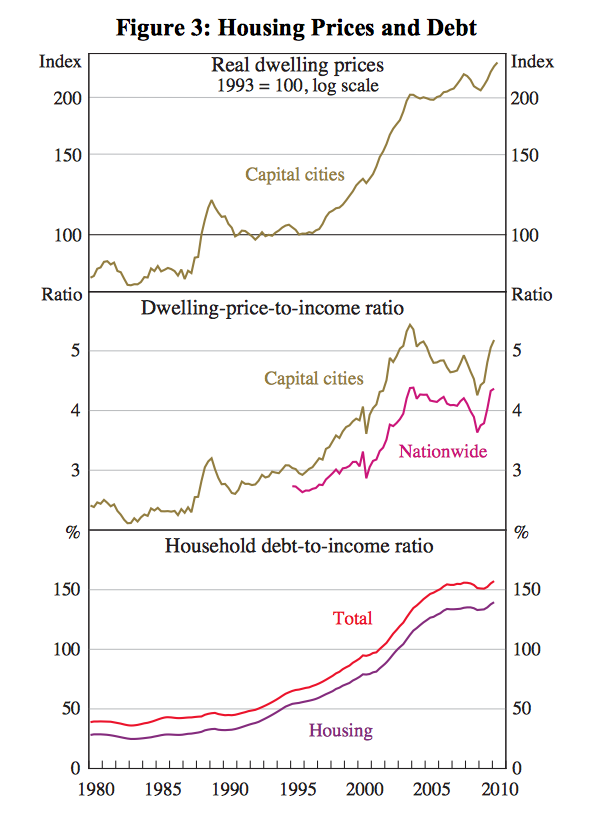
Between 1997 and 2003, dwelling prices in Australia doubled, rising by an average of 13% per annum, far in excess of income growth. This therefore drove up the ratio of house prices to incomes, with the additional demand arriving by a surge of household borrowing. (See Bloxham, Kent, Robson, 2010 and RBA, 2003b for detailed discussion of the Australian housing sector.)

Screen Shot 2014-09-09 at 1.10.27 pm

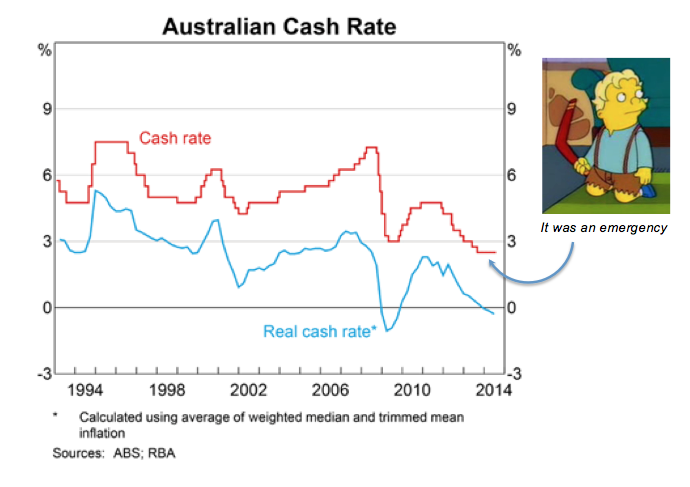
There were a number of factors that propelled the housing market through this period, however the primary influence was a halving of interest rates over the decade to the late 1990s. Inflation stabilised at a low rate during the 1990s, after a sustained period of rapid, volatile increases in consumer prices. Lower inflation saw a decline in interest rates which made mortgages more accessible. Financial deregulation in the 1980s heightened competition amongst banks and other credit providers, which further reduced interest rates and increased the availability of credit to households.

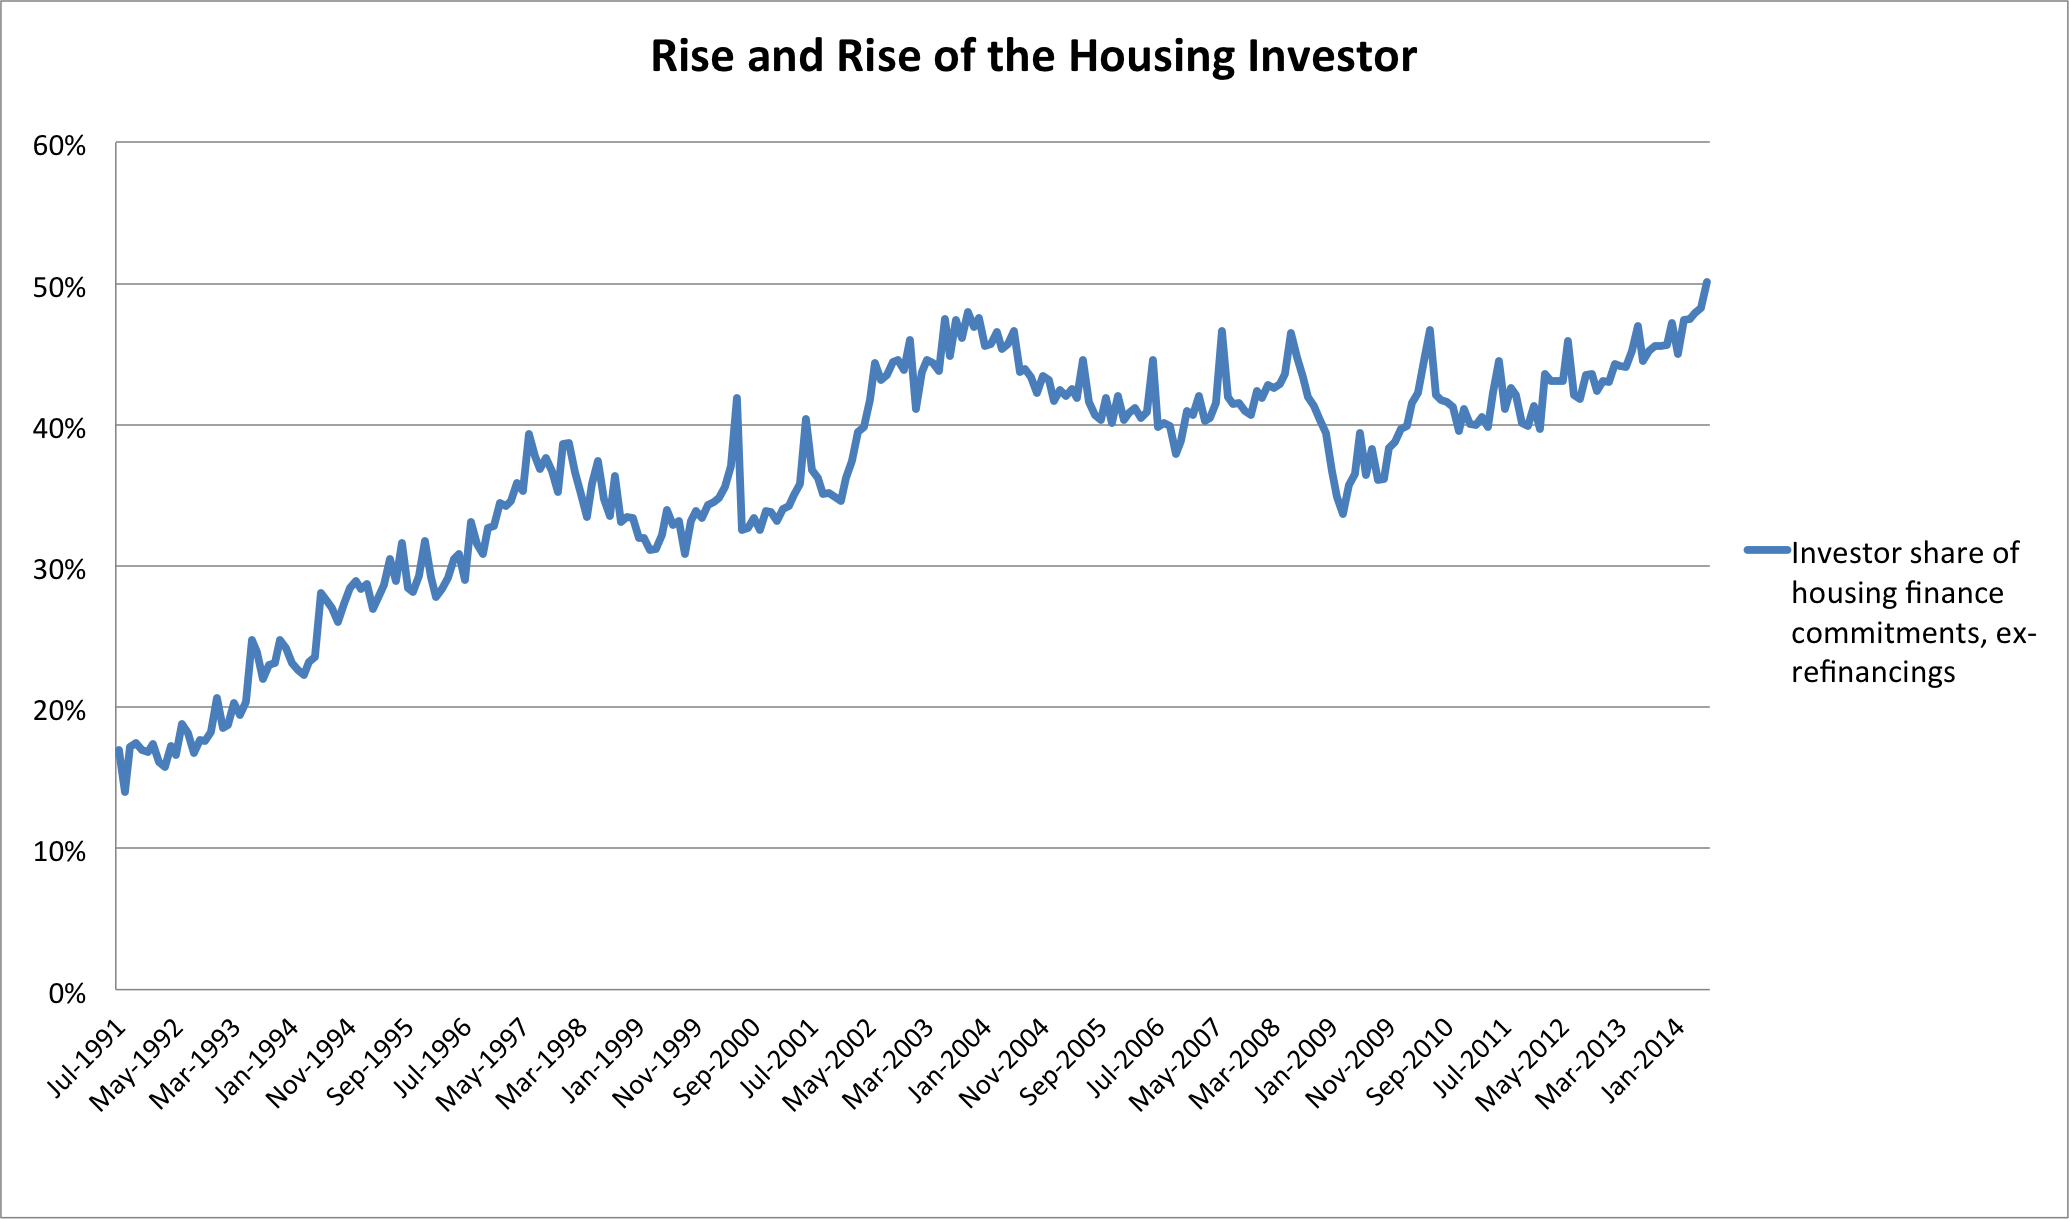
If easier access to credit ignited the boom, then structural supply constraints, government incentives and good old ‘animal spirits’ acted as the kerosene. The favourable tax treatment of property investments became particularly incendiary. In Australia, tax losses incurred on an investment property may be offset against other taxable income (the ever-controvesial ‘negative gearing’), meaning that regular cash outlays incurred through an investment property can be far below the actual costs (including mortgage interest payments). This in itself isn’t necessarily an irresistible attraction, however combined the strong appreciation in house prices in the late 1990s, it proved a potent mix. Egged on by a metastasising property investment seminar industry, the era of the Australia housing investor had dawned.

housing investor

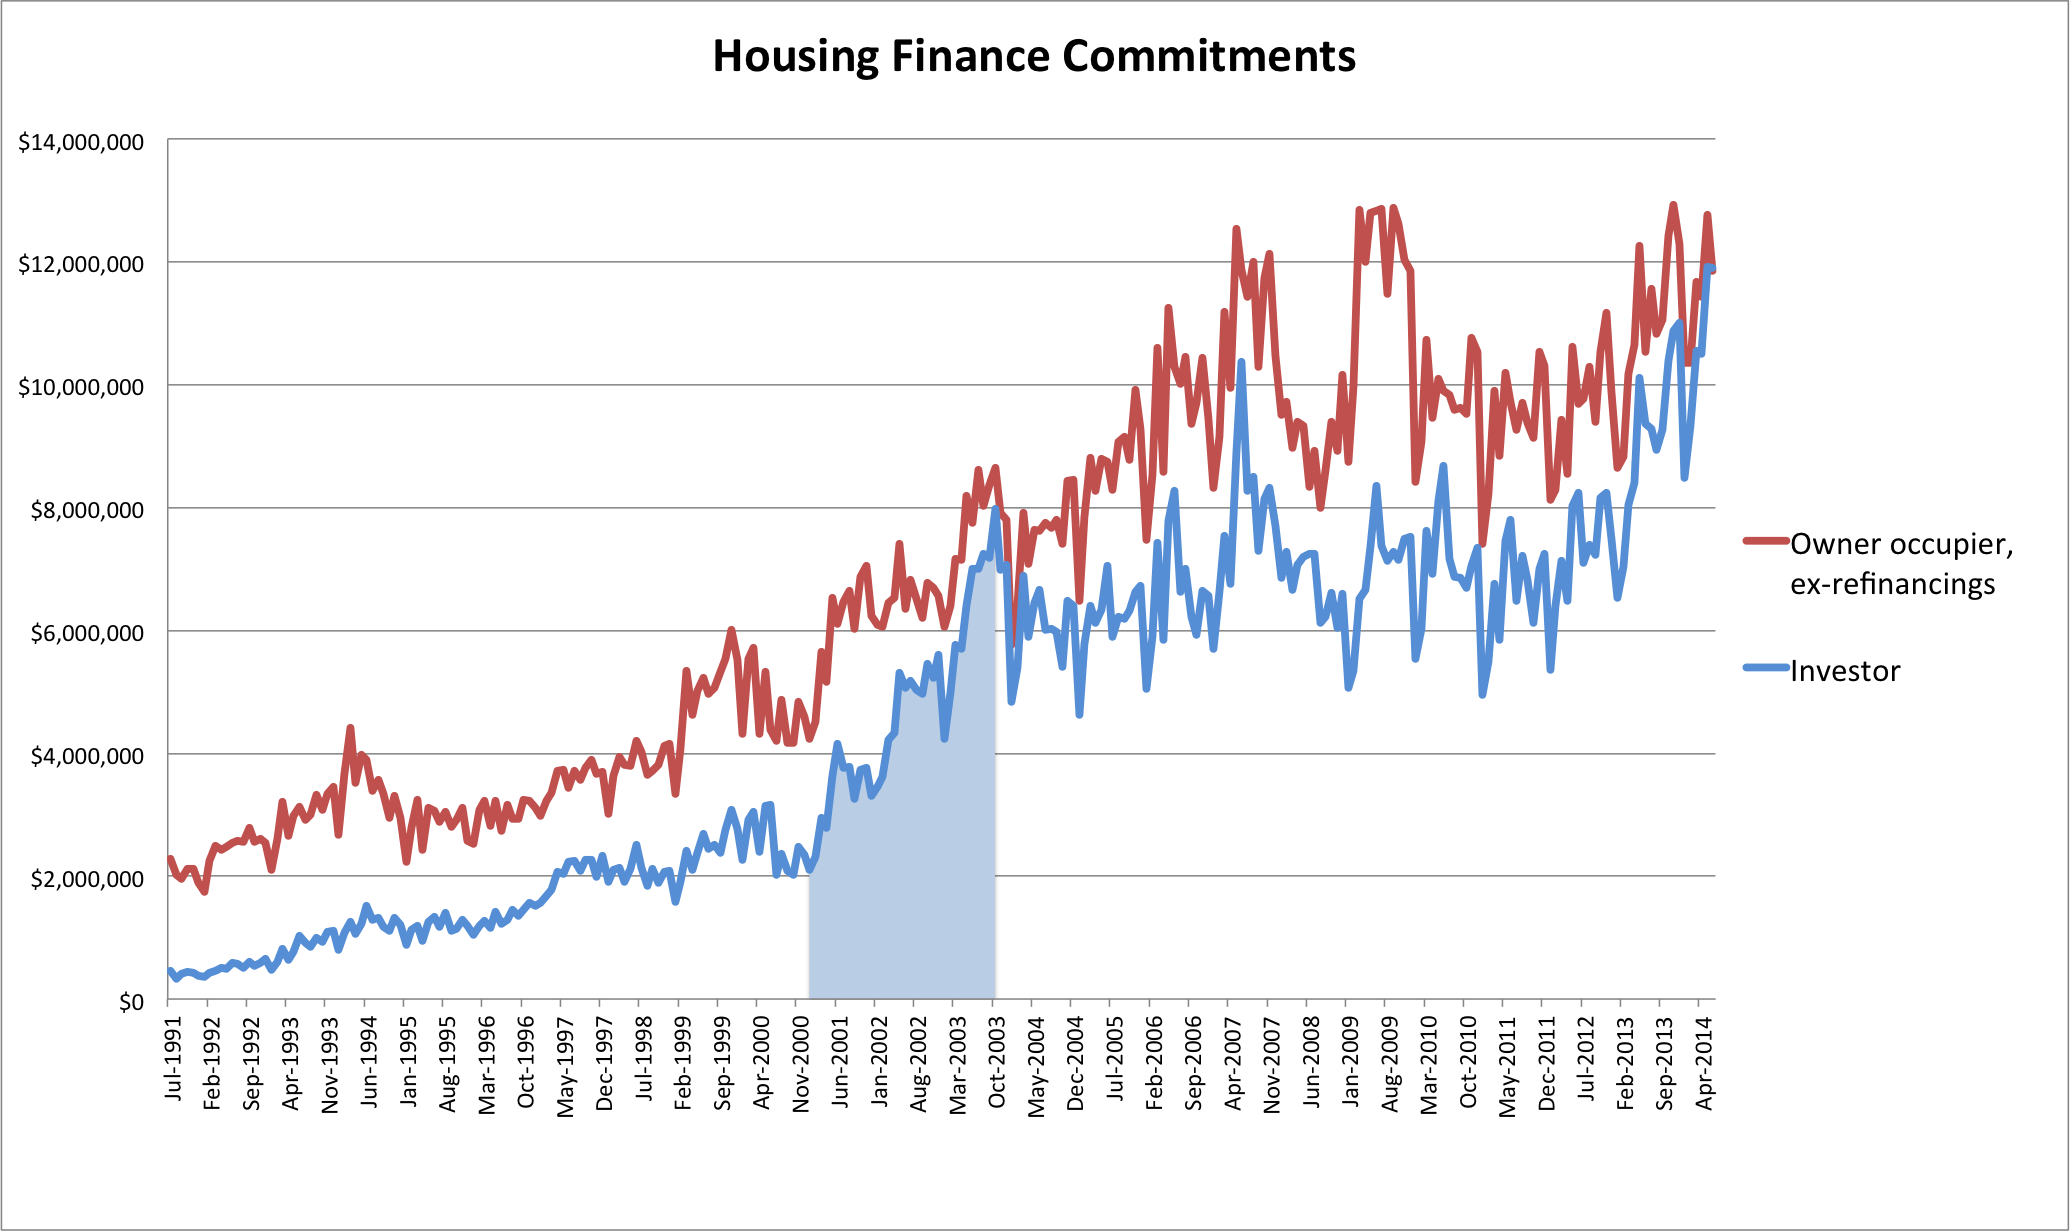
Although the growth in the proportion of all mortgages going to investors moderated between 1997 and 2003, this was largely a result of a similarly enthusiastic dash for credit by owner-occupiers, and in fact the level of total investor mortgage credit in the economy exploded in the new millennium. The approximate period of this investor frenzy is highlighted on the following charts. (All data sourced from the ABS).

hosuing finance commitments

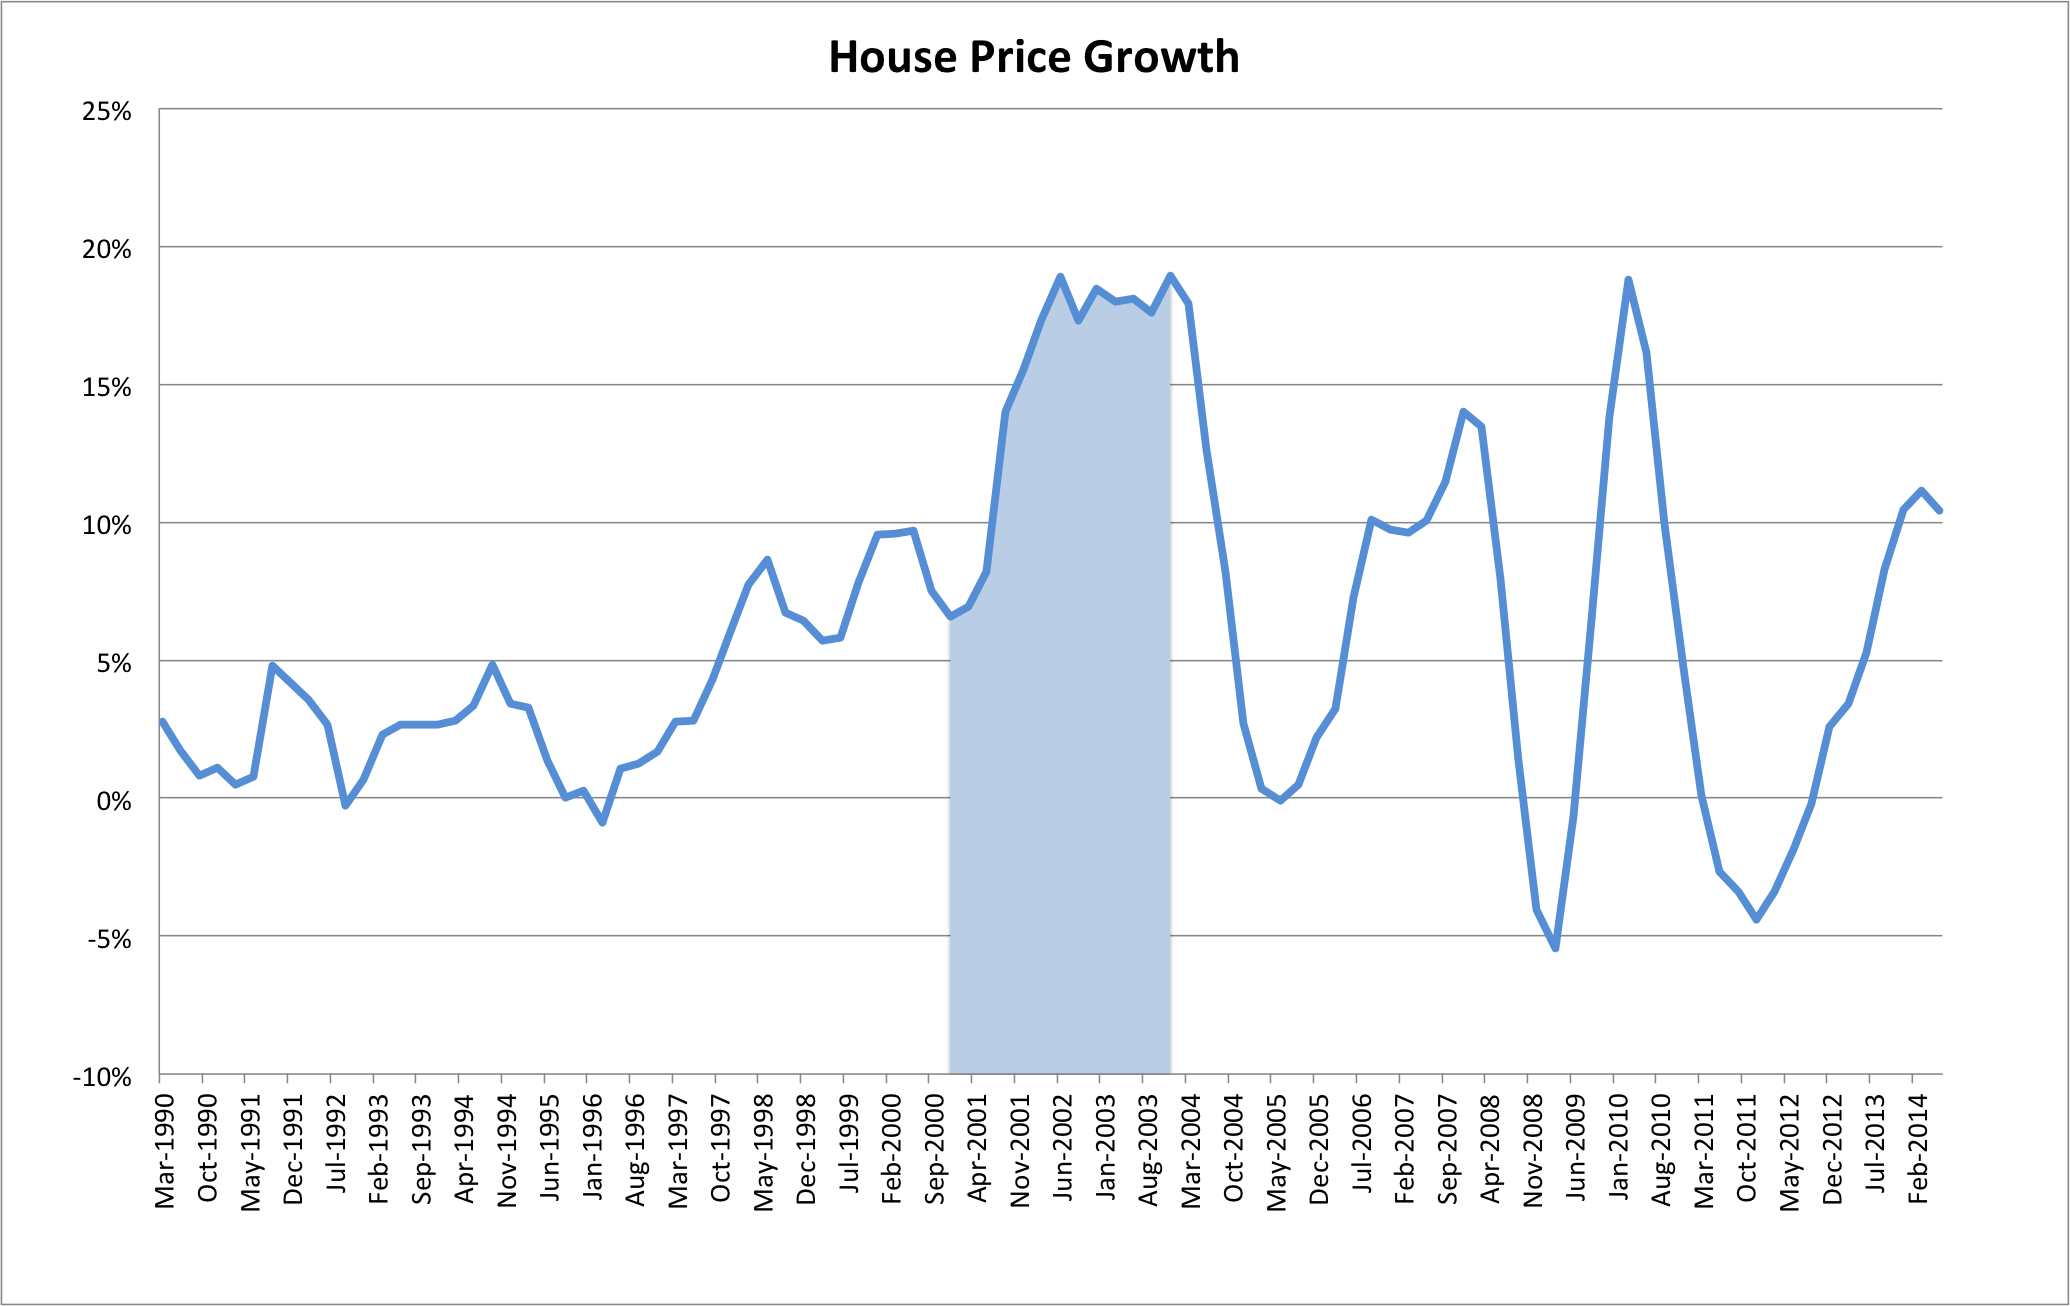
Consequently, growth in house prices greatly accelerated over this period. (The house price index chart combines two series which are not directly comparable, since there was a change in methodology after 2005. I’ve rebased the second series so that it matches up; it’s not precise but it’ll do for the purposes of illustration).

House price index

house price growth

As you can see, 2002 and 2003 saw especially rapid price appreciation, and slowed markedly thereafter.

We’ve already seen that the boom pushed house prices to great heights relative to incomes. They were similarly expensive when valued by another key metric: rental yields.

Screen Shot 2014-09-10 at 12.43.42 pm

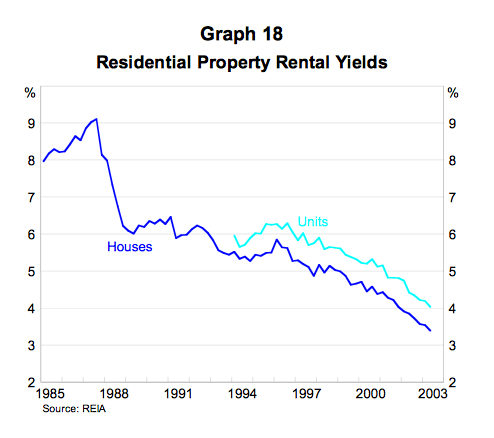
I don’t find it much of a stretch to label this episode a ‘bubble’, with the single but important qualification that it did not burst with any severity.

Bubbles have long been confounding phenomena for the economics community. Under once-fashionable assumptions, there can be no bubbles, for they defy human rationality. And yet we humans possess a stubborn contempt for our theorised behaviour, and bubbles are most assuredly real. But how to spot them? A popular view holds that a bubble can only be identified by an autopsy; until it bursts, we cannot definitively say that this or that asset market is a bubble.

I do not subscribe to this view. Rather, I agree with the argument it is possible to identify bubbles before they burst, with some degree of confidence, through key valuation metrics. The more pronounced the departure from fundamental value, the more likely a market is to be experiencing a bubble. Of course, there is always uncertainty. In particular, identifying the signs of bubble does not tell you when or how it will burst, nor does it preclude the possibility of external circumstances changing in ways that shift the dynamics of the market.

On this, Australia provides an exceptional case in point. Conditions in the housing sector leading up to 2003-2004 were undeniably bubbly, and without a sudden and spectacular rise in national income, would almost certainly have entailed a nasty hangover. Fortunately, a sudden and spectacular rise in national income is exactly what we got, courtesy of the biggest terms of trade boom in our nation’s history, which happened to arrive in earnest almost precisely as we passed peak of the housing boom. Again, the approximate period of the most manic half of the boom is shaded.

tot

This was extraordinary good fortune, even for the Lucky Country. Tax receipts pouring in from the corporate sector allowed the Howard government to reduce the tax impost on households. In addition, households came to regard savings as an unnecessary encumbrance, leading to a consumption boom. The surge in household income brought the value of house prices relative to incomes down to a more reasonable level. Anyone worrying about a housing bust following the boom was quickly disabused of the notion (the article links don’t seem to work on that page, but you get the picture).

This had important ramifications for Australia. It largely locked-in the price gains from the boom, further reinforcing the belief that house prices do not fall in a significant or sustained manner. In conjunction with the experience of the global financial crisis- when housing markets crashed around the world but Australia’s sailed through thanks to supportive government schemes, a second leg higher in the terms of trade, and a domestic investment boom- Australians now have a powerful historical precedent supporting the case for property investment (exemplified here by Adam Carr, with more than a trace of hubris).

Groundhog Boom

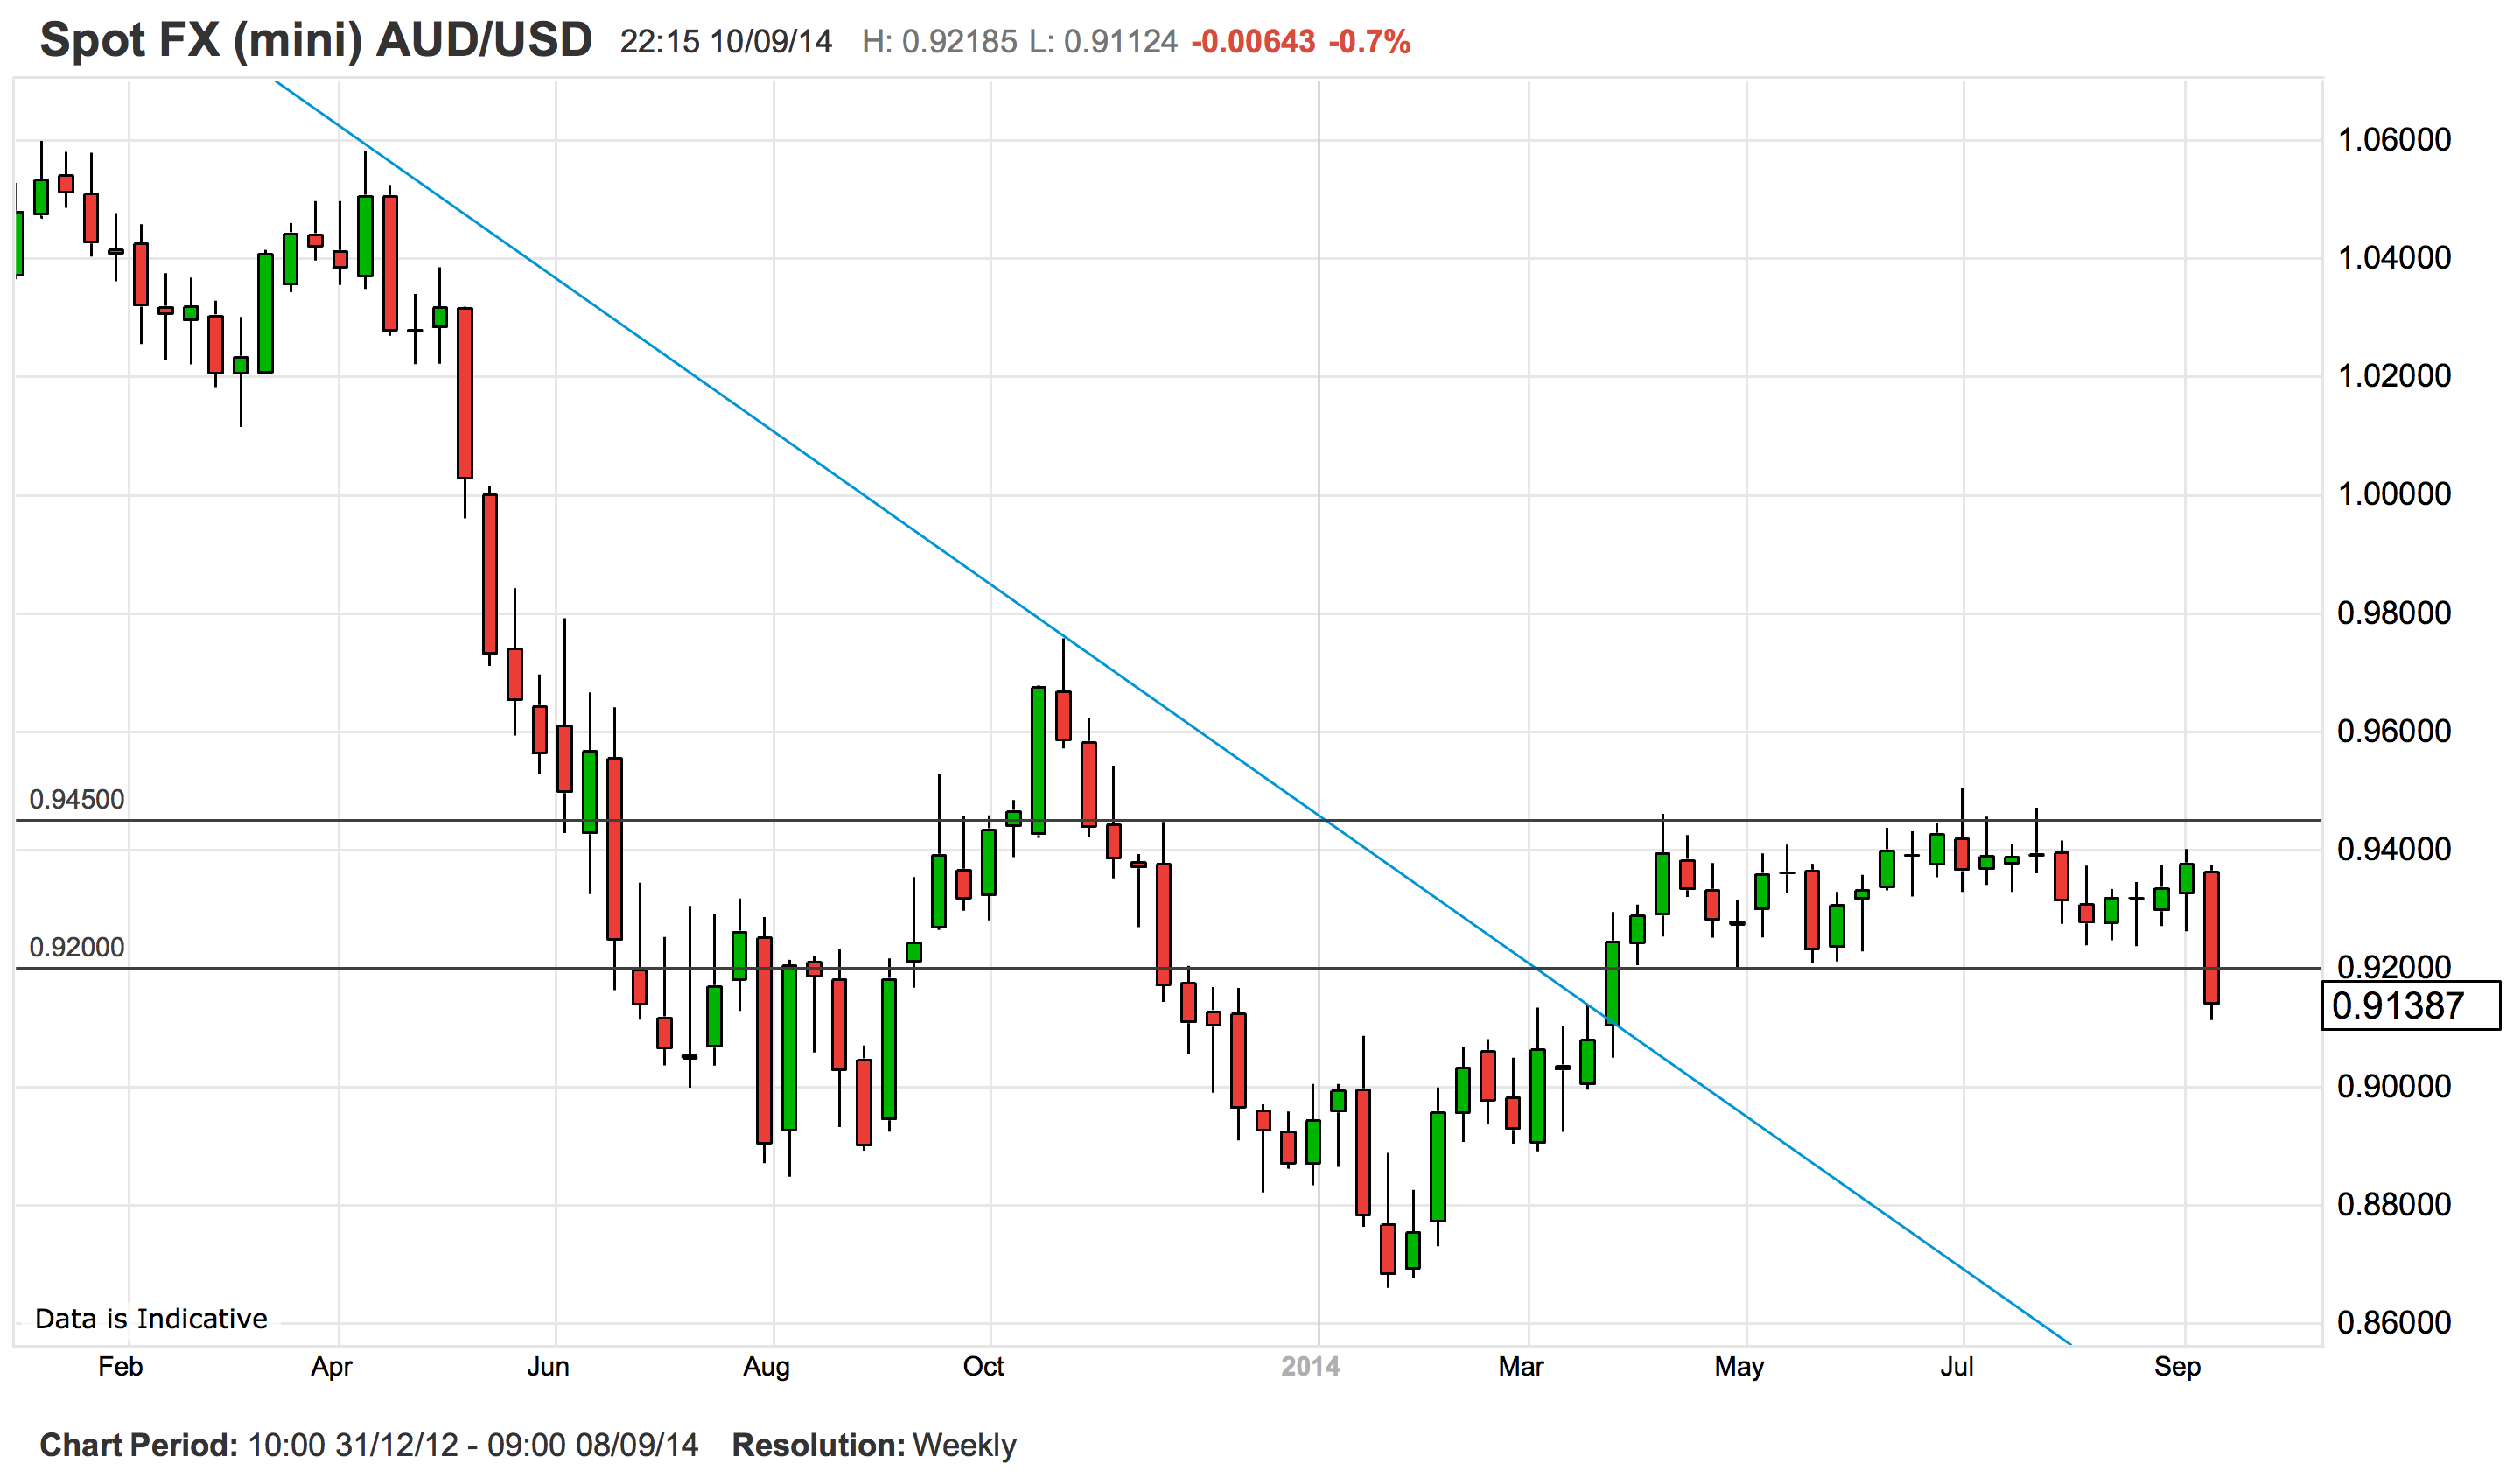
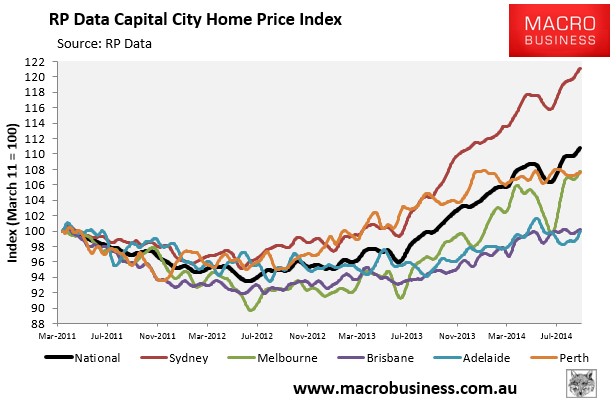
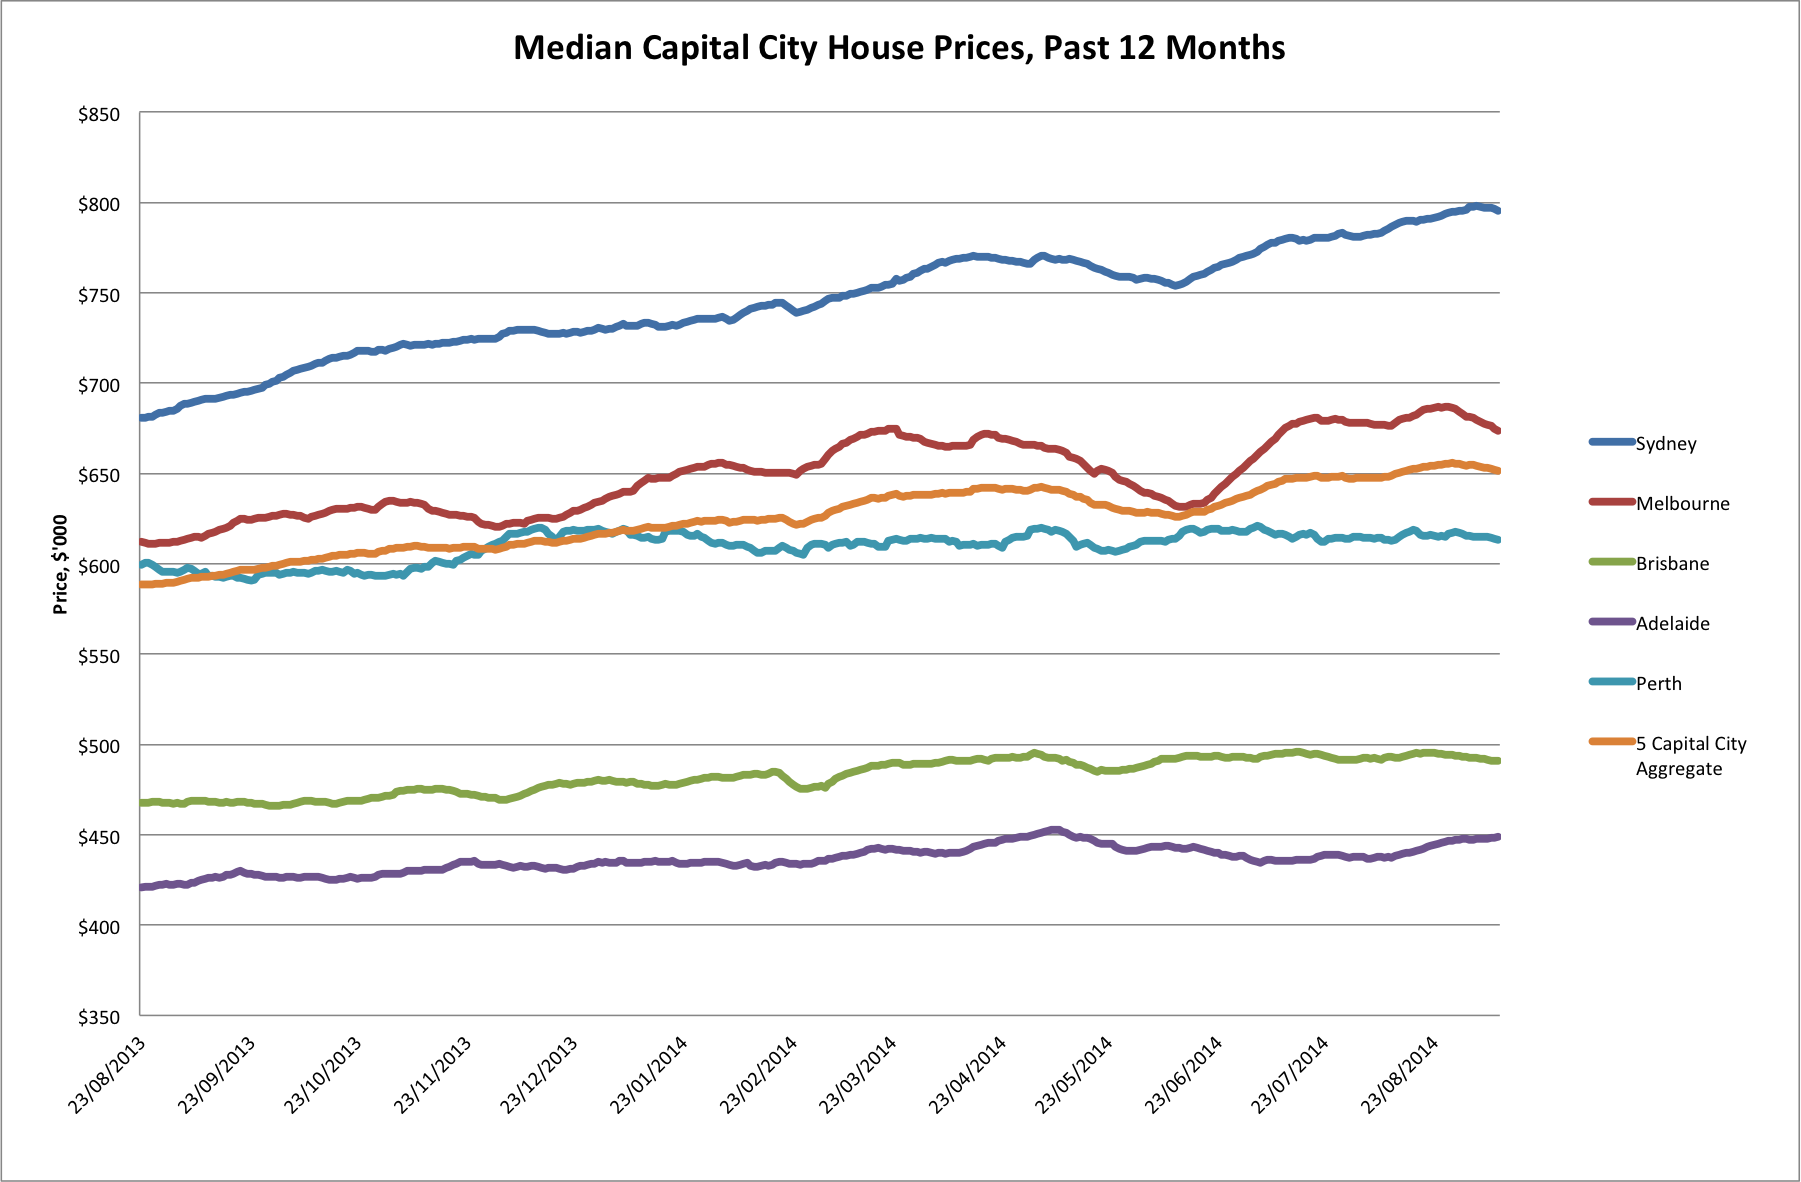
As is evident on the ‘housing finance commitments’ chart above, there has been a renewed surge in investor activity in the housing market in the last couple of years. The impetus for this was, as usual, a sharp decline in interest rates. As such, house prices have been buoyant, led by Sydney (as in the previous boom).

ScreenHunter_52-Aug.-28-16.00

Median House prices

We can clearly observe the 2014 winter lull on that chart from MacroBusiness, which some commentators conjectured to be the peak. Now that house prices have picked up the pace again, we await to see what the spring buying season brings. Are we nearing the peak, or will we scale new heights over the next 12 months? Will the laggards follow Sydney into the stratosphere, or will Sydney be left lonely on the mountaintop?

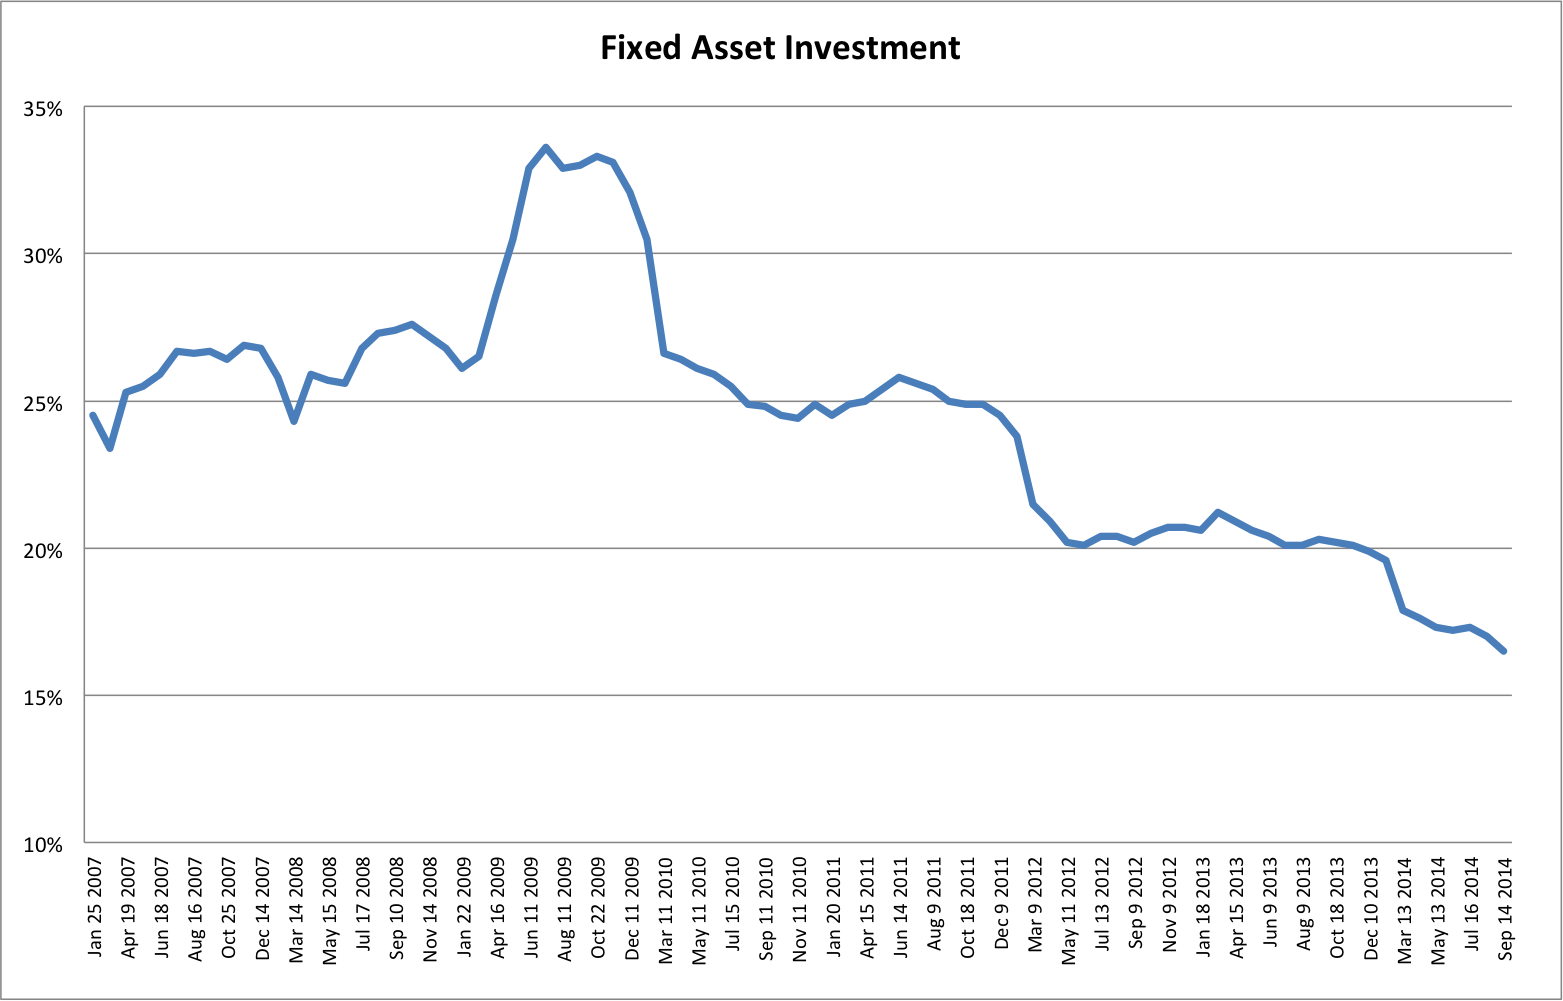
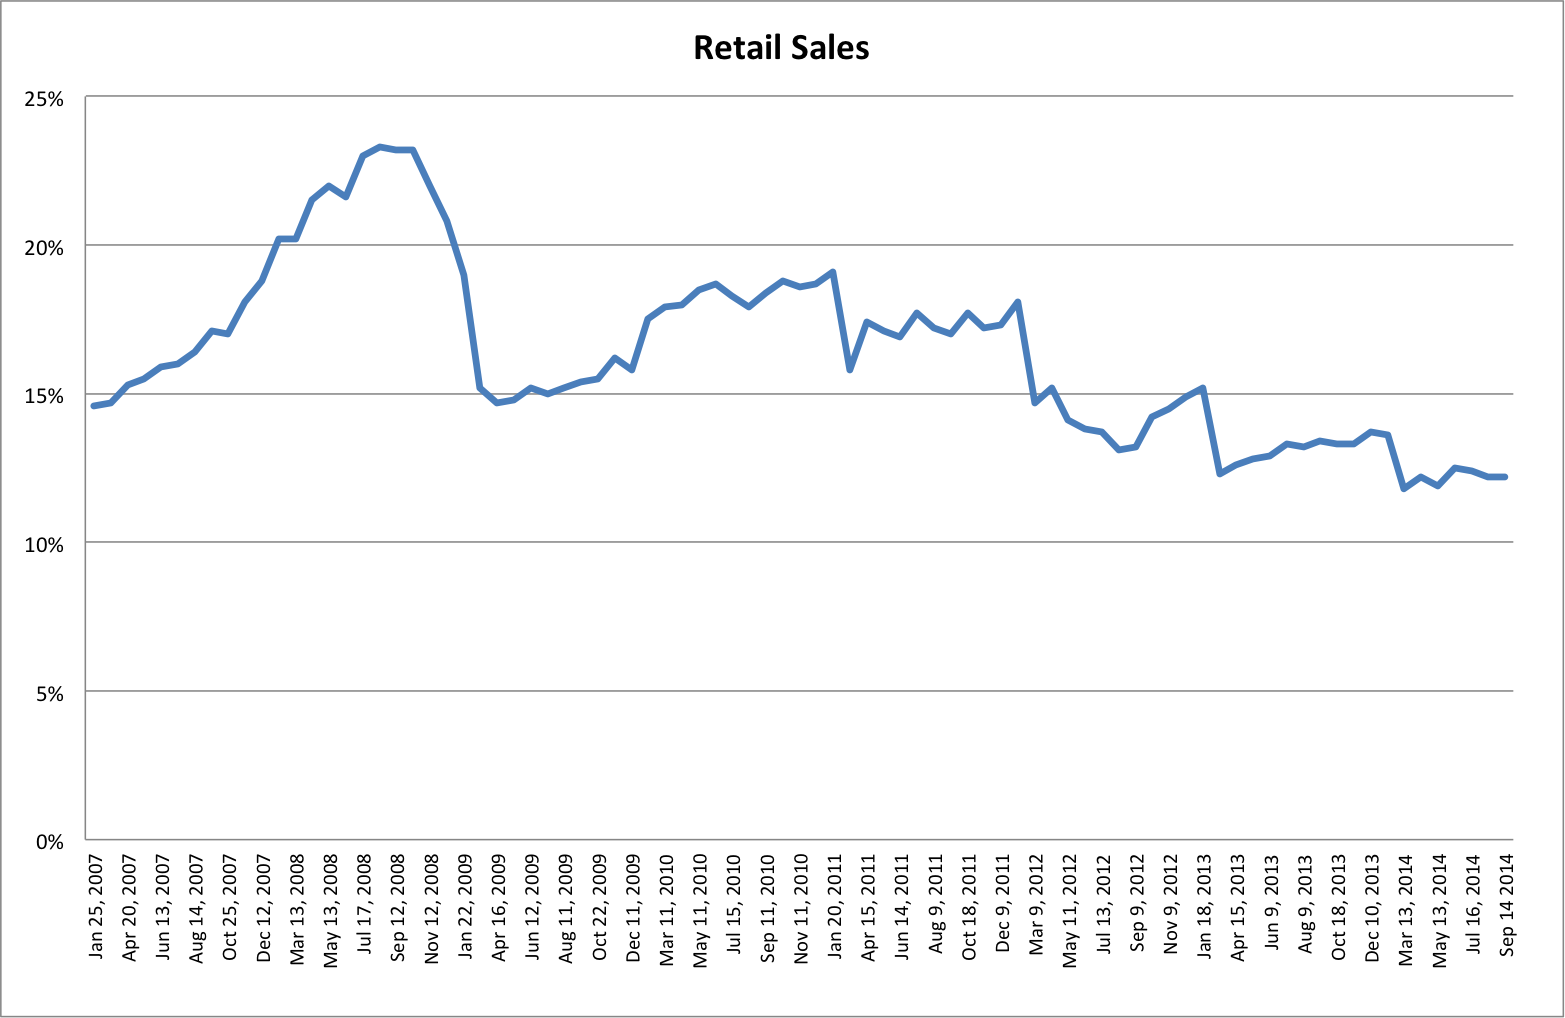
They’re pertinent questions (at least to this series of posts!). The housing boom, Sydney-centric though it may be, is really all that’s preventing the RBA from cutting further, since the only sectors of the economy responding with any verve to lower interest rates have so far been house prices and residential construction. Households remain reluctant to open the purse strings, despite the fabled ‘wealth effect’ of high asset prices, and the non-mining corporate sector is for the most part loath to invest, even with cheap credit, which is hardly surprising given the terribly elevated cost structure bequeathed to the economy by the terms of trade boom.

If house prices can find the legs for another big move higher, don’t expect the RBA to cut interest rates. As Glenn Stevens has articulated, there is concern within the bank about the state of housing. Conversely, if house prices steady and then start to cool, there is little else in the economy indicating a case for higher interest rates. Speculating on the precise path of house prices is more art than science, and depends on how long investors remain bullish on a market in which end-user demand is increasingly scarce.

One thing is abundantly clear, however; and that’s the radically different outlook for the terms of trade this time around. We are witnessing a robust, if localised, boom in the housing sector, with a high level of participation by buyers who are simply looking for capital appreciation. If a ‘once-in-a-century’ export boom rescued property the last time around we saw a speculative boom, then the question property bulls must answer today is, what will rescue it this time? (Admittedly, the boom was of a greater magnitude in 2003, though the current one started from a higher base.)

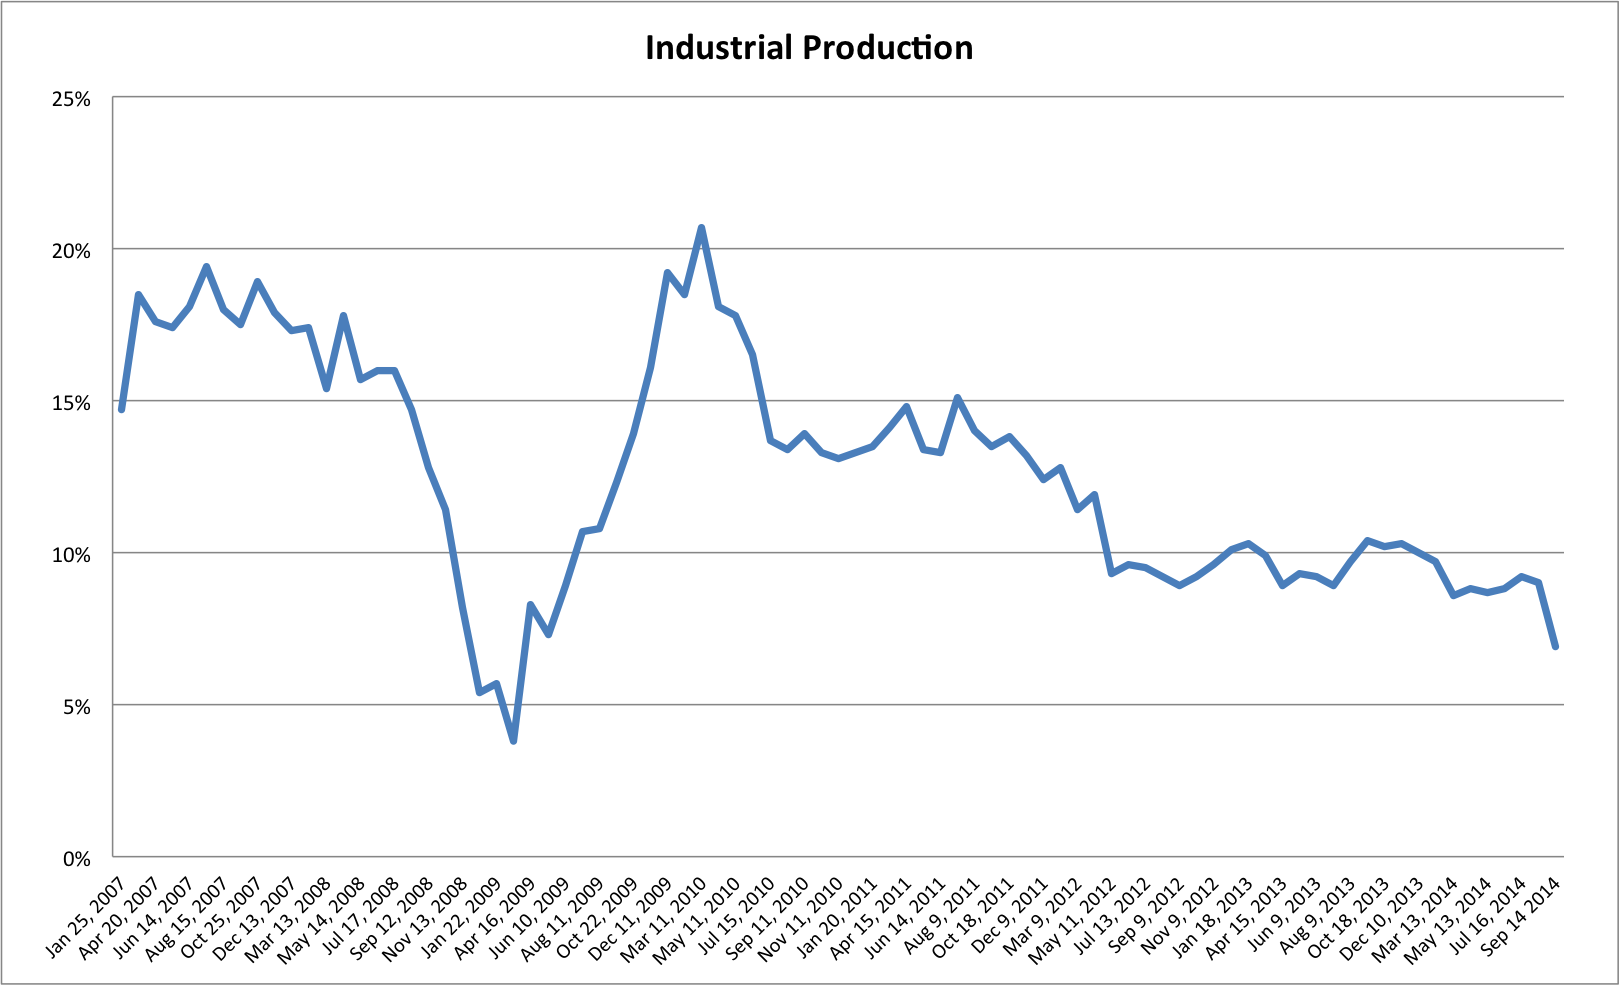
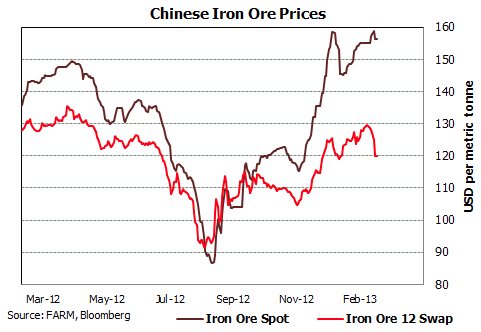
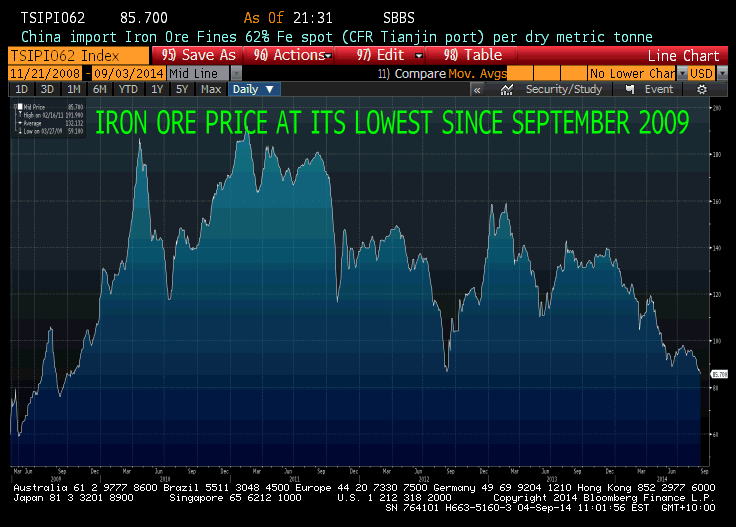
In stark contrast to the pinnacle of the last boom, national disposable income is now in decline and will continue to decline until either our terms of trade rebound or our real exchange rate falls far enough that improved competitiveness puts a floor under disposable incomes, at a much lower level. I outlined in the previous post why we’re unlikely to see China drive the terms of trade higher again. It’s not impossible in the short-run, but over the medium- to long-term, the glory days are well and truly past.

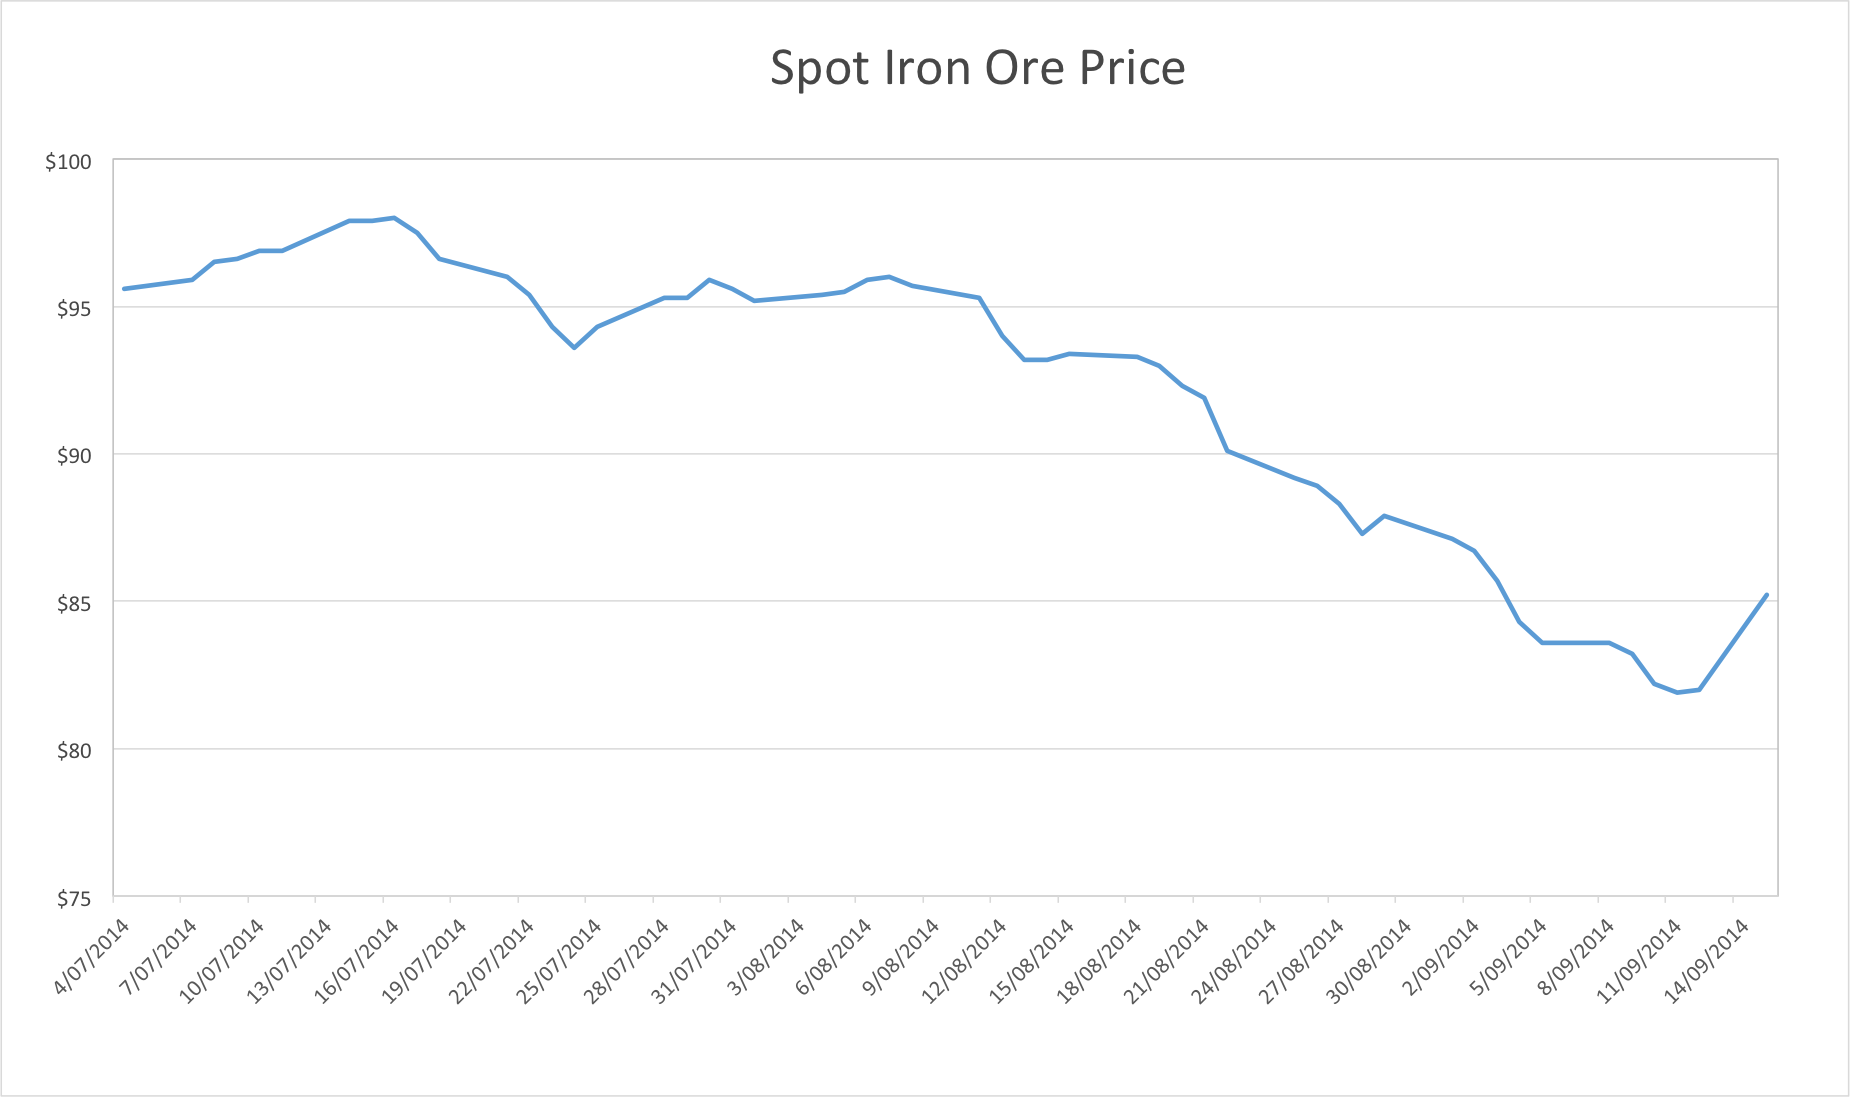
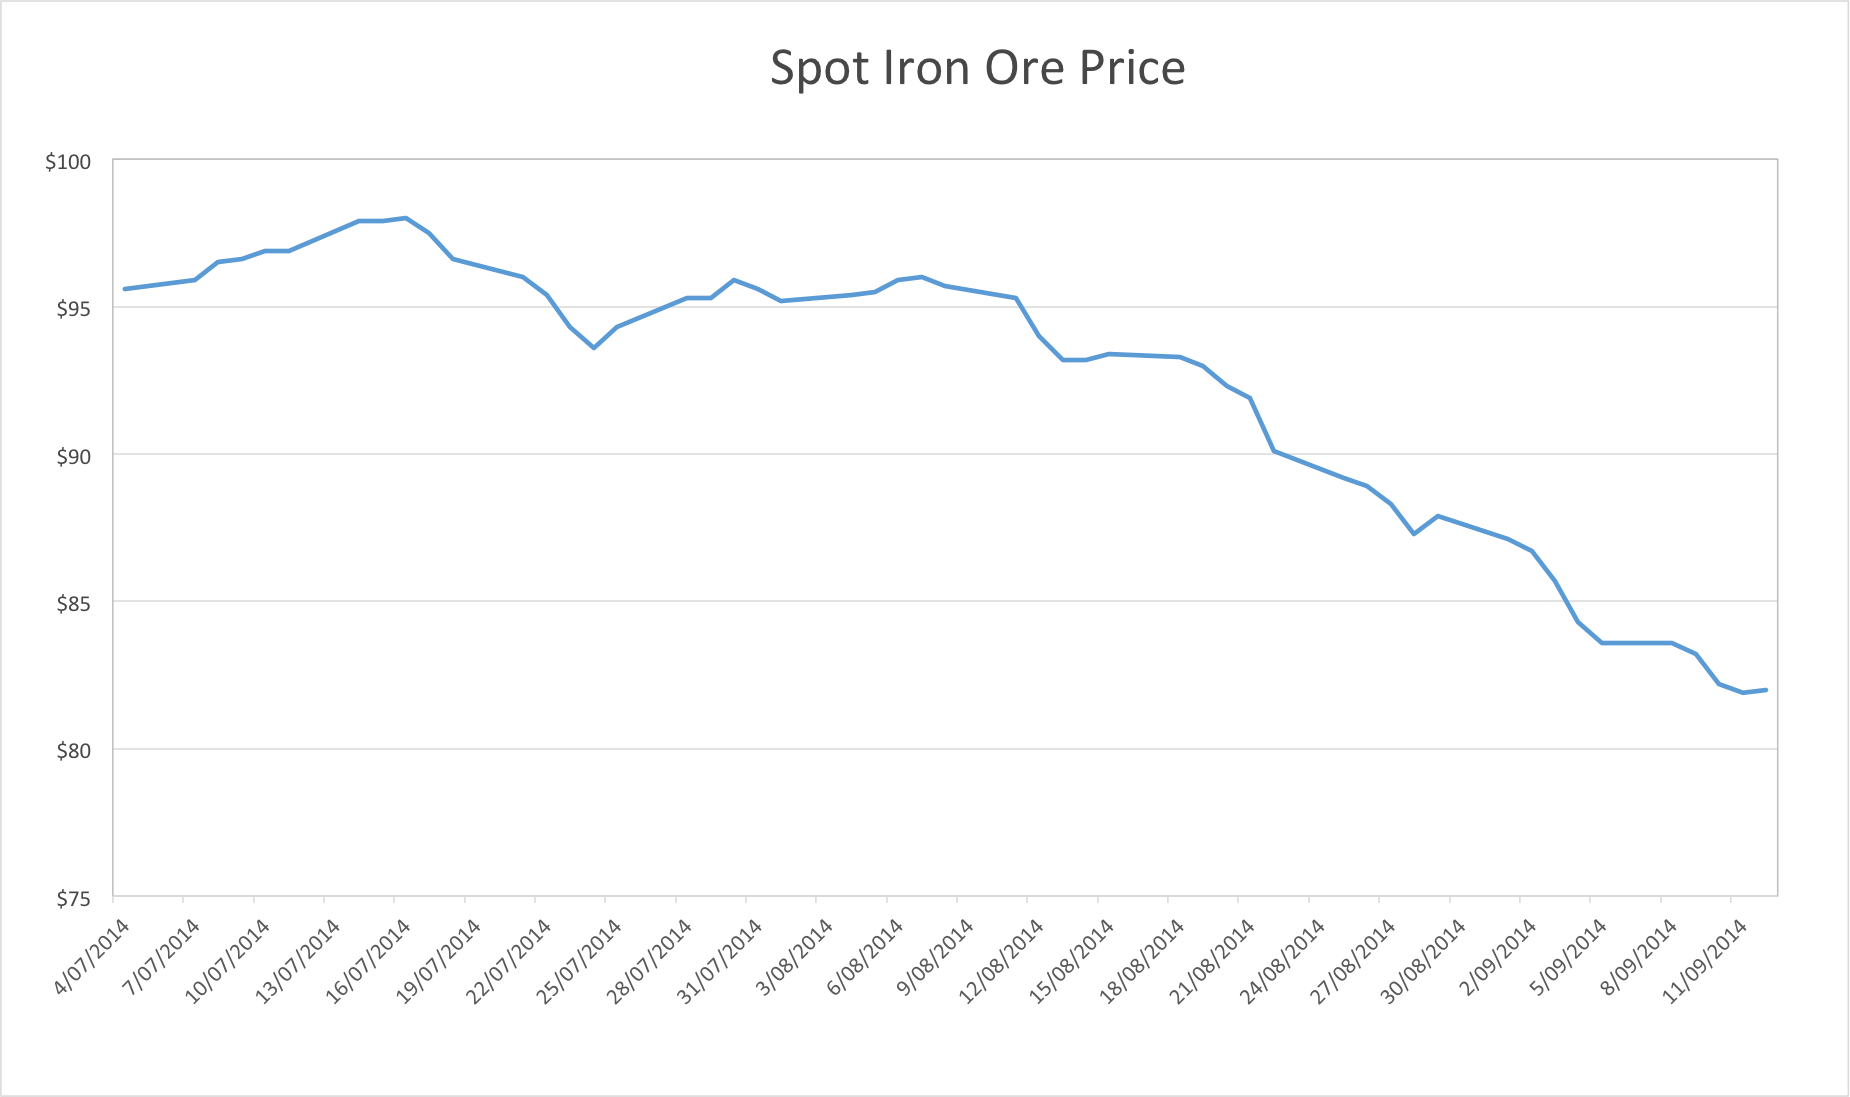
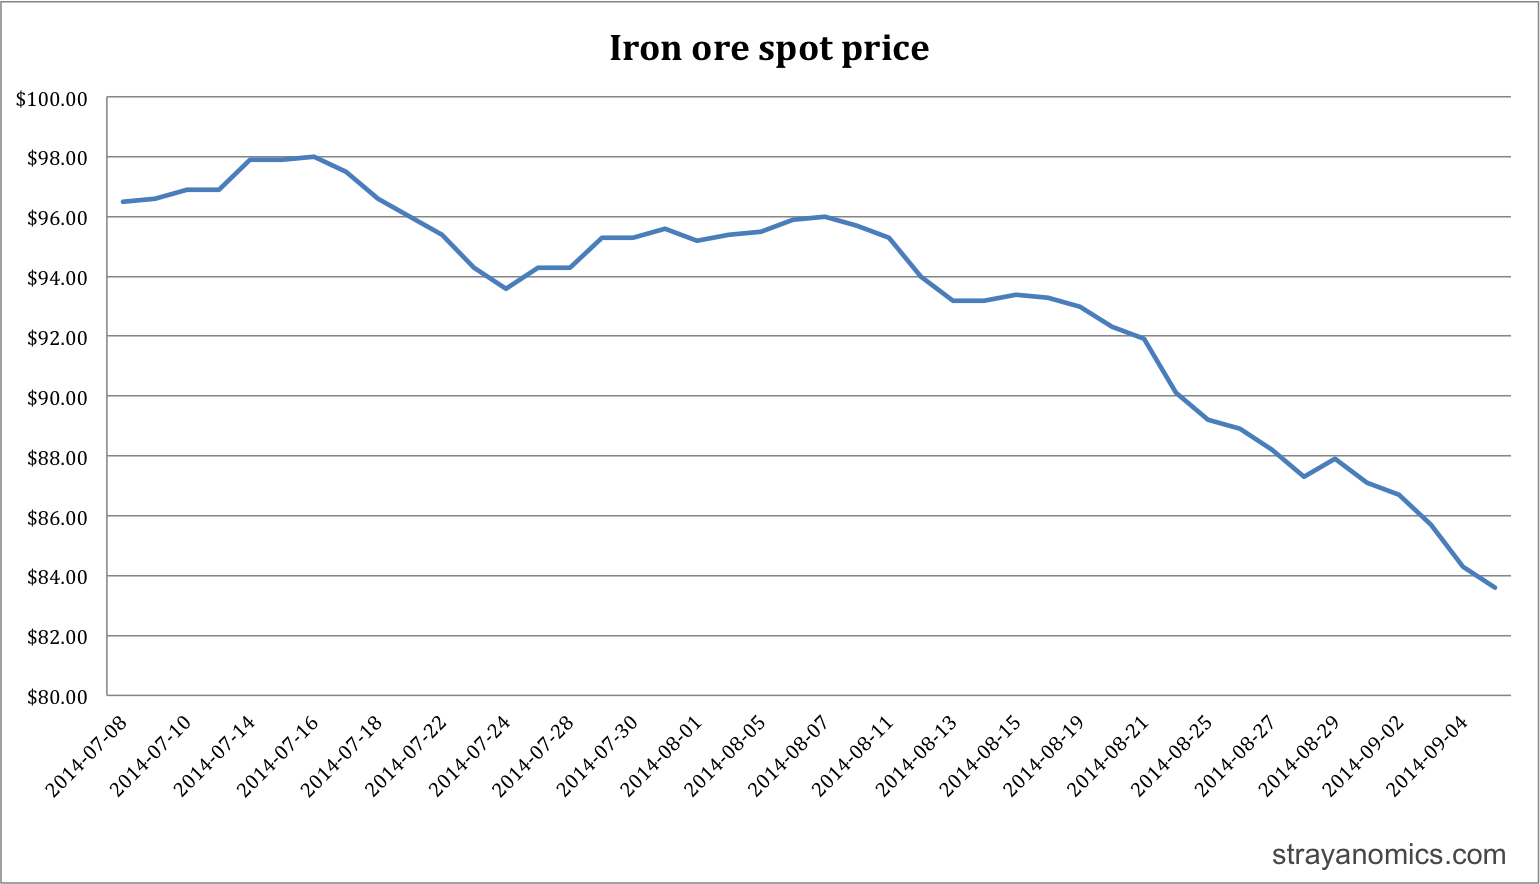
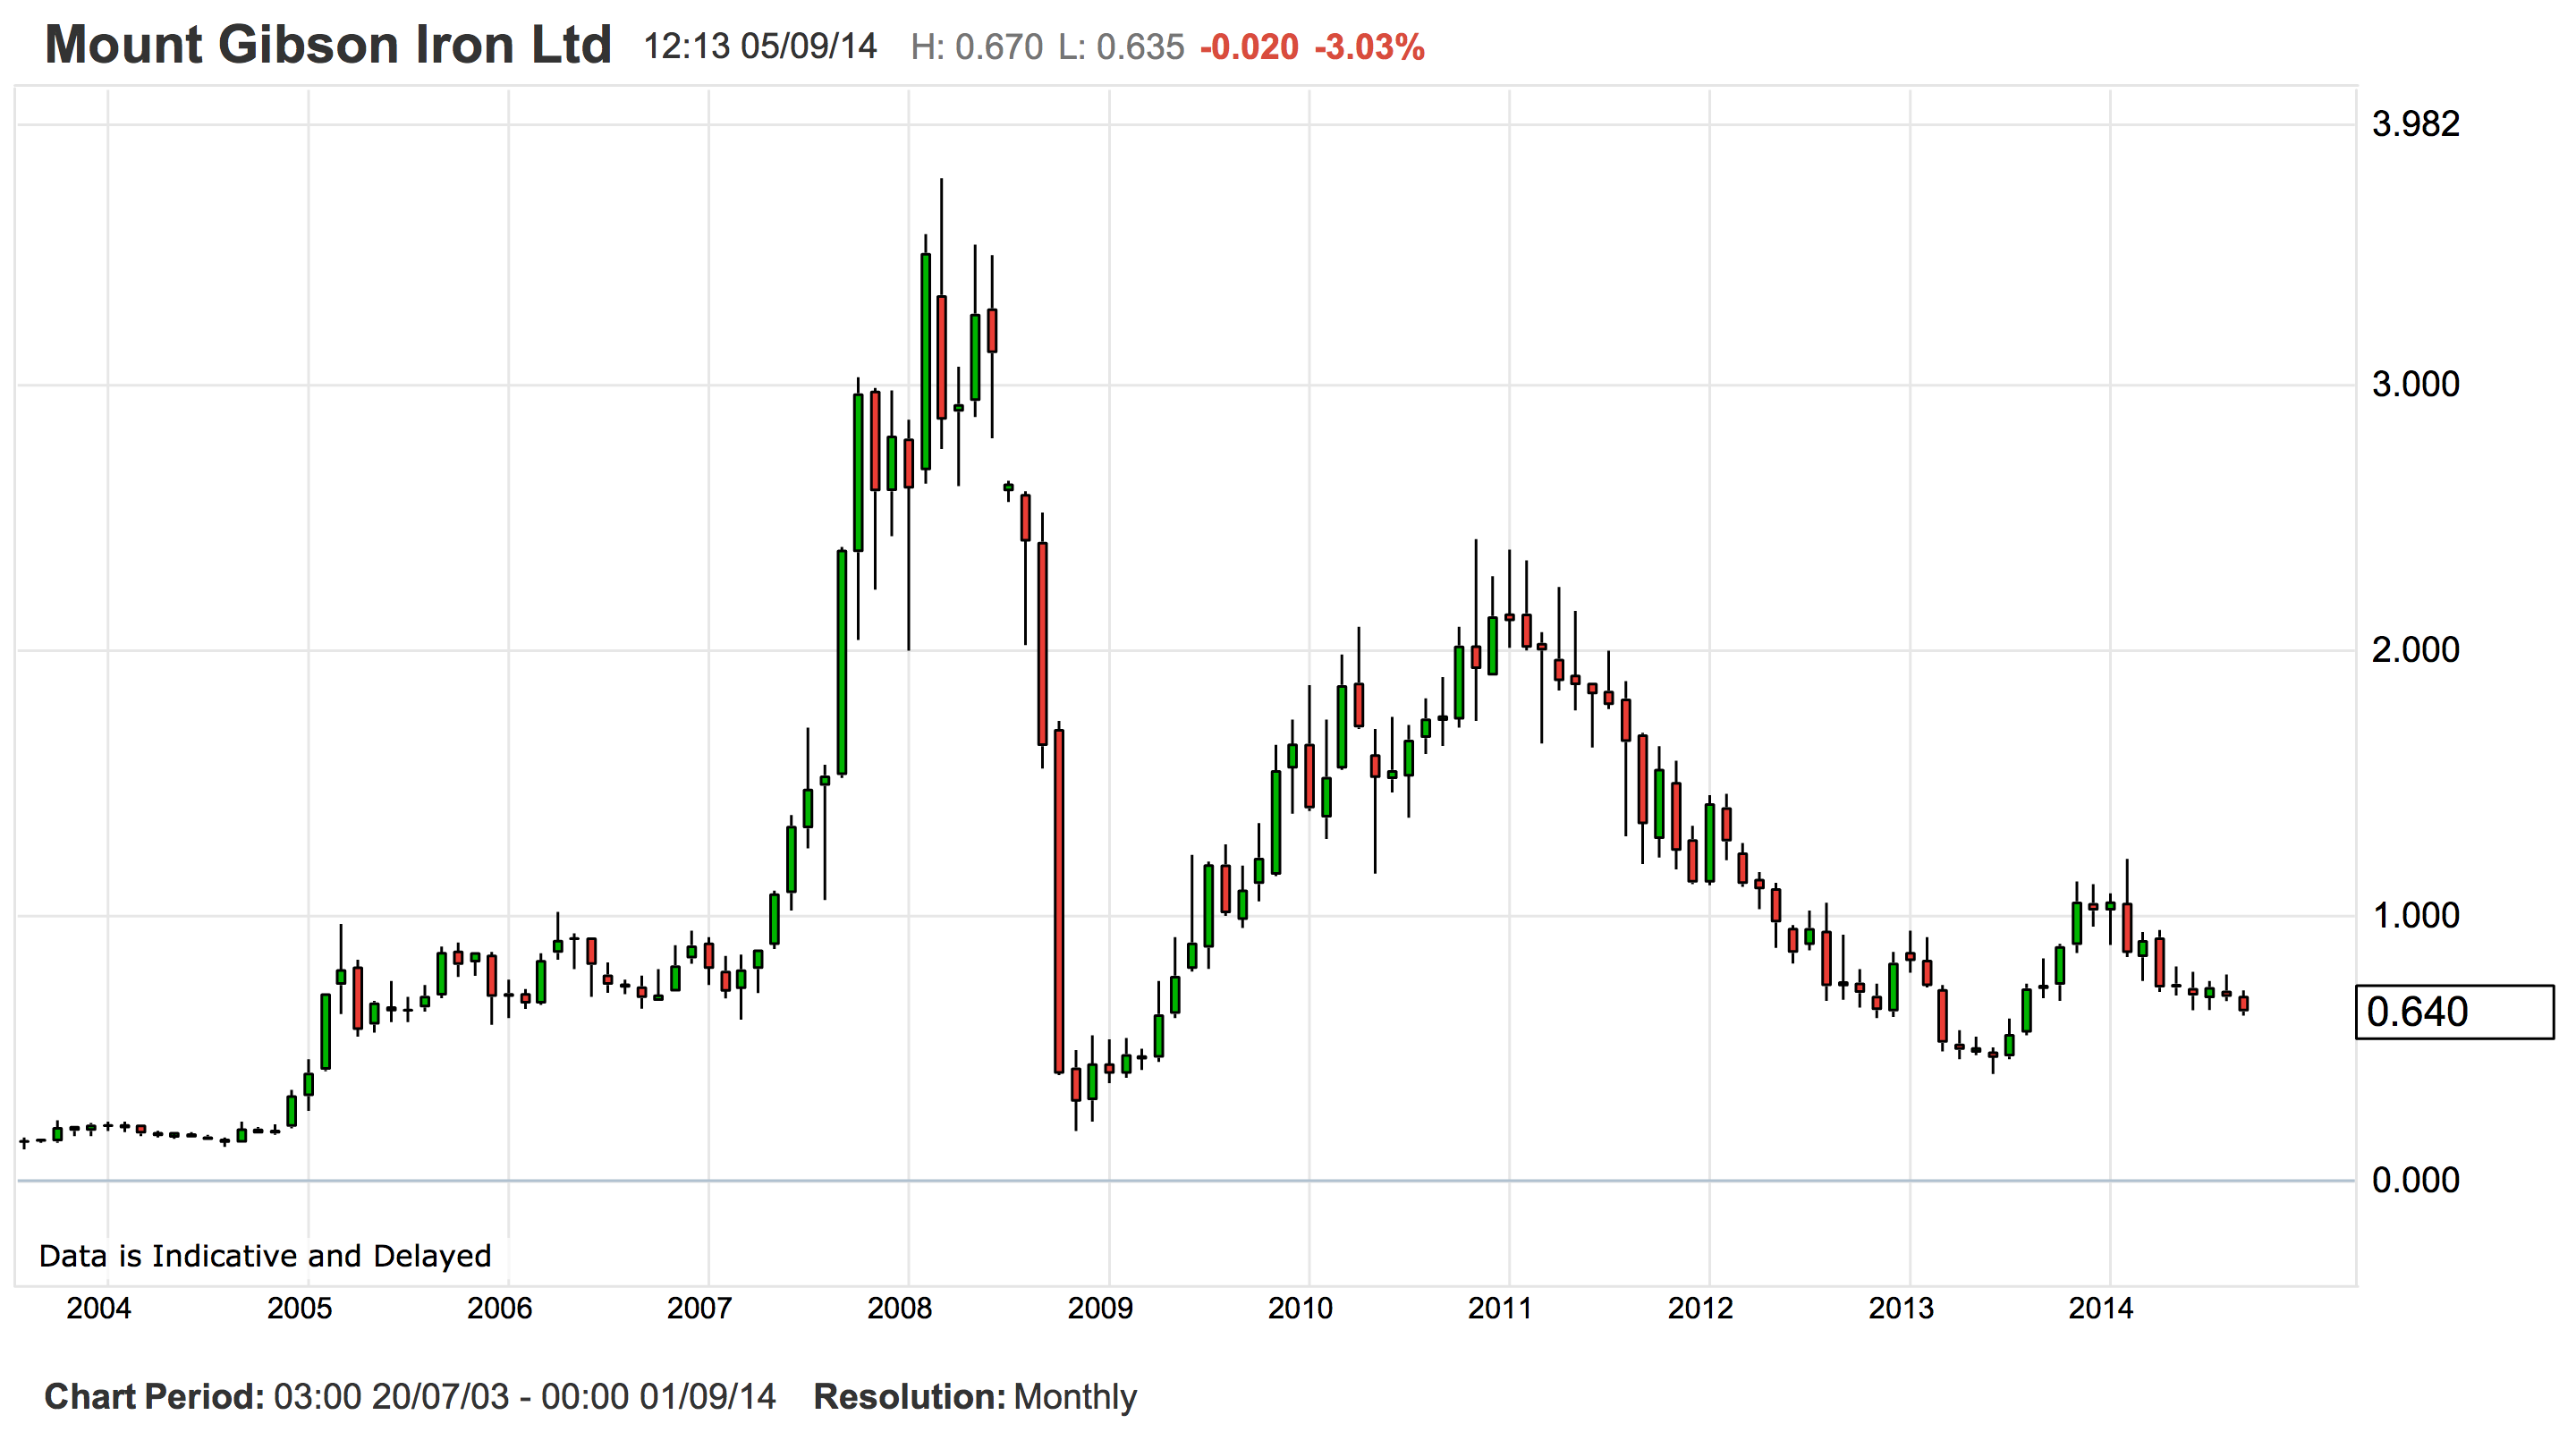
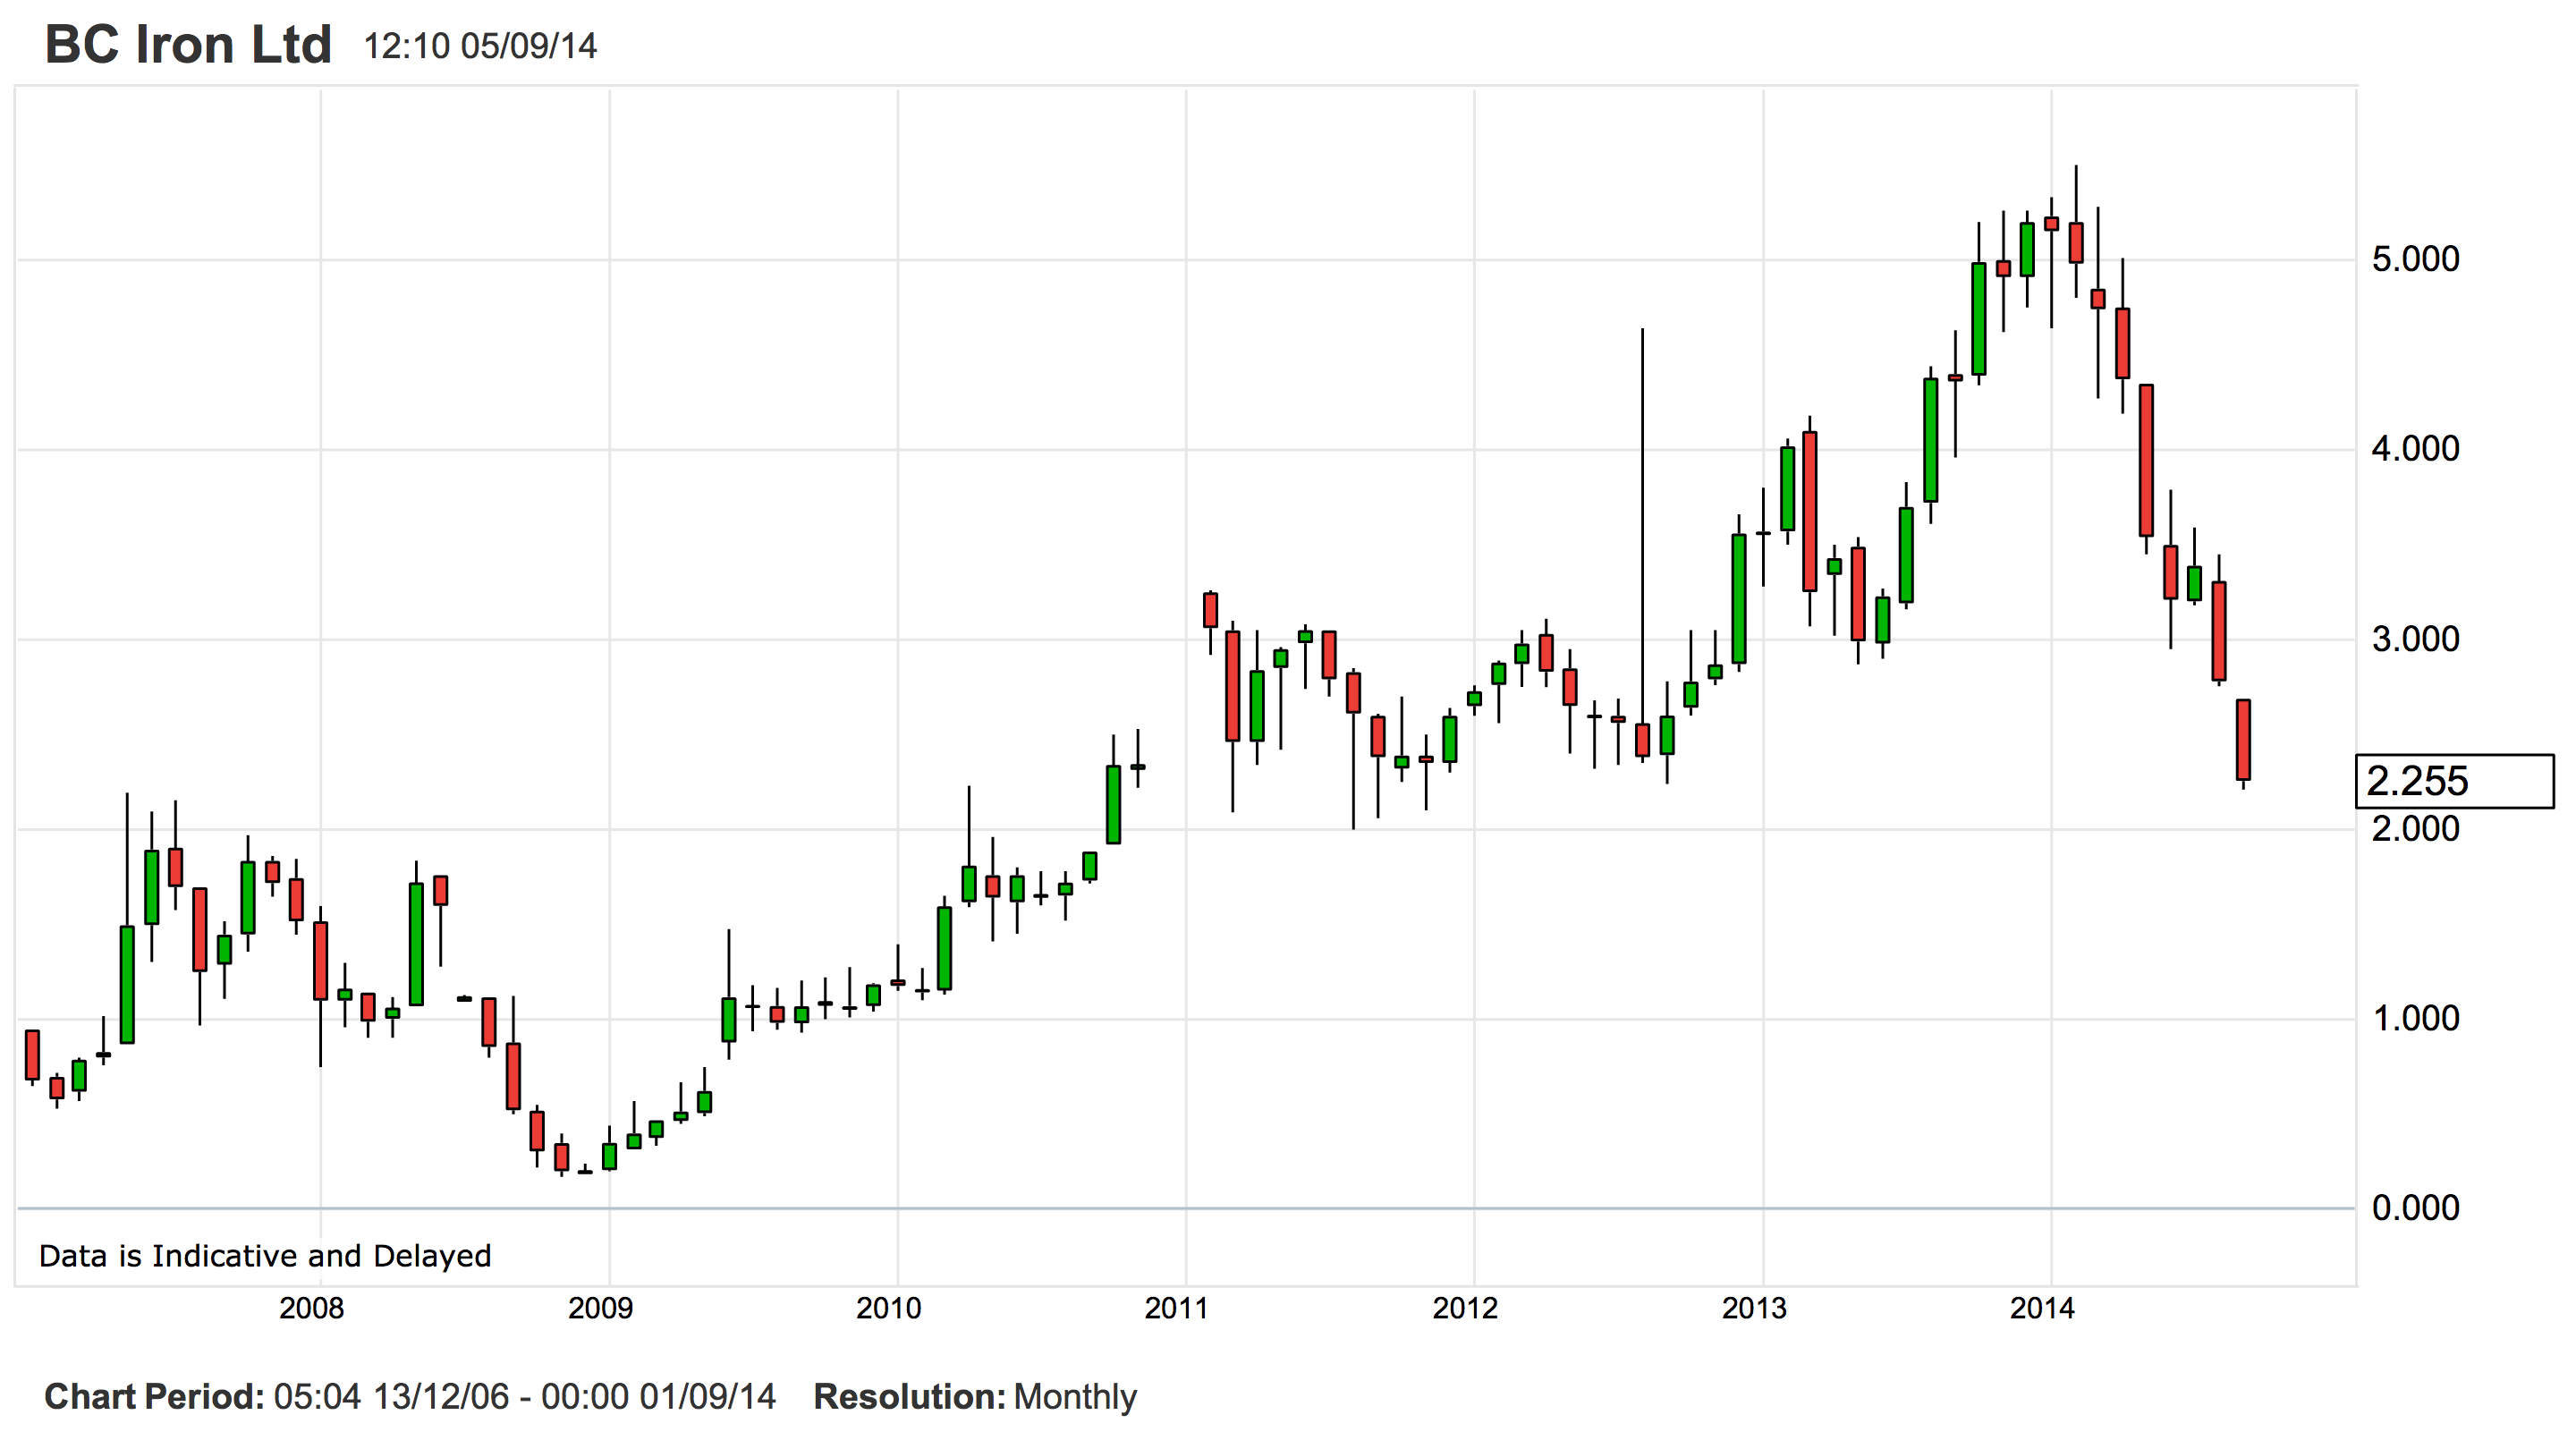
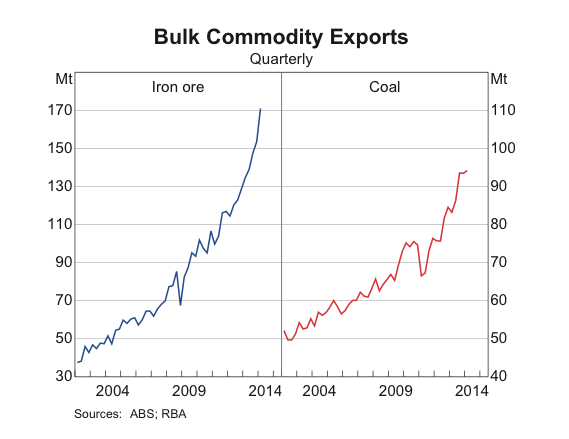
Recall that the overwhelming consensus in Australia is that the RBA will hike in its next cash rate move. The expectations underpinning this view are that the terms of trade will stabilise, with iron ore rebounding to roughly $100 a tonne in the near future, and that the interest rate-sensitive sectors of the economy go on expanding, until household consumption and rising asset prices start to tighten the labour market and pressure consumer prices, such that the RBA must lift interest rates.

This is not my view however, and I’ll wrap up this series in the next post with a summary of why that’s the case.

Part 5: The End of the Beginning

Straya T’day 8/9/2014

Chinese markets were closed today, so there was nothing concrete to spook or save the miners. A few iron ore plays caught a bid on the absence of bad news, with FMG up 2.3%. Generally not much movement and all we wait with bated breath for renewed signals. Plenty will be hoping a bottom is close for iron ore (aside from the shorts who’ve been piling in lately).

Roy Morgan released its Australian business confidence survey, which recorded a slight dip from last month. The survey has declined markedly from its post-election high last year, and is now below the average level of the past 4 years. Most worrying, overall sentiment is being underpinned by ebullience in the finance and real estate sectors, reflecting the strong housing market, while sectors such as retail, manufacturing and construction are all in the doldrums. Not a reassuring combination for anyone concerned with Australia’s post-mining boom structural adjustment. Tomorrow we’ll get the more closely-watched NAB business confidence survey, which has been showing decidedly more upbeat corporate sentiment of late (down only slightly from the post-election high).

Also released today was the ANZ job ads survey, which continues to show a modest improvement in labour market conditions, registering a 1.5% gain over the month. Chief Economist Warren Hogan noted that this appears at odds with the last employment data from the ABS, which recorded a sharp increase in the unemployment rate to 6.4% from 6% the month prior. The next employment report is out on Thursday and is expected to show an increase of 15k jobs and a drop in the unemployment rate to 6.3%. It’ll be very interesting to see how this release goes, given the signs of a gradual thawing in economic conditions, which must nevertheless be set against the looming menace of falling mining investment (to say nothing of the terms of trade beat-down).

The big story today however was Chinese trade data. The trade surplus came in at a record $49.8bn, and well above expectations for a $40bn surplus. Exports were up 9.4% for the year, following a 14.5% rise in July. Adding to the surplus was the decline in imports, which fell 2.4% after a 1.6% drop in July. While these figures are positive for China, a mrs pressing concern for this blog is the welfare of Australia; and despite appearances, what’s good for China is by no means good for Australia.

Buried within these data are some worrying portents for Australia. Coal imports slumped to 18.86m tonnes in August, the second month of decline and the lowest since September 2012. The promise of coal has long passed for Australia, but it remains noteworthy all the same that domestic prices in China are sitting at 6-year lows. More important than the drop in coal imports was that of iron ore, which fell 9% from the previous month.

The official party line throughout the ore rout this year has been that it’s a supply-side issue; soaring output is weighing on prices. The corollary being that while there may be lower prices these days, Australia has ramped up exports to compensate. This has it’s own set of problems for juniors, of course, whose business models don’t compute at lower prices, but for the most part it’s been an accurate appraisal of the market. However, as the esteemed David Llewellyn-Smith noted last week, “there are good reasons to be concerned that what started as a supply side issue for iron ore is very quickly swinging to a demand side problem for steel.”

Unfortunately, today’s trade data, in conjunction with recent steel output data showing a sharp drop off this month, suggest we are indeed beginning to see cracks in Chinese iron ore demand. No doubt there is a seasonal element to the fall in steel output and thus ore demand, but it has been an unusually large fall and, moreover, this simply reinforces the fact that without more fixed asset investment-driven stimulus, we just aren’t going to see a lift in steel demand, steel output, and iron ore demand that is anywhere near big enough to mop up the supply deluge.

Expect more iron ore price pain and a comparatively listless rebound when it comes.

The weak in iron

Gravity-doesnt-work-till-you-look-down-–-Roadrunner-Coyote

Another rough week for iron ore. Last week it breached the previous low for the year, this saw it take out the 2012 low of $86.70, and tumble straight down for a close of $83.60.

iron ore chart - Sept week1

It’s now fallen in 14 of the past 15 sessions. For the year it’s down 37.7% in USD-terms, and 40.7% in AUD, due to the ongoing resilience of the latter.

Sadly we can expect little respite from a falling AUD, thanks to the stubbornly lukewarm US labour market, the belated arrival of ECB easing, and a stampeding housing market preventing further rate cuts in Australia. There is much chatter these days about the starkly divergent paths of iron ore and the Aussie dollar. Intuitively this seems odd, after all iron ore is easily our largest single export, however it’s merely a loud reminder that the goods market holds little sway in the setting of nominal exchange rates; capital markets rule. As long as it’s relatively lucrative to borrow offshore and hold short-term AUD-denomiated assets, we aren’t likely to see a sustained fall in our currency.

So we’re left to pour libations and pray for a swift rebound in spot prices. There is a strong precedent for this. At the moment the market is traveling in much the same way as it did during the 2012 destock rout, which was savage but short-lived.

Screen Shot 2014-09-06 at 5.30.50 pm

Are we likely to see a similar whipsaw this time around? I suspect not, for the following reasons.

  • India knocked some 100m tonnes out of the seaborne market in late 2012 with its epic regulatory own-goal. That’s not there to disappear now.
  • Stimulus via fixed asset investment flowed freely in 2012, and, critically, the property sector commenced a strong upswing around the time iron ore bottomed (see chart below). It is far less likely that the government will embark on a similar path this time, for reasons sketched out here. Targeted fiscal support is likely, but a rebooting of the heady investment boom is not. If this plays out, steel demand will be flat or falling, with deleterious consequences for the suppliers of the iron ore deluge.
  • There is now an iron ore deluge.

CHina property prices

Inventories held by steel mills are low-ish at the moment, while stocks held at port most certainly are not. This appears to be a fundamental shift in the market, making an aggressive restock a la Q4 2012 less likely. We’ll see the price bottom out and rebound eventually, of course, but without a hasty U-turn in Chinese government policy (something that needs to be monitored closely), this decline in iron ore is structural. As I said last week; lower lows and lower highs until sufficient supply capacity drops out of the market to stabilize prices. If demand for iron ore, which has so far remained robust, starts to turn, heaven help us.

Oreful pun-ishment persists

Having busted through the 2012 low, iron ore is sliding just as expected, down to $84.30/dmt overnight, from an average price last year of $135. And there’s been no let up in early trade in China, with both iron ore and steel futures sinking again.

The first scalp claimed by the iron ore bust is probably that of Cliffs Natural Resources’ iron ore operations. Supposedly the Koolyanobbing mine in WA is being flogged off by Cliffs to eager suitors, but given that the mine’s miles from profitable at current prices, hard to see why anyone would bother in this environment.

While we’re on that subject, and since it’s such a lovely day outside, so why don’t we take a stroll through the menagerie of mini miners whose iron dreams are turning to red dust.

Grange resources chart
Breakeven: $98

Gindalbie chart
BE: $91

Atlas Iron chart
BE: $89

Arrium chart
ARI isn’t a pure-play iron ore miner, but iron ore easily provided the lion’s share of earnings in the first half of FY2014.
BE: $83

Mt Gibsonchart
BE: $80

centrex chart
Here representing SA. Not shipping yet and unless it’s very cheap to move their ore, I don’t imagine they will.

BCIron_chart
BCI has a joint venture with FMG, giving it access to the latter’s railways. They ramped profit 10-fold from a year earlier in the six months ending Dec 2013. Unfortunately that stellar performance is coming unstuck with this year’s collapse in ore prices, and the share price is succumbing to gravity accordingly.
BE: $79

FMGchart
FMG. Easily greatest success story to come out of the latest terms of trade bonanza. It’s break-even is in the mid-$70’s, and they’ll be furiously cutting costs now to remain above water. Although it’s ore isn’t all that much cheaper than some of the juniors, it has size on its side: this year it’s likely to account for over a fifth of Australia’s iron ore exports, a huge increase in volume over recent years. This means that FMG has an inbuilt defence mechanism of sorts; if the small, higher cost producers are all taken out of the market, it’s possible that declines in FMG’s output stabilise prices such that FMG can turn a profit on its remaining production.

That being said, absent a substantial depreciation of Australia dollar, it’s margins are being crushed. As the marginal producer in this market, the question is whether FMG survives as an independent company, not whether it’ll generate a decent return.

Breakeven prices are estimates from UBS

‘Whole industry reaches its Waterloo’

iron ore sept 3

Another unpleasant session in China for metals- and it got much worse after that piece went up, Dalian iron ore futures closed down 3.1%, second day of >3% decline. Note that the fellow calling this ‘Waterloo’ for the iron ore and steel industries is also eyeing a bounce back above $90. And why would that be? Stimulus! This is indeed what the steel and iron ore sectors need if we’re to see a meaningful and sustained recovery in prices in the near-term. Otherwise the structural oversupply in both sectors, increasingly exacerbated by the property slowdown in China, will continue to pressure producers until the deadweight is trimmed.

It is possible that the credit spigots are opened once more and the government falls back on fixed asset investment spending to stimulate the economy, but as I’ve discussed, signs overwhelmingly point towards this not happening. It’s likely we’ll see more targeted measures to prop up growth, especially if things turn nasty for property. But take a look at that most recent bounce in spot before the current rout; that was this year’s ‘mini-stimulus’ in action, and that’s about the extent of the support we’re likely to see for iron ore from the Chinese government.

Going to be interesting to see how spot holds up tonight; it’s quite likely this move takes it all the way to a 70-handle.

It’s safe to say the end is nigh for the iron ore minnows.