
Arise, Sir Vol!
Chart from John Kicklighter
We’ve finally been treated to some decent volatility in the past couple of months. Although it was initially concentrated in foreign exchange markets as the USD rediscovered its mojo, we’re now seeing sizeable moves across the asset spectrum.
We’ll start with FX.
It’s no secret that the USD has been on a rampage these last couple of months (I’m preparing a post on the history of the USD post-Bretton Woods in which I’ll try to contextualise the current outlook for the dollar and its ramifications).
Here’s how it’s looking on a long-term basis:
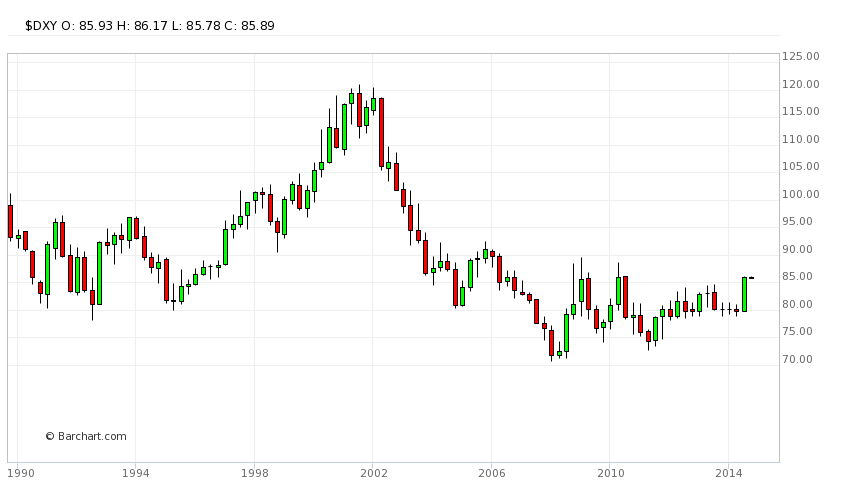
The proximate cause behind the timing of the rally was somewhat unclear, but the overarching case for a stronger USD has been sound for some time. The US is in the midst of the longest period of uninterrupted jobs growth in its history, at 55 weeks and counting, and the unemployment rate is down to 5.9% (here’s the latest jobs report). However, countering this is the fact that the decline in the unemployment rate has been largely accounted for by the decline in the participation rate, suggesting considerable slack remains in the labour market.
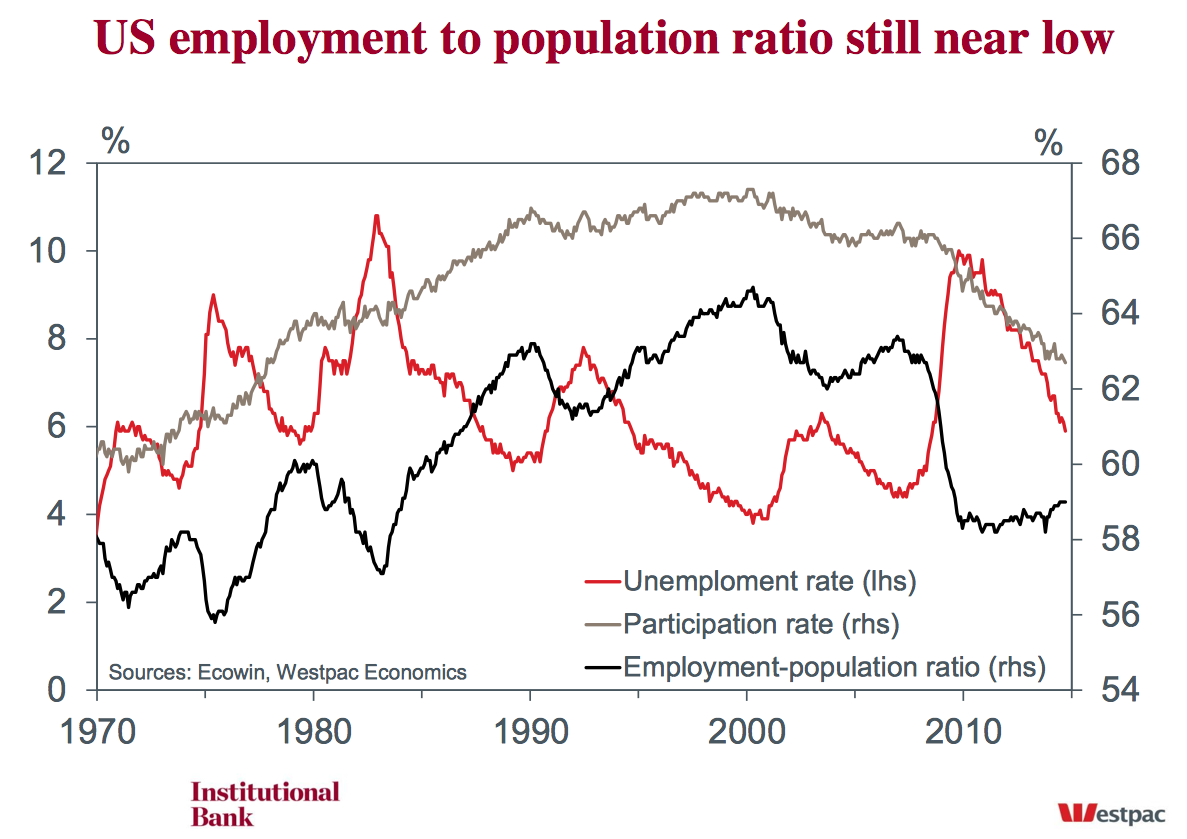
Some of this is certainly a consequence of retiring baby-boomers, although the timing and pace of the fall, coinciding as it did with the onset of recession, makes me a bit suspicious of this as the dominant explanation. Nevertheless, the market excitedly seized on a paper from the Fed last month arguing that the fall in labour force participation was largely structural; the implication being that labour markets would tighten without a big rise in the employment-to-population ratio, and the Fed would be compelled to adjust monetary policy accordingly.
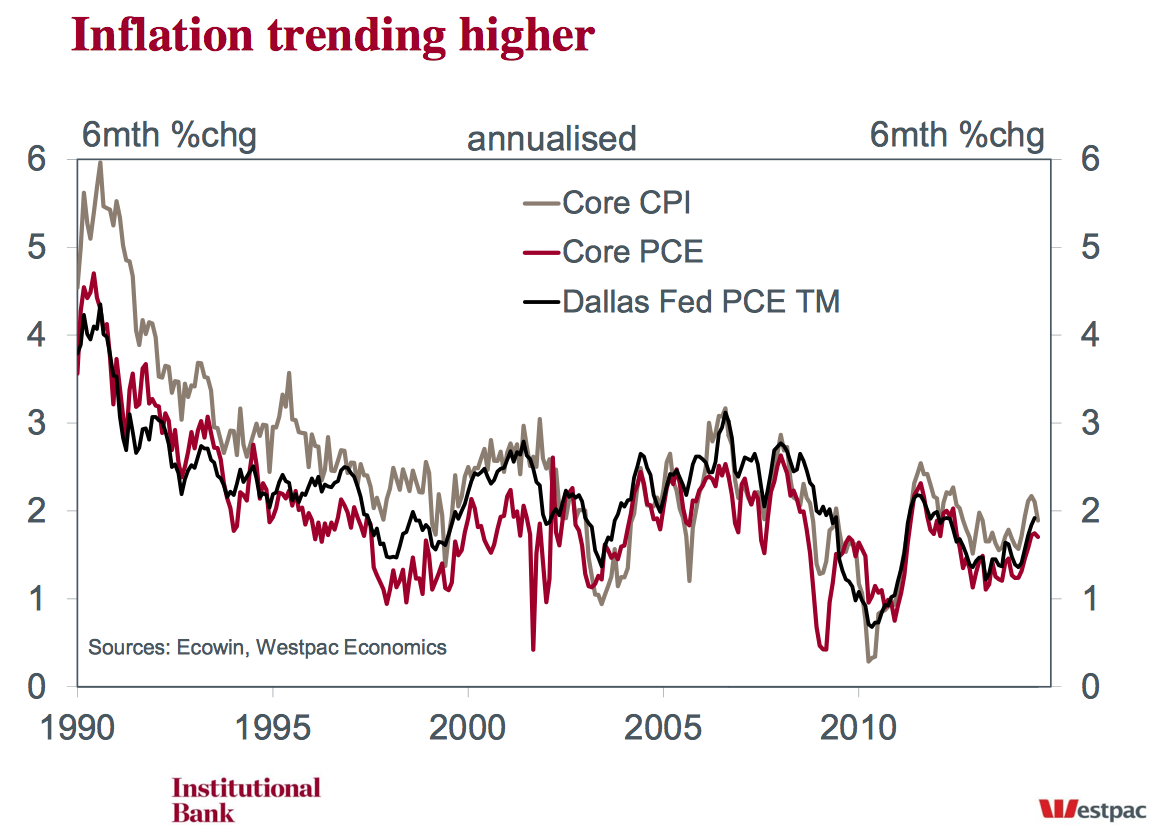
If this is the case, it’s not yet showing up in wage pressures. Inflation measures have been creeping up lately, but not in any concerning fashion. In any case, the strong dollar will knock these pressures on the head, should it continue to run as I expect it to.
So although the US is improving, it’s hardly charging. The case for a stronger dollar has therefore centred on the miserable state of its peers. Germany is sinking into recession, adding to the persistent weakness plaguing the Eurozone, Japan is looking sickly after hiking the sales tax earlier this year, and China is doing its best to rebalance without detonating its debt time-bomb. Combined with the end of QE this month, the USD is looking the least ugly out of a pretty ordinary bunch.
Black gold
Many commodities have struggled under the weight of a resurgent USD, chief among them being the anti-dollar: gold.
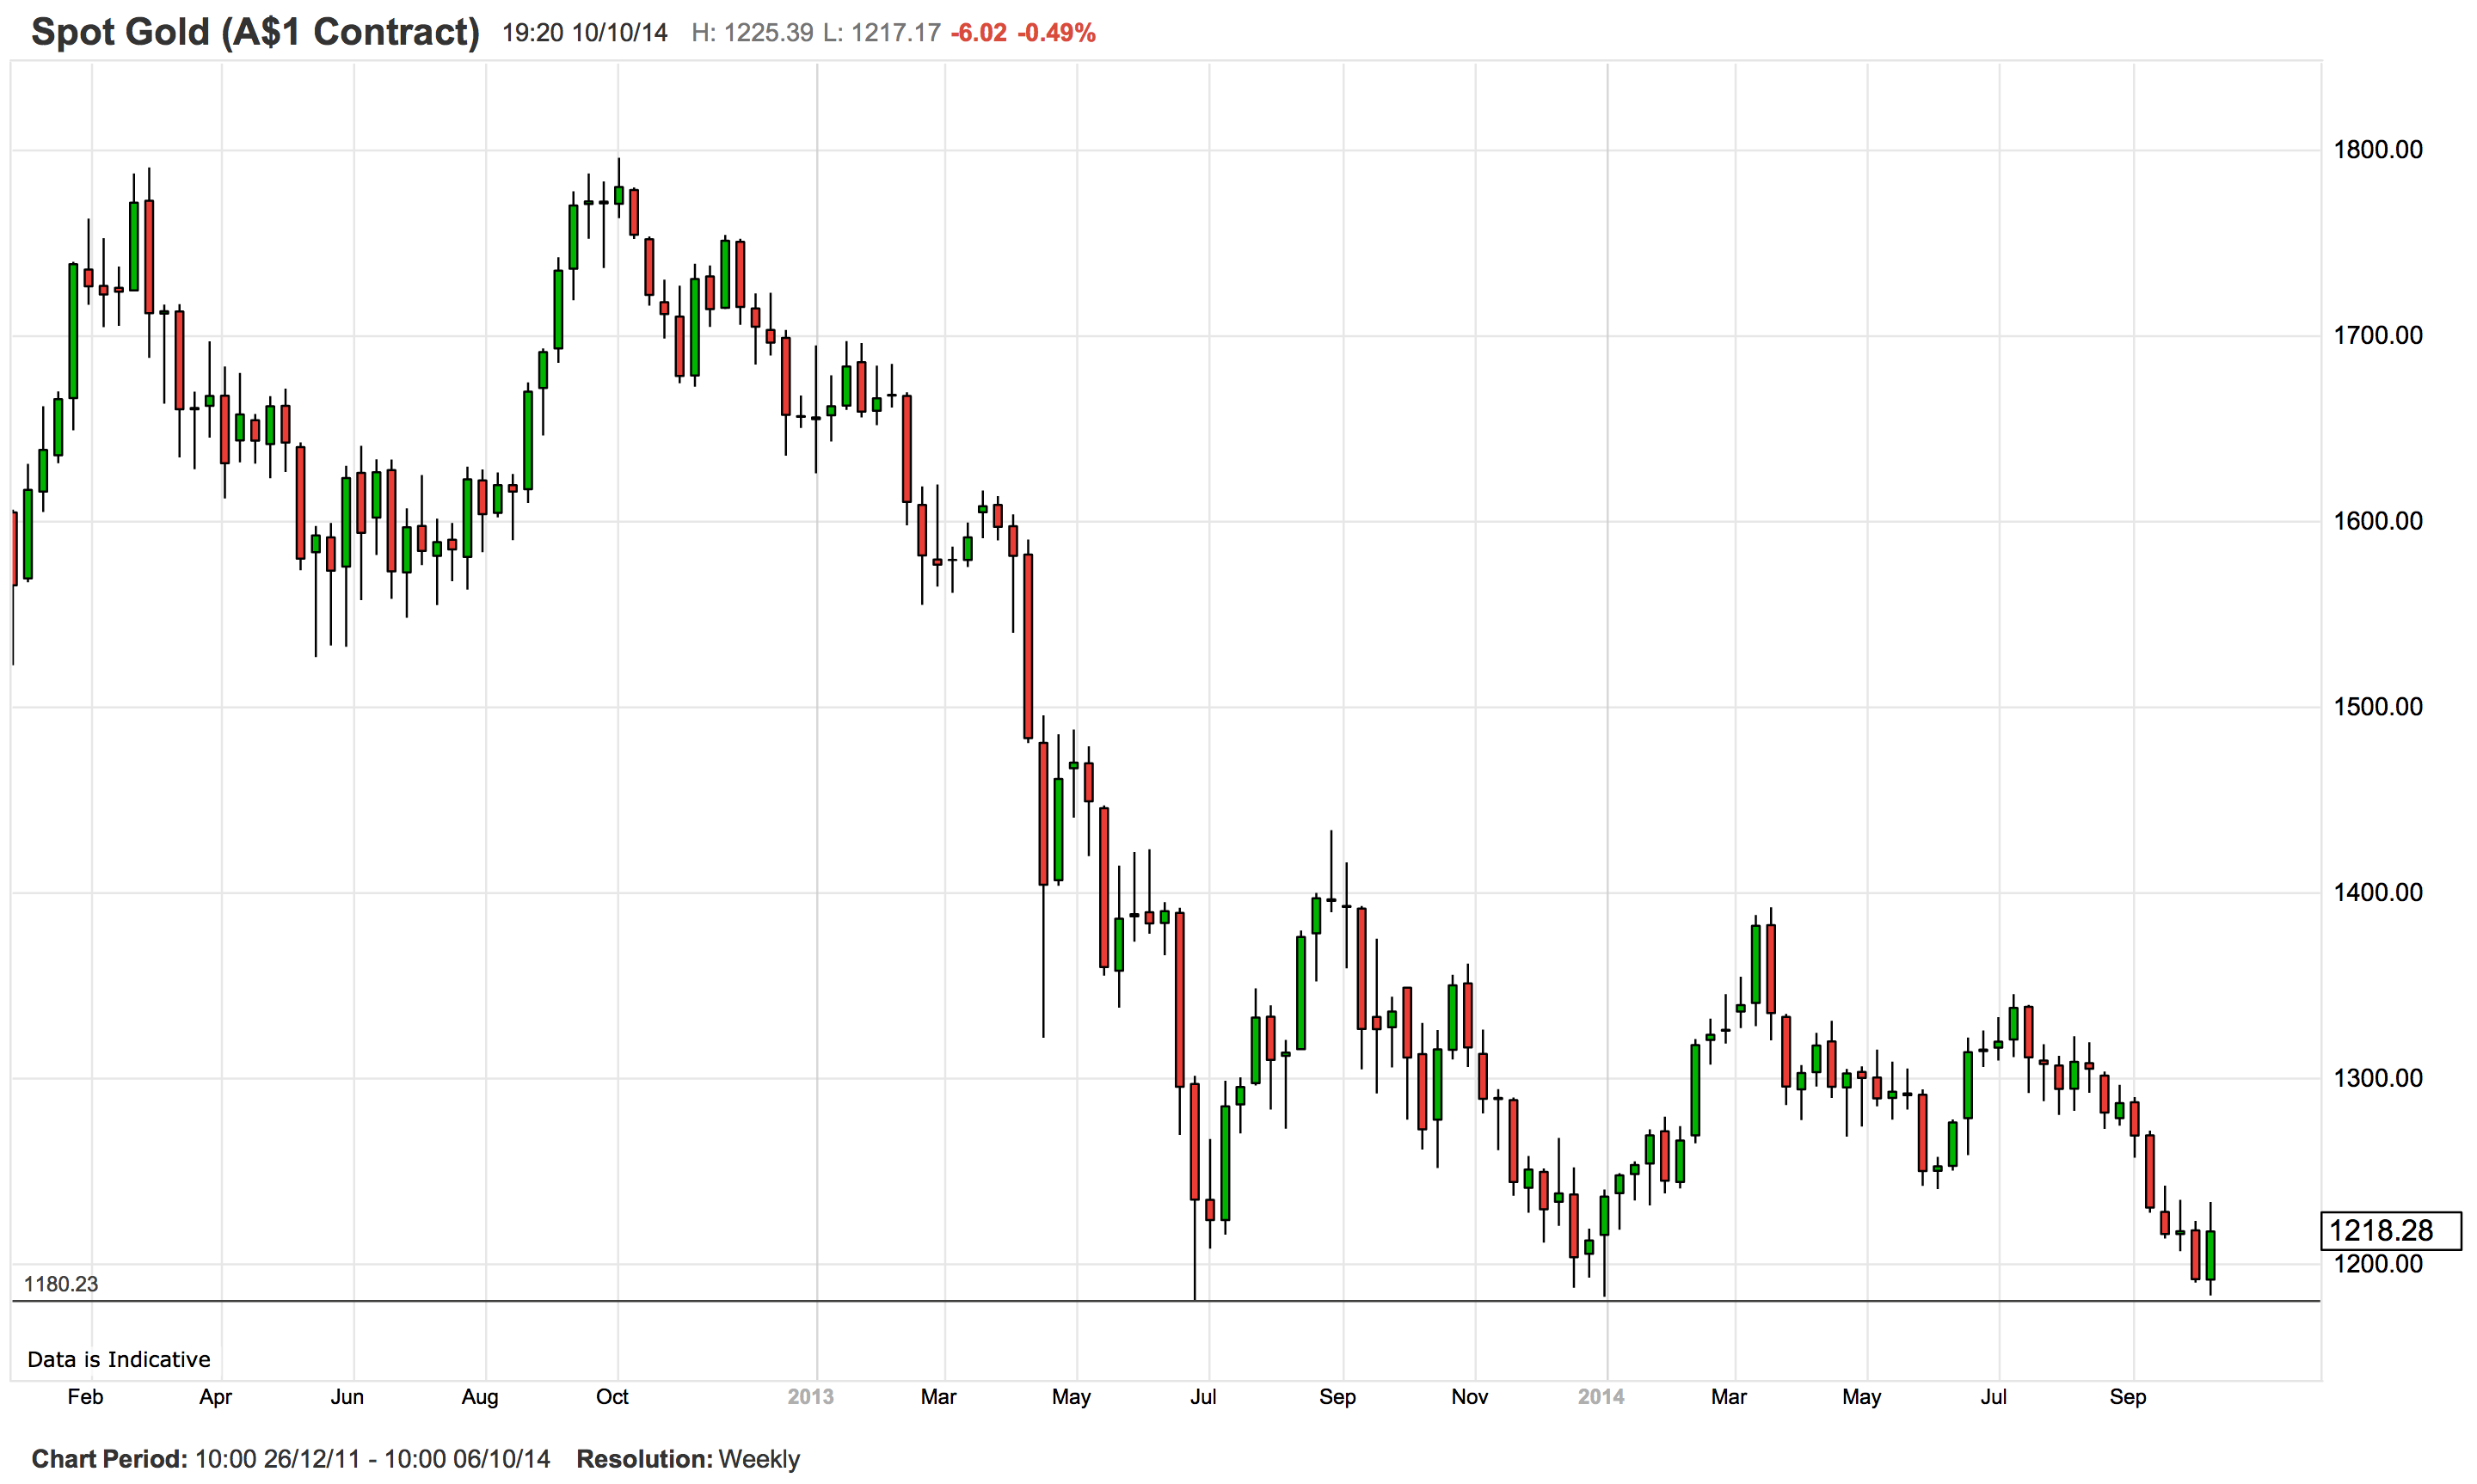
Gold managed to bounce off its double bottom at $1180, forming a triple bottom now. This is garden variety technical pattern which often would be interpreted as a bullish signal, but that’s certainly not how I’m looking at this market.
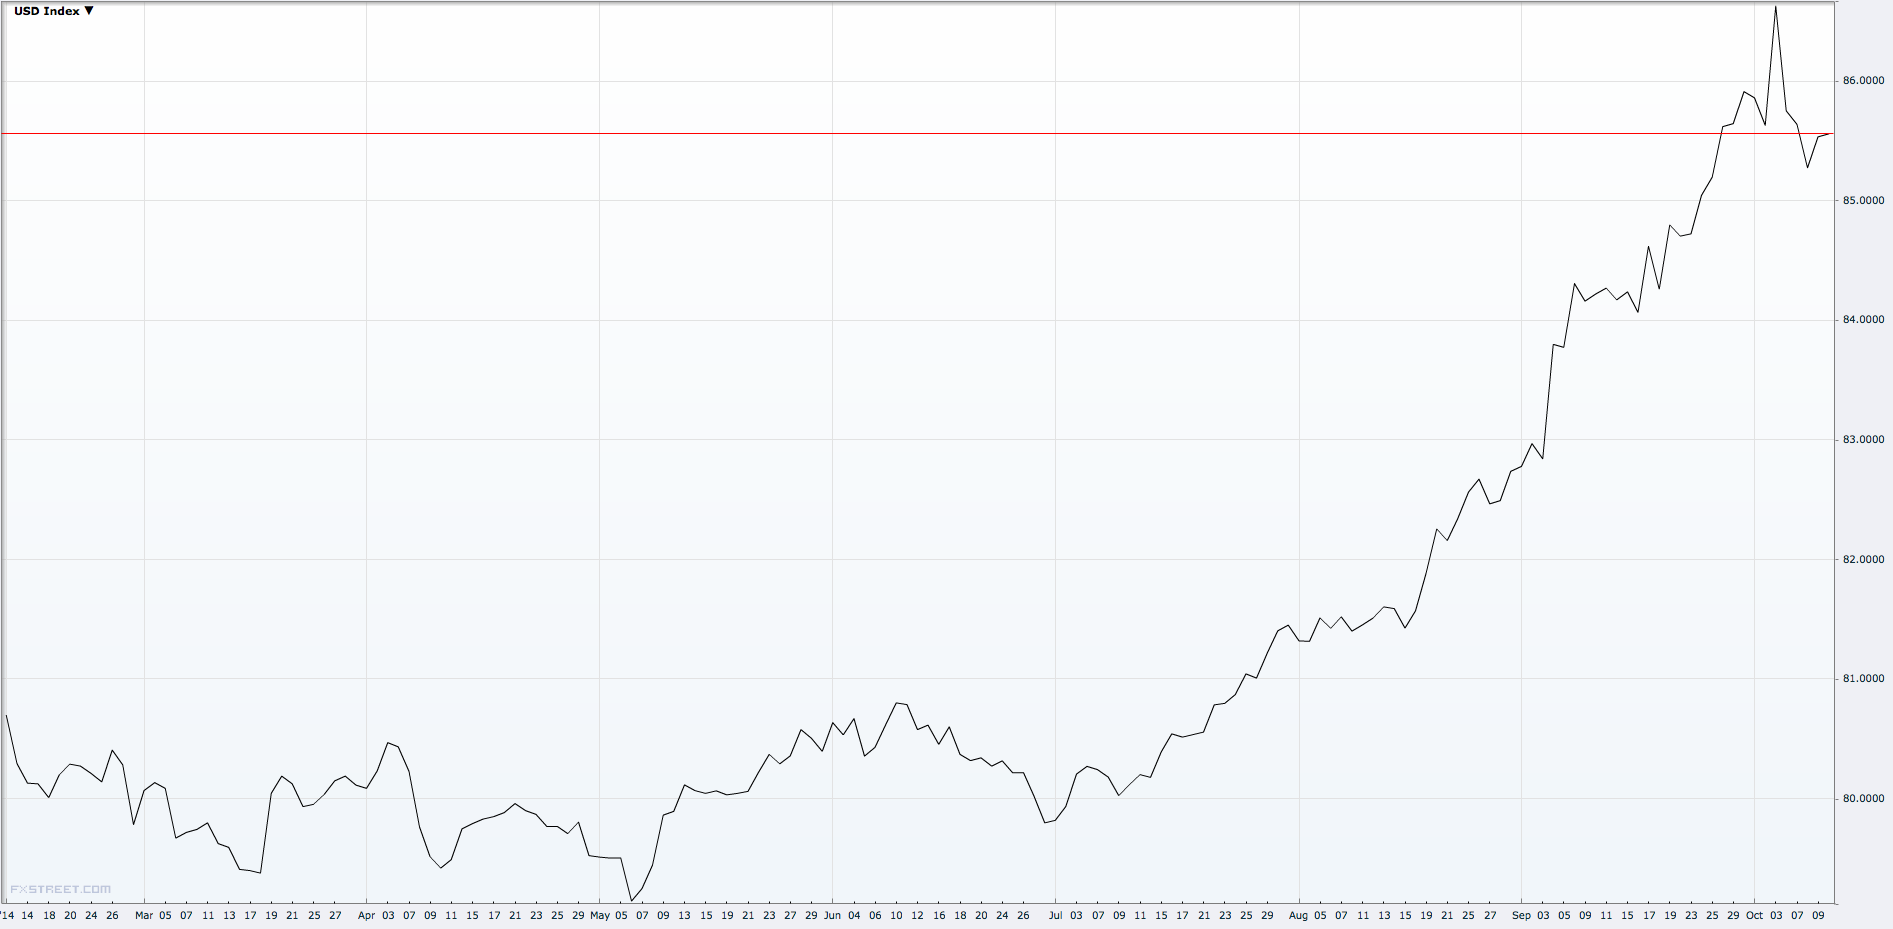
As you can see on the short-term USD index chart, the greenback gave up some of its gains this week as the Fed minutes showed some members were concerned about the negative impacts of weak external demand and the high dollar on the US economy. In truth the dollar really just needed a bit of breather after the run it’d had. This consolidation gave gold another kick up. It may be that gold finds a little further to rally, especially if equities continue to sell off, but in time expect critical support at $1180 to give way and gold to go much lower.
The entire ‘buy gold because the Fed is printing money, stoking inflation and trashing the dollar’ theme has been unraveling since early last year, as it became clear that QE would end with no inflation in sight and the dollar outperforming, rather than collapsing. Depending on the severity of the equities downturn and the followthrough on the dollar, I’d be looking for gold to break $1180 by the end of the year, heading below $1000 in fairly short order.
Oil has also been suffering under the weight of the strong dollar, although more importantly its fundamentals have been growing increasingly bearish. The US is awash with oil in a way it hasn’t been for decades.
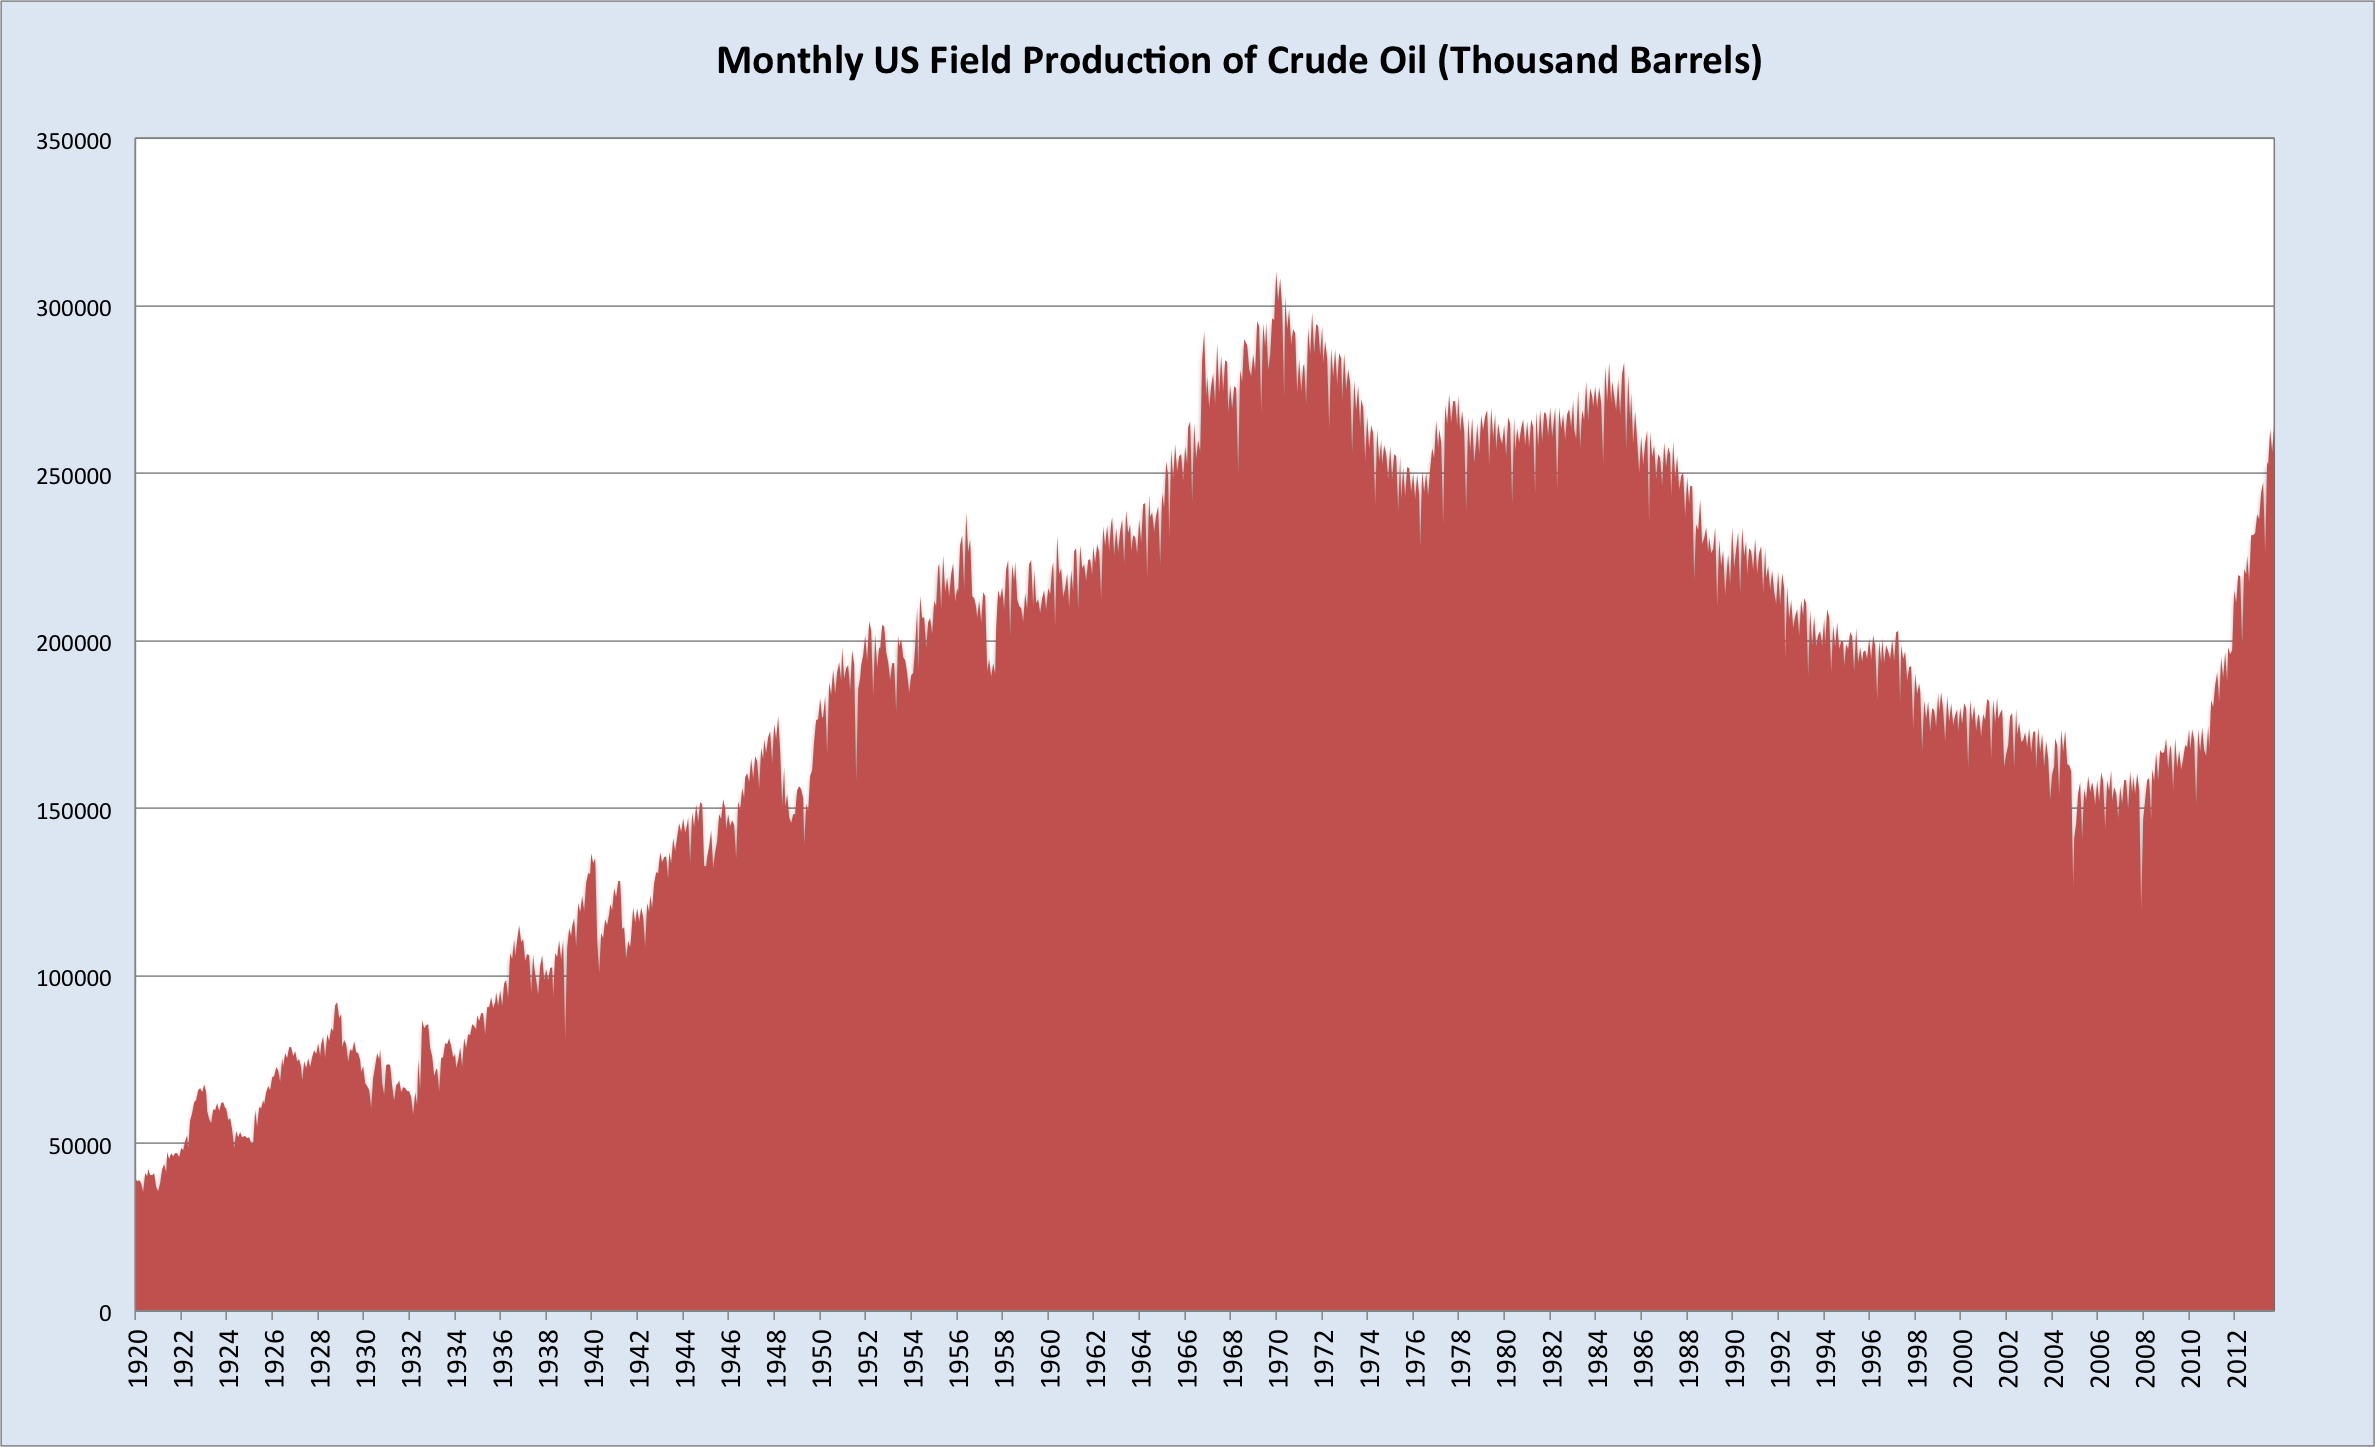
This is the result of the shale and tight oil boom, which allowed previously inaccessible gas and then oil resources to be exploited. There are plenty of reasons to believe that this will be a relatively short lived spike in US production, but for now all you can do is recline and admire America’s capacity to revitalise itself at the most critical of moments.
Adding to the supply mix has been the return of Libyan crude to world markets, the stability of Iraqi output despite its dire geopolitical environment, and the disinclination among OPEC producers to cut output, as many assumed they would. This could well be a reflection of political tensions in the Middle East. The Gulf Arab states are embroiled in a vicious proxy war at present against the Shi’ite bloc led by Iran. Iran is seriously suffering with oil at current prices, giving the Arab states an incentive to maintain supplies and turn the screws on Iran. That’s just speculation of course; we’ll need to wait until the November meeting for a better gauge on OPEC’s response to the price slide.
Against the supply backdrop we have anaemic ‘growth’ in Japan and Europe, and signs of a meaningful slowdown in China, giving us a perfect storm battering oil prices.
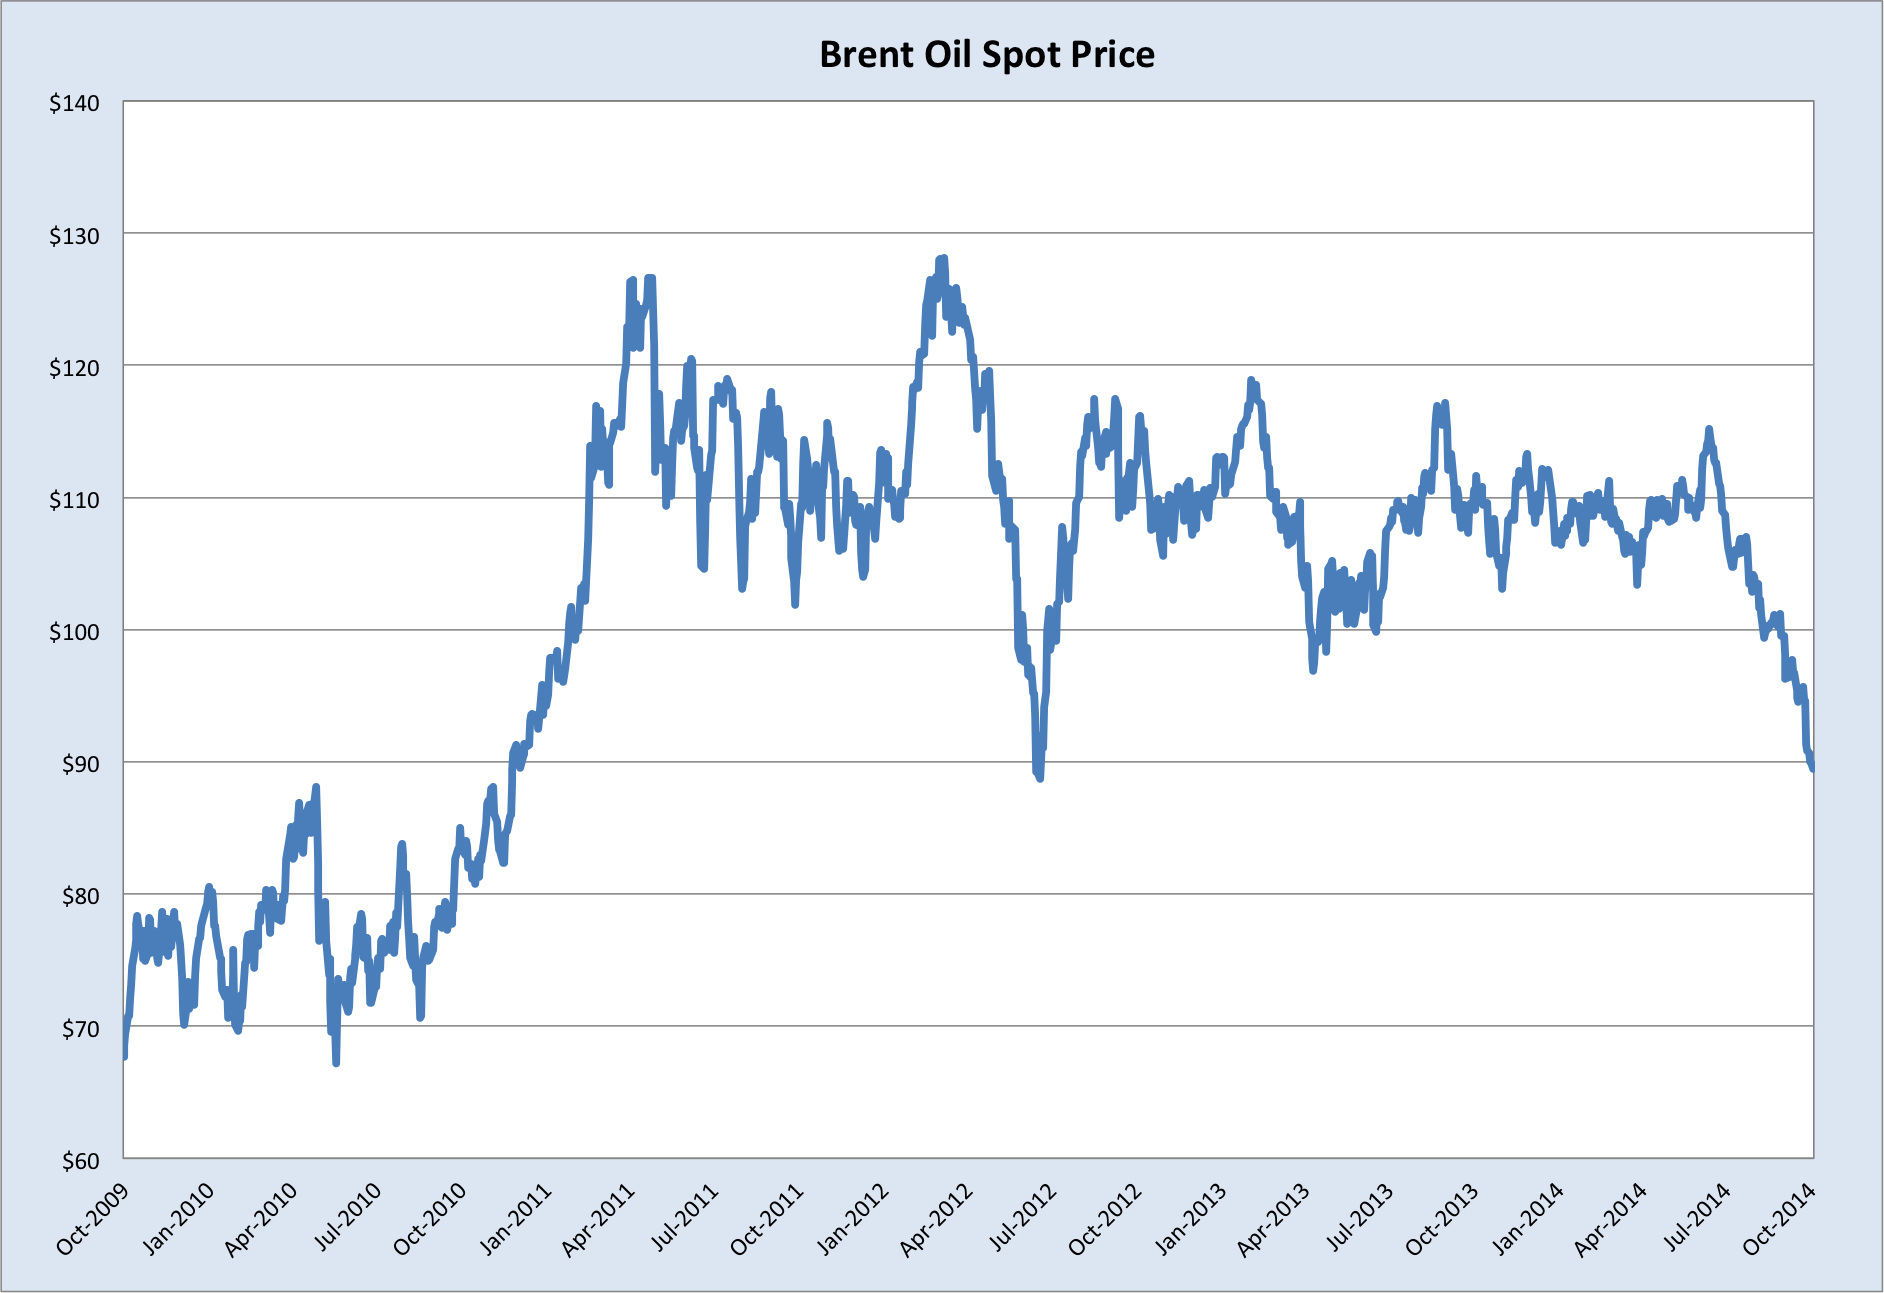
Energy stocks are being crushed accordingly, with the S&P energy sector index yesterday posting its biggest one-day fall since April last year.
The recent surge in US oil production has depended on high oil prices and continuous investment due to the rapid depletion rate of shale wells. This ought to provide a floor of sorts for prices. However, as we saw with natural gas a few year back, producers kept the gas flowing long after they were doing so unprofitably, simply because the cash flow was preferable to shutting down production altogether. This leaves scope for an overshoot on the downside. There’s also the aforementioned situation with OPEC to consider. On the demand side, I see little prospect of a substantial pick-up outside the US. Together with the stronger dollar, this adds up to a high likelihood of more pain ahead for oil.
Equities on edge
After flirting with the lower bound of its long-term channel earlier this year, the Salt&Peppa has decisively broken through support.
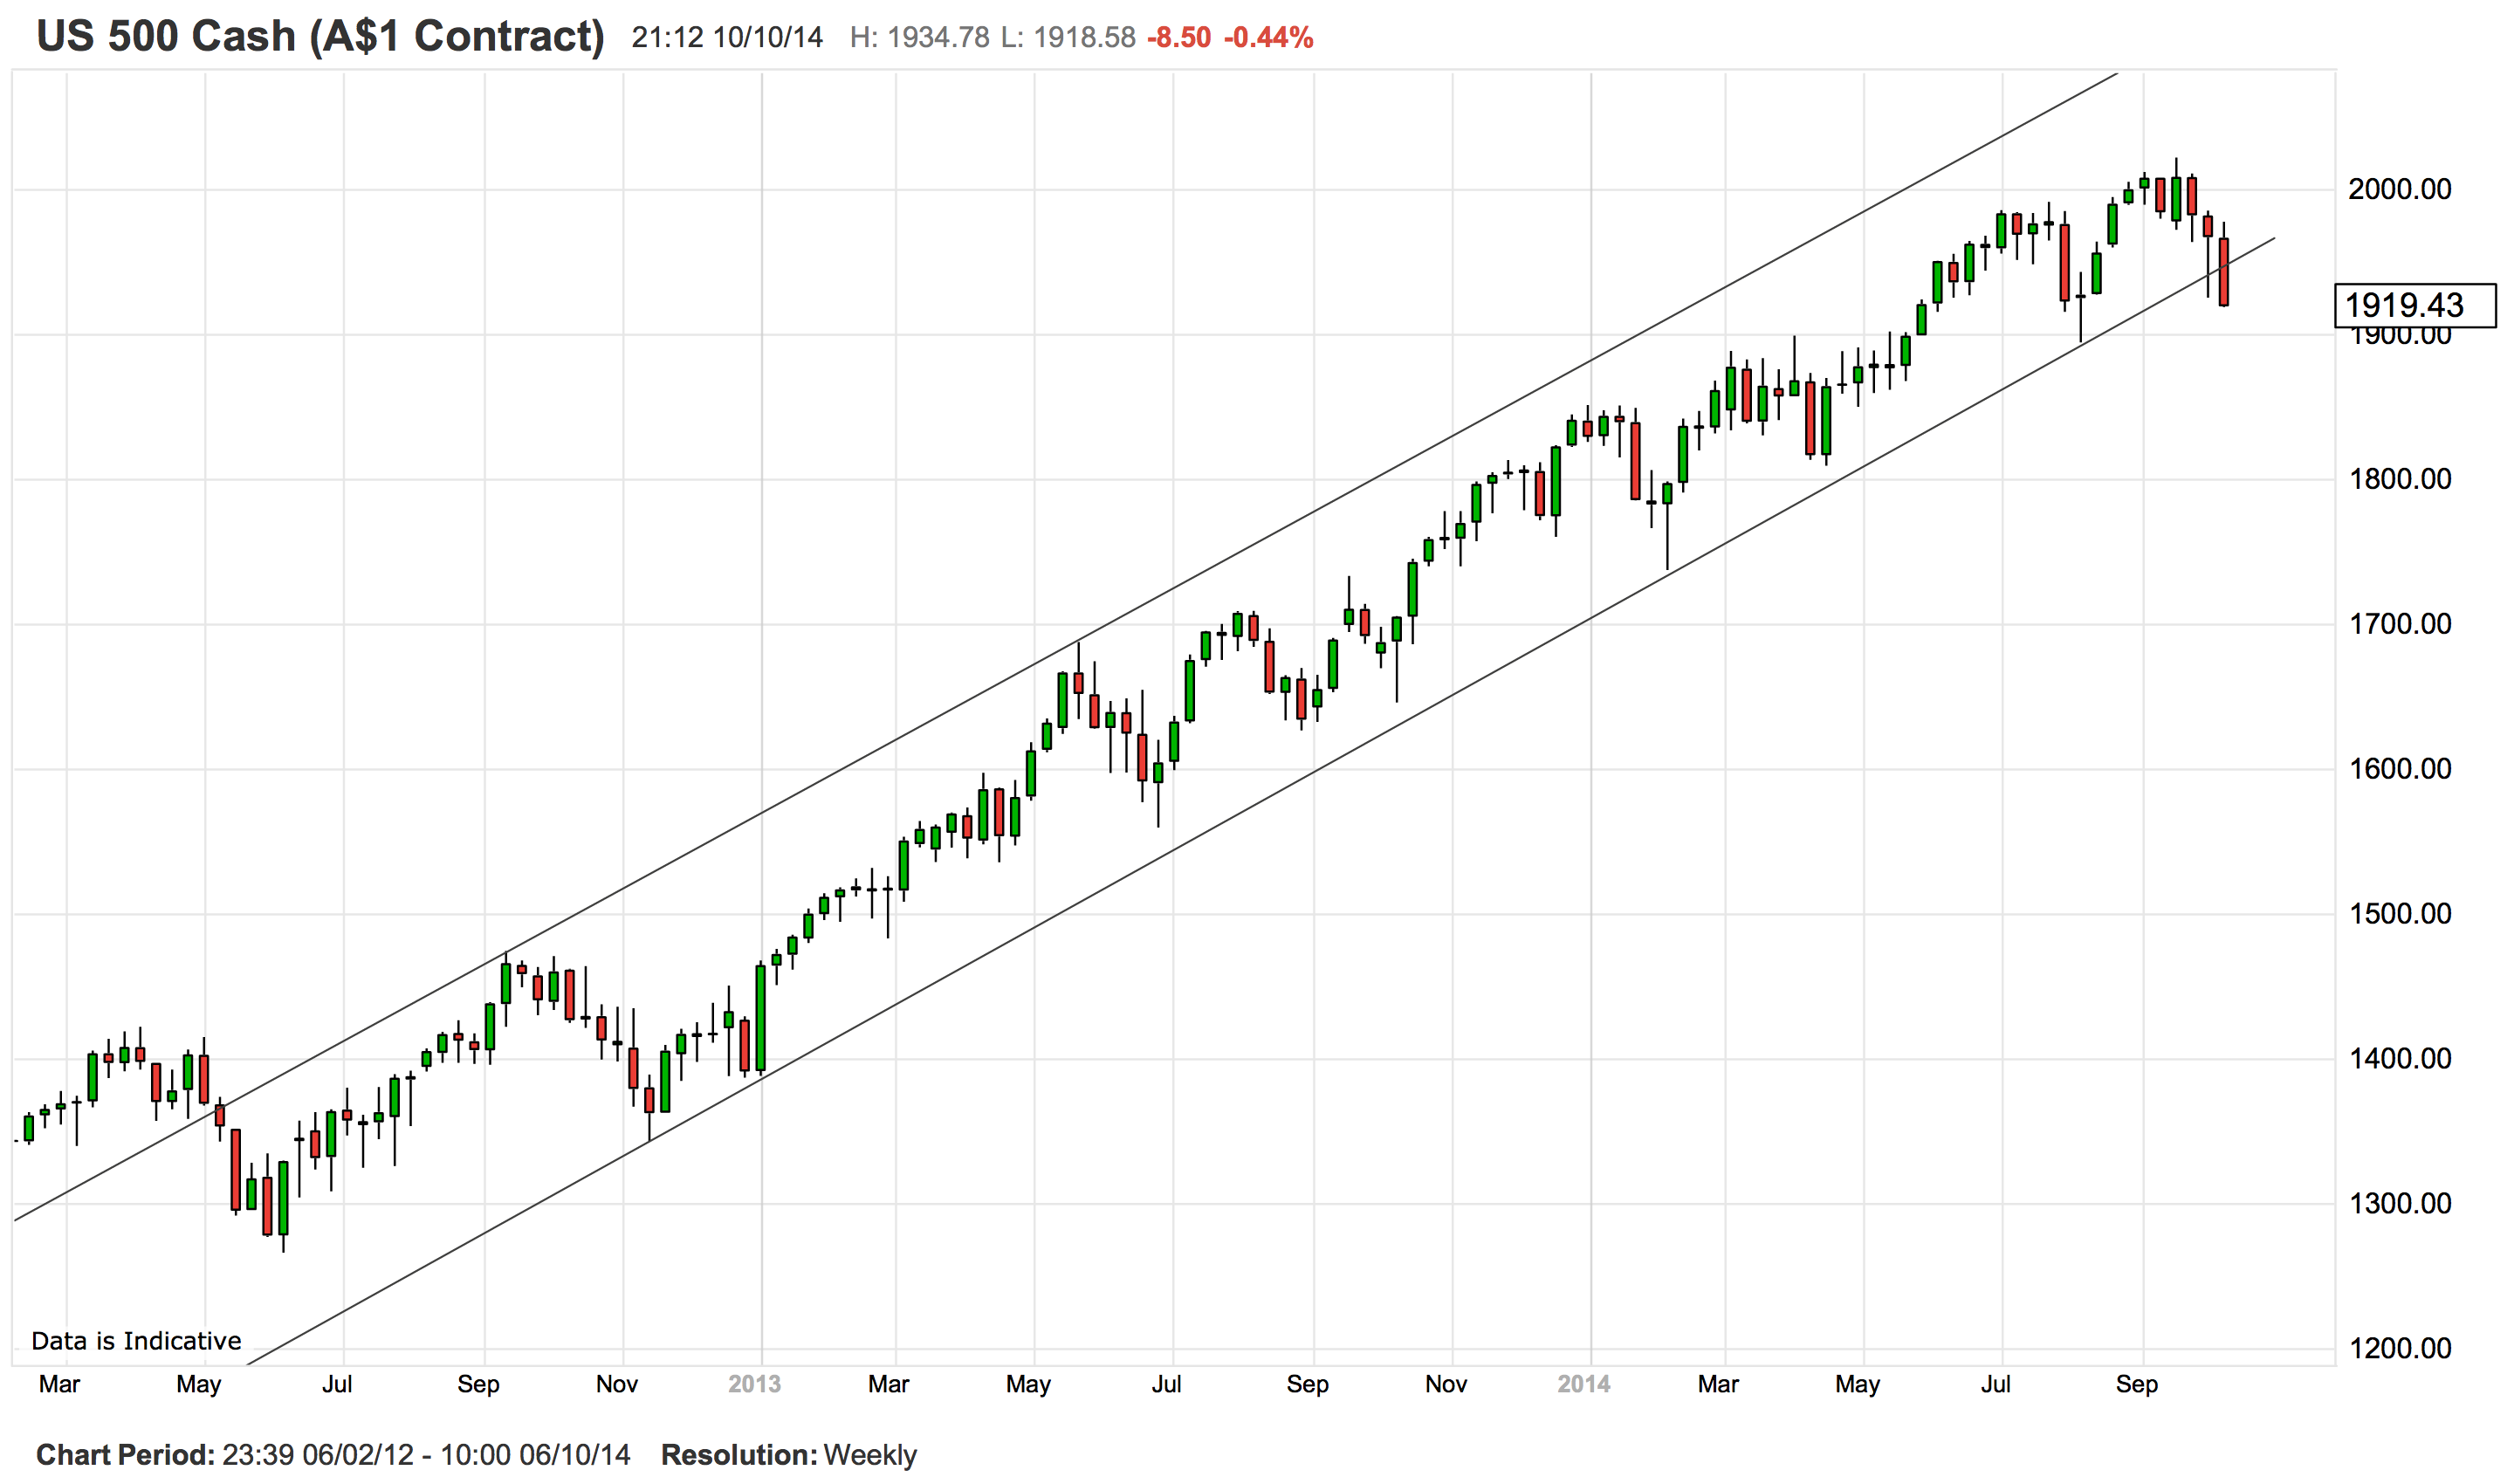
It’s now around 5% off the September high, and looking like it has room for a proper correction (>10% fall).
If we take a closer look at recent price action, we get a better impression of how poorly the market has traveled this week.
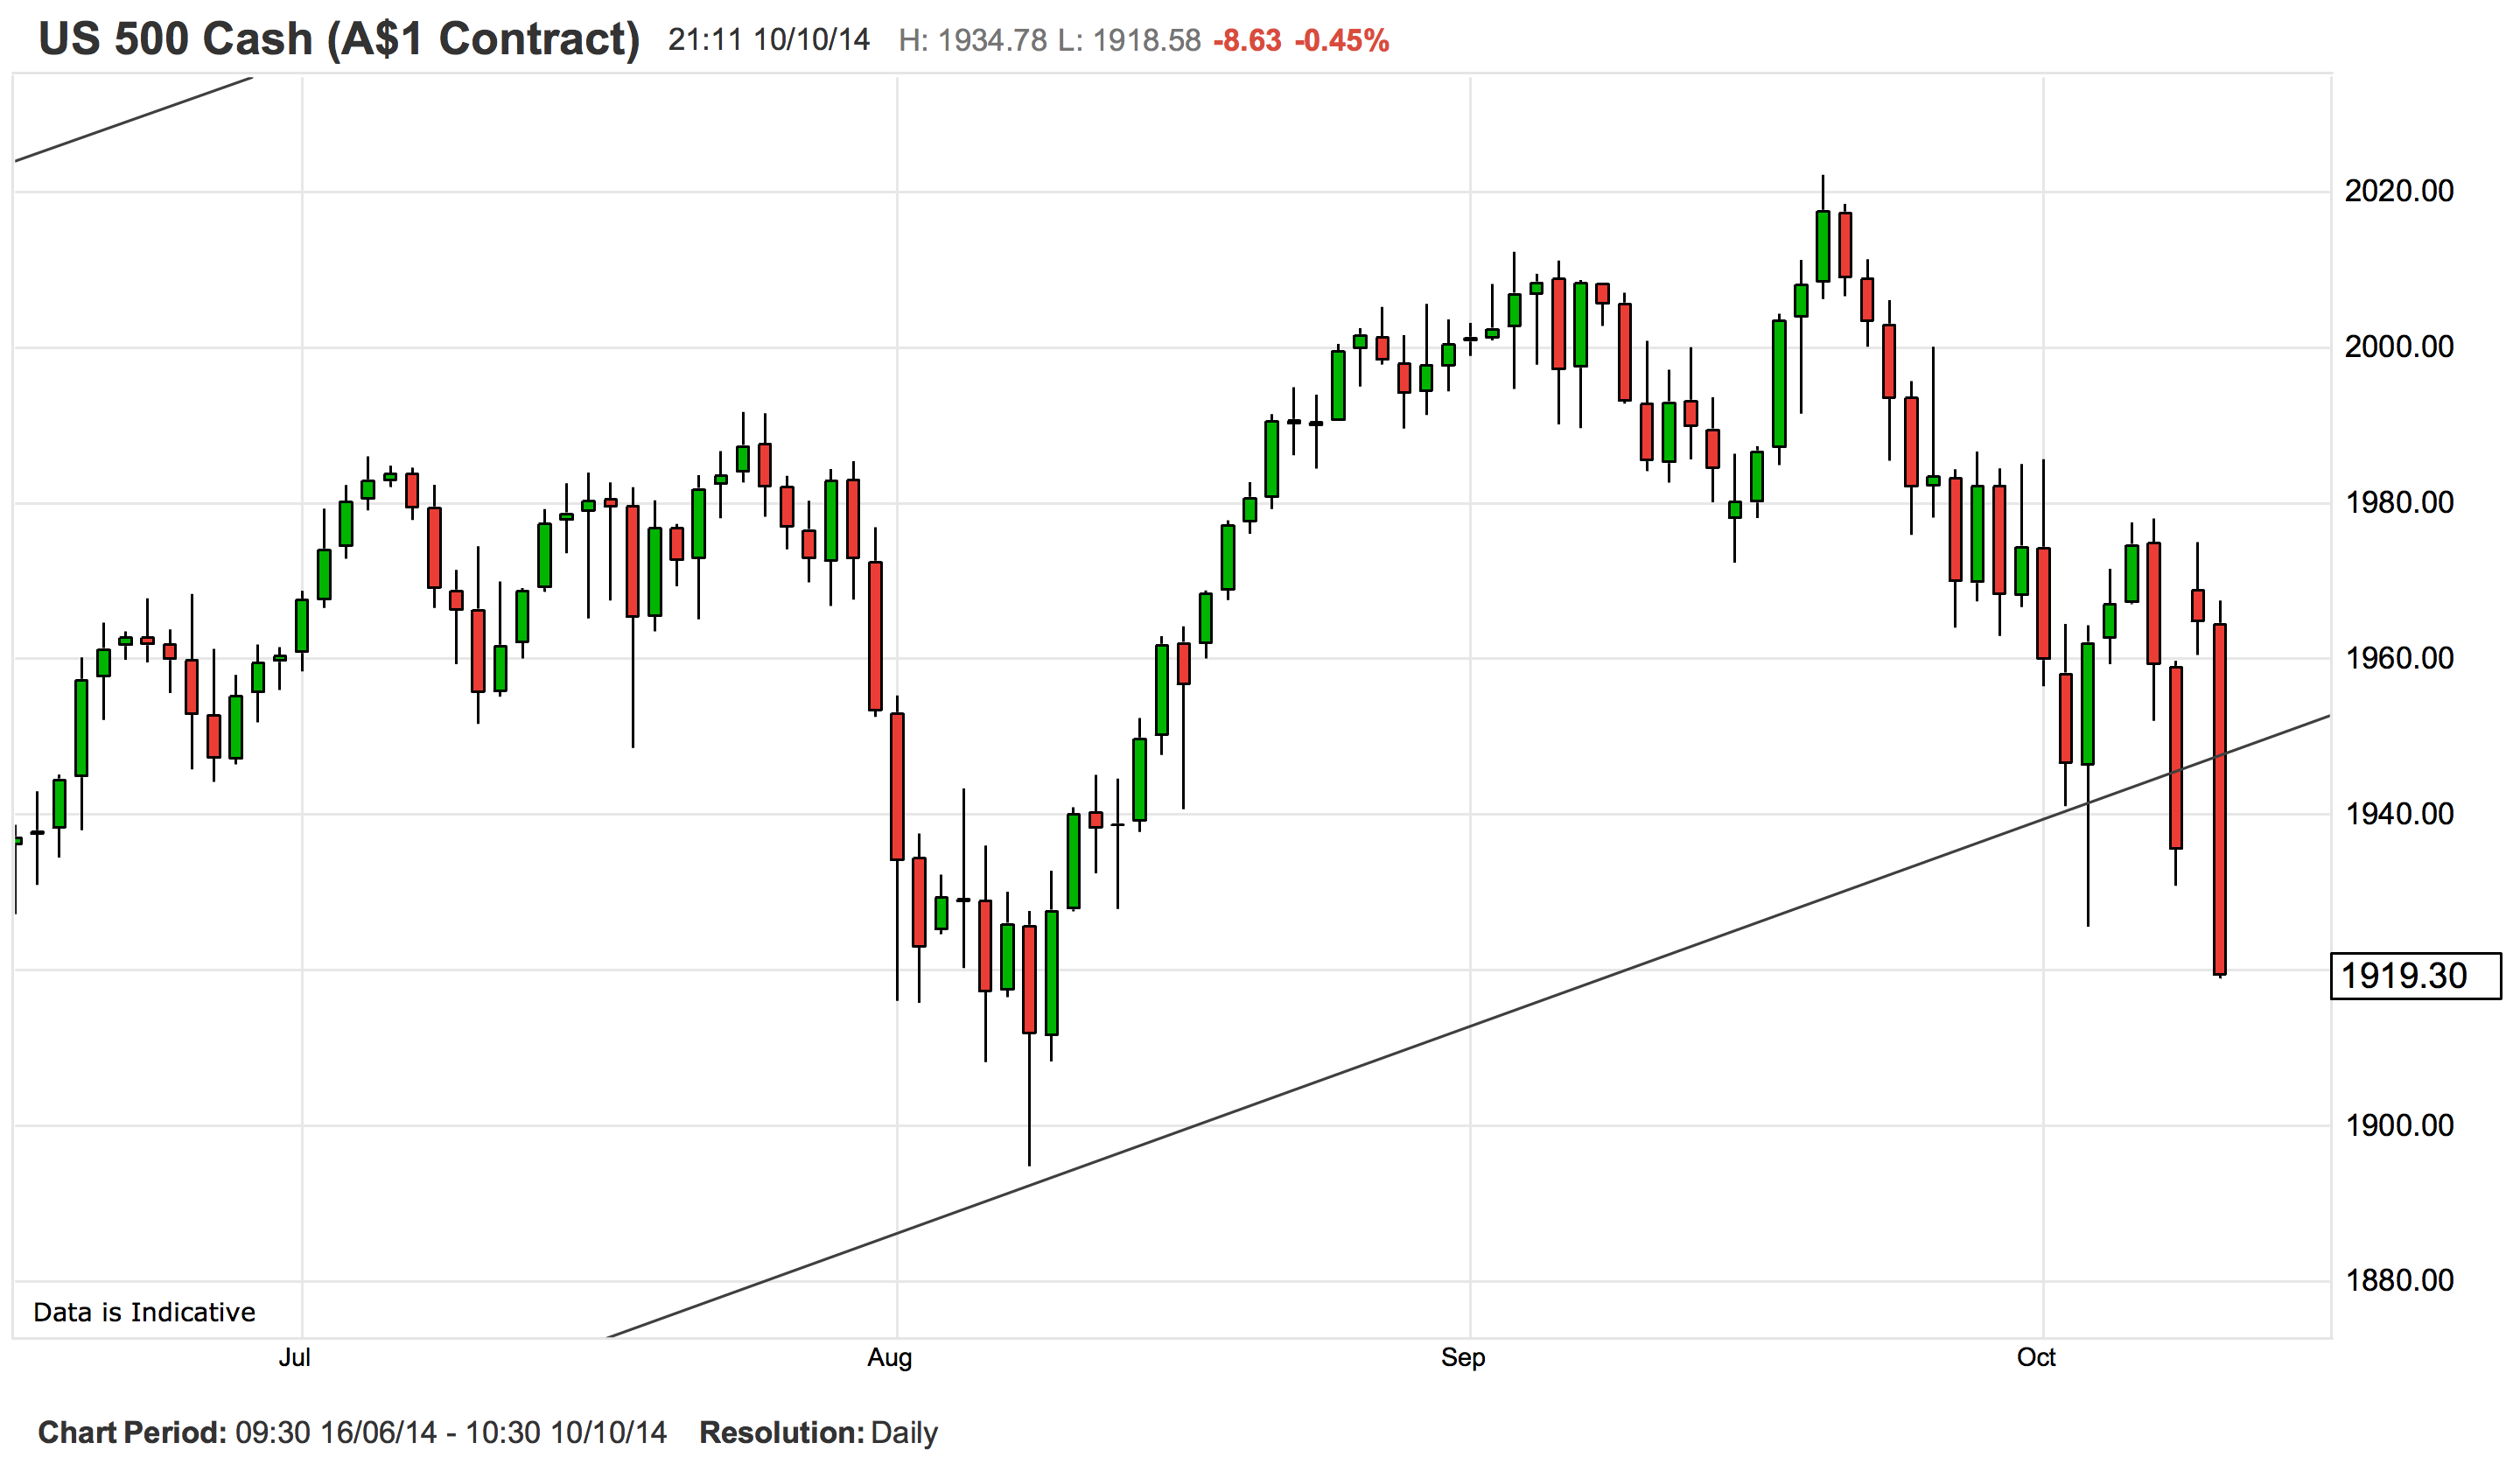
That’s three breaks of the trend line. The second rally back above support was provoked by the Fed minutes I mentioned before. It was a desperate rally and the swiftness with which it was rejected will be a shot in the arm to the bears.
The IMF meeting this weekend, at which a number of Fed members will be speaking, heightens risk of holding positions into the close tonight. It’s looking as though the various speakers, Vice Chairman Stanley Fischer in particular, will need to pull something generously dovish out of the bag to rescue equities in the short-term.
In some ways you’ve got to marvel at the manner in which this (potential!) correction in equities is unfolding. You’d be hard pressed to find anybody with even a passing curiosity in markets who isn’t aware that QE has supported stock prices. Likewise, every man and his broker has known that the end of QE at least risked a serious dislocation in asset markets. As the great Stanley Druckenmiller put it just over 12 months ago, “How in the world does anyone think when the actual exit (from QE) happens that prices are not going to respond?”
How indeed. Prices are responding just as so many expected them to, but not really in anticipation of the end of QE, but rather right as its happening. It’s a poignant reminder of the level of complacency that accompanies low-volatility, financially repressed asset markets, where the hunt for yield dominates over all other concerns.
Whatever happens with equities in the immediate future, it’s looking as though the days of leveraging up and exploiting yield wherever you can find it, with scarcely a care for the risk involved, is on the way out. With the global growth phantasm fading (again), and the end of QE to boot, markets are set to get much more belligerent and unforgiving.
Volatility is back.
Home sweet home
One consequence of all this excitement for us Aussies has been a sharp and most welcome drop in the AUDUSD.
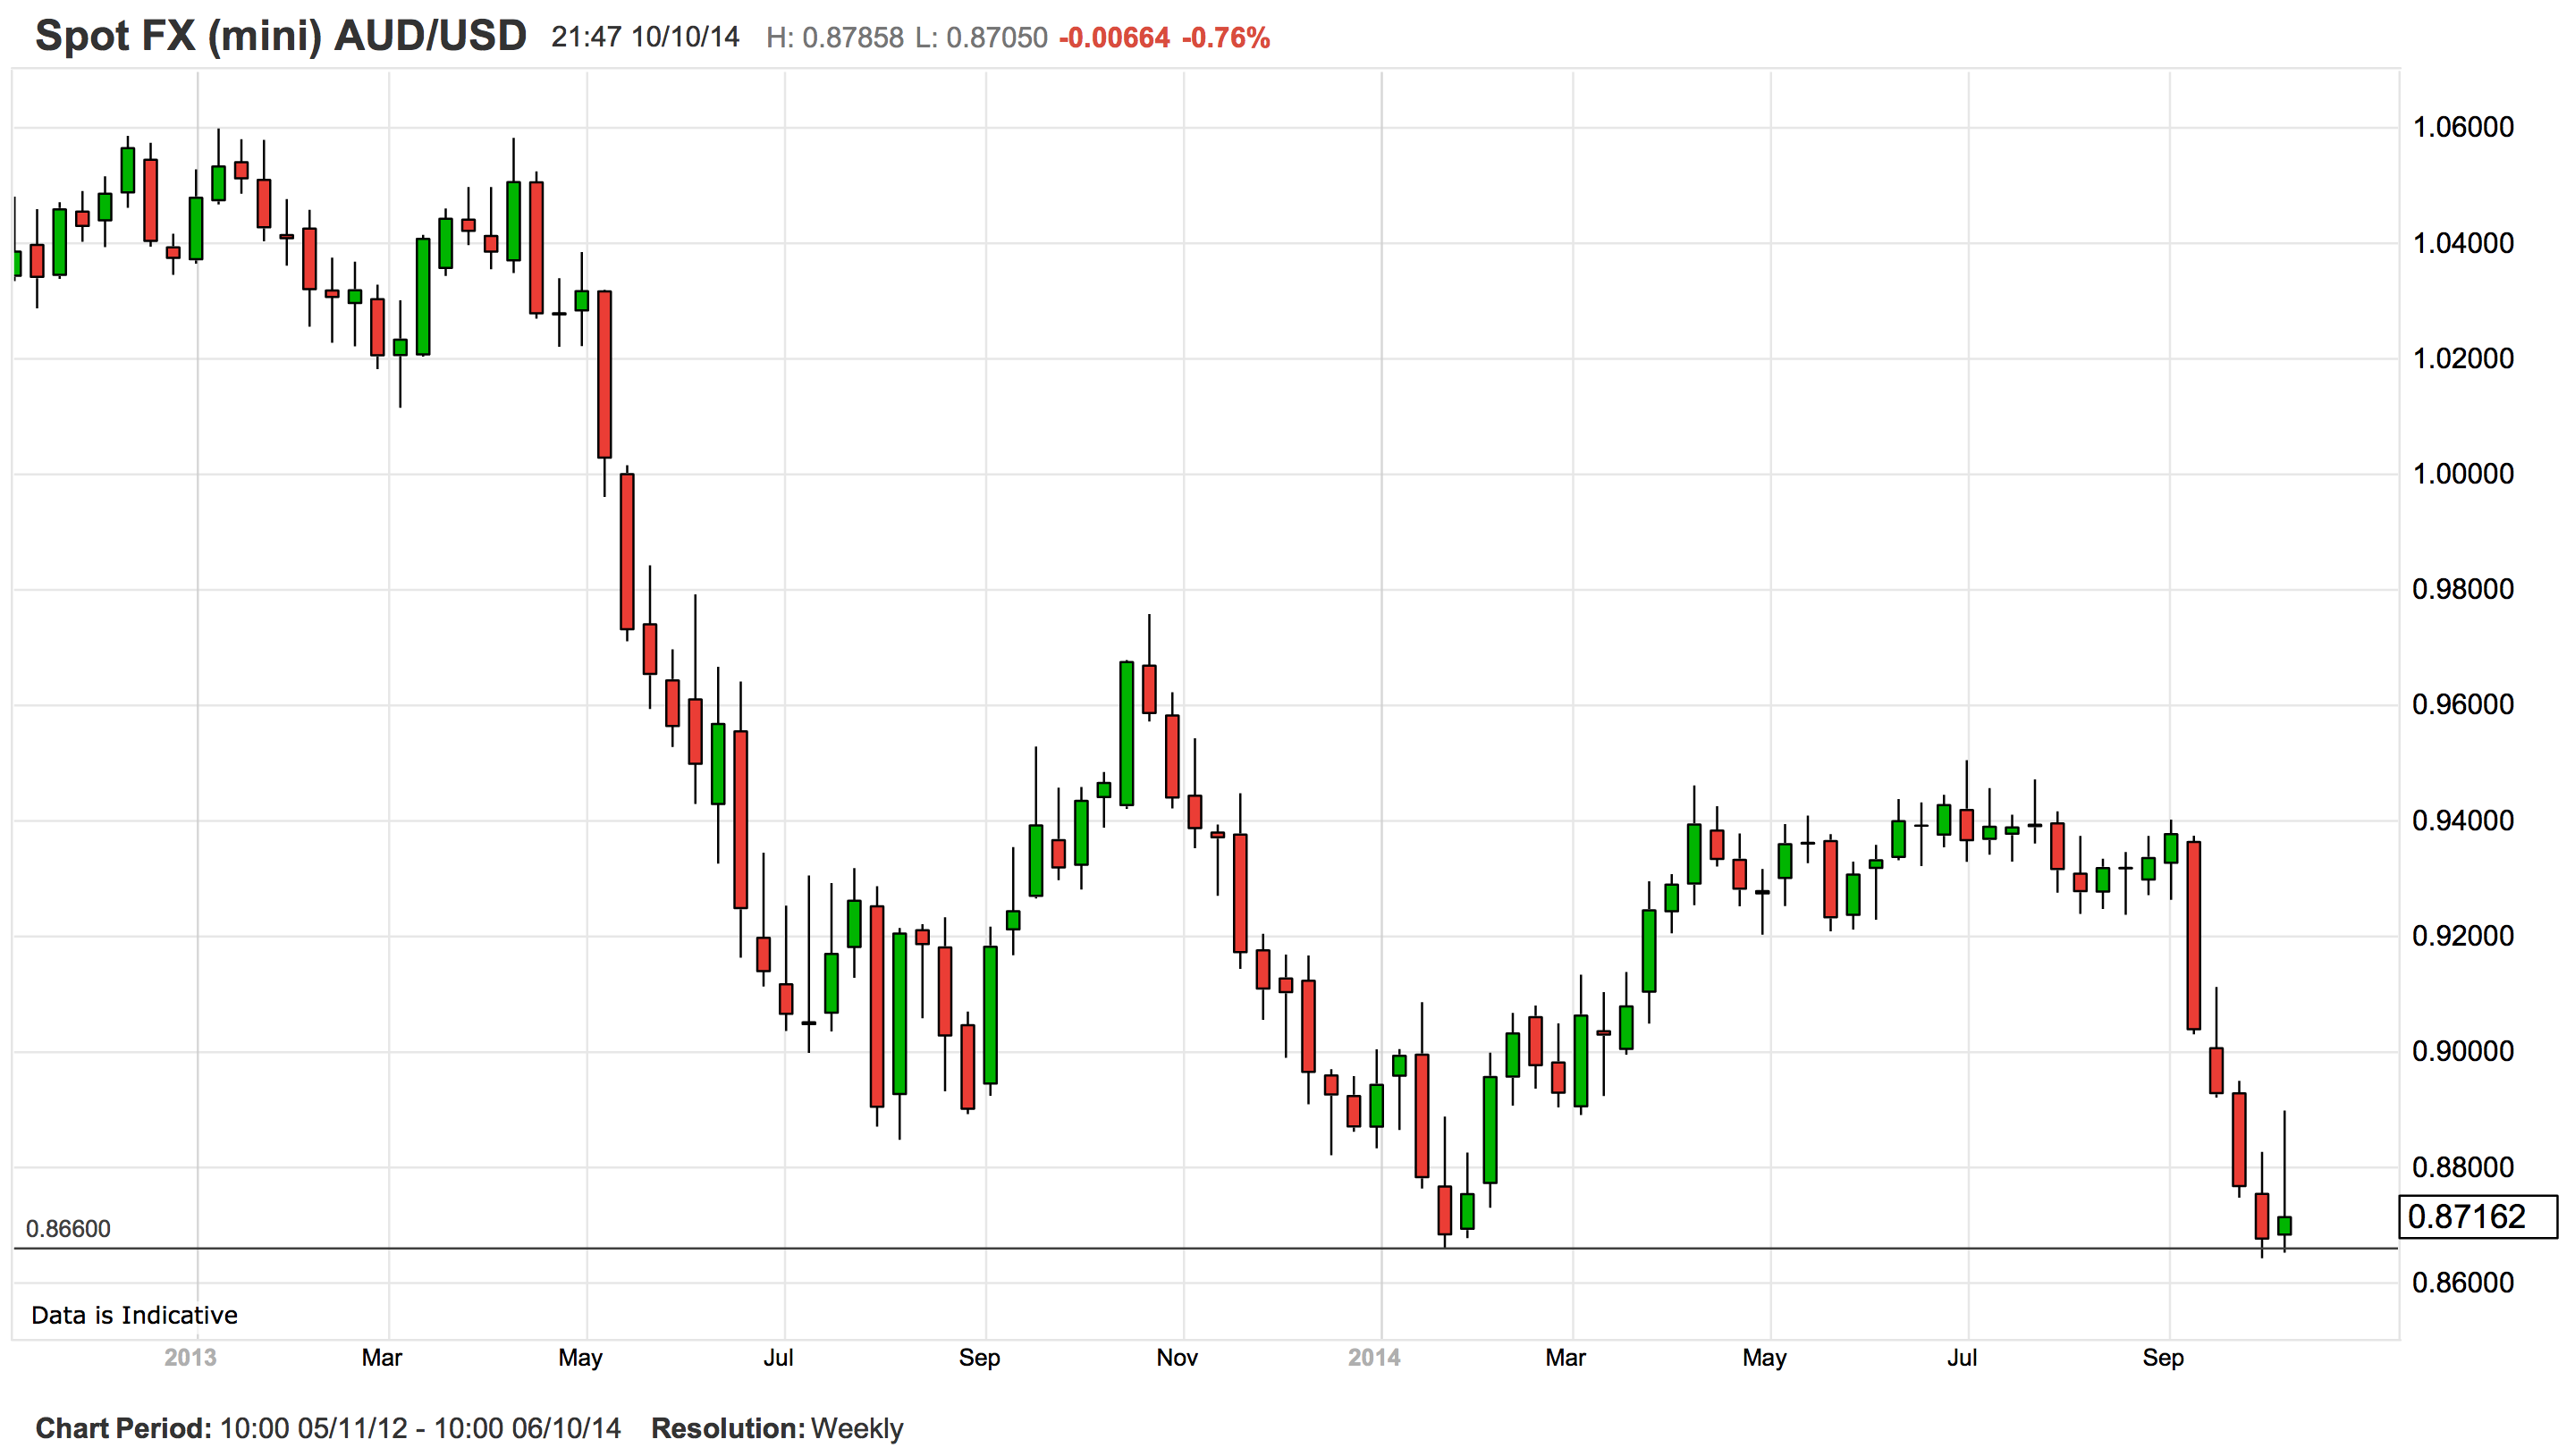
Similar to gold, AUDUSD bounced off the previous low set earlier this year. It then staged a heroic but short-lived rebound, which was smacked down ruthlessly. Hard to see support holding for long.
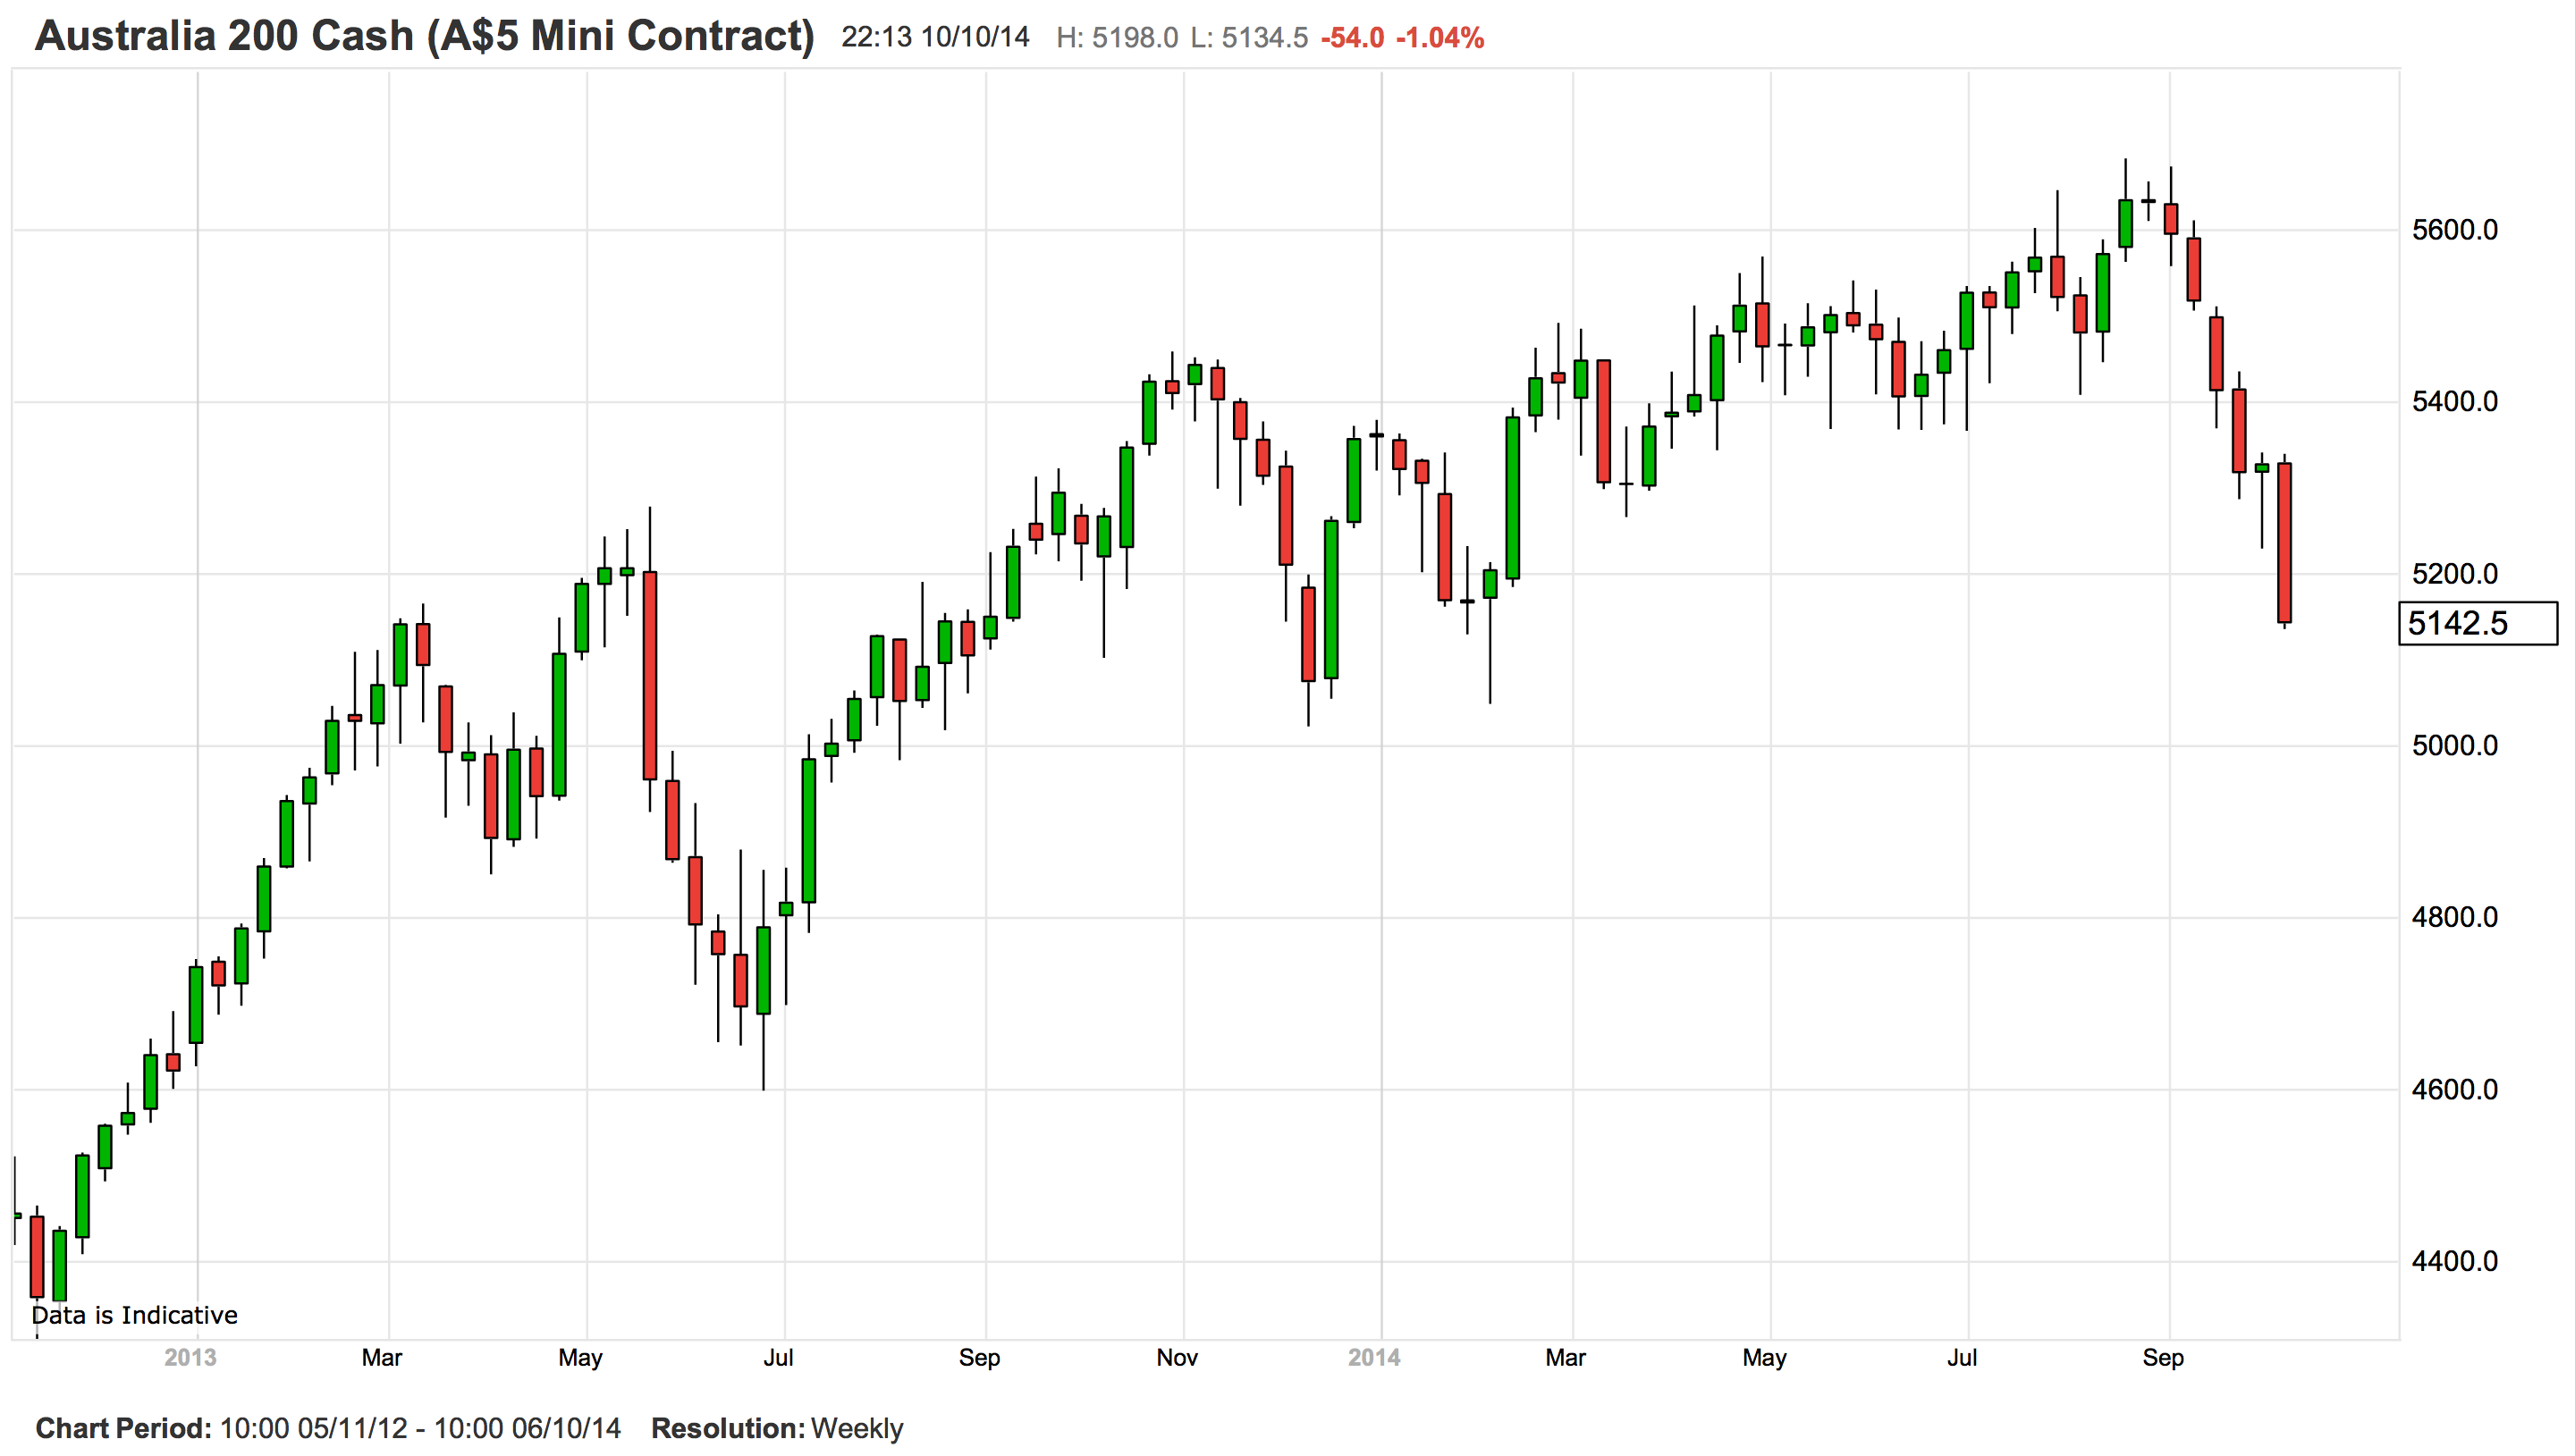
AUD-exposed firms with a strong export profile therefore remain the best prospect among Australian shares. However, I wouldn’t be in any great hurry to rush in, as the downside risks to equities at the moment are palpable. (Note that the chart below reflects after-market futures trading, the close was 5188.)
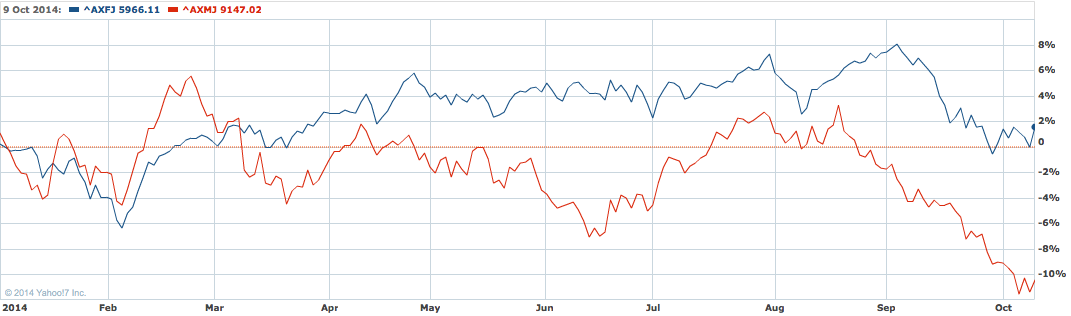
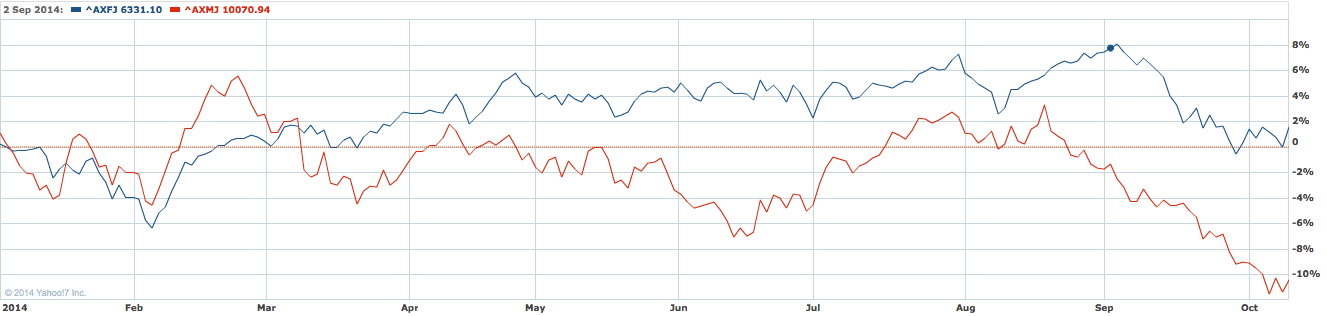
With equities well down for the calendar year now, it’s worth taking a look at the sectoral breakdown within the market.
Unsurprisingly, the materials index (XMJ) has been getting pummelled this year. Financials (XFJ) are up slightly but they’ve had a rough ride of late as well, particularly as foreign money hastily bails out of all AUD exposure (which of course has hastened the AUD slide).
Charts built using Yahoo Finance
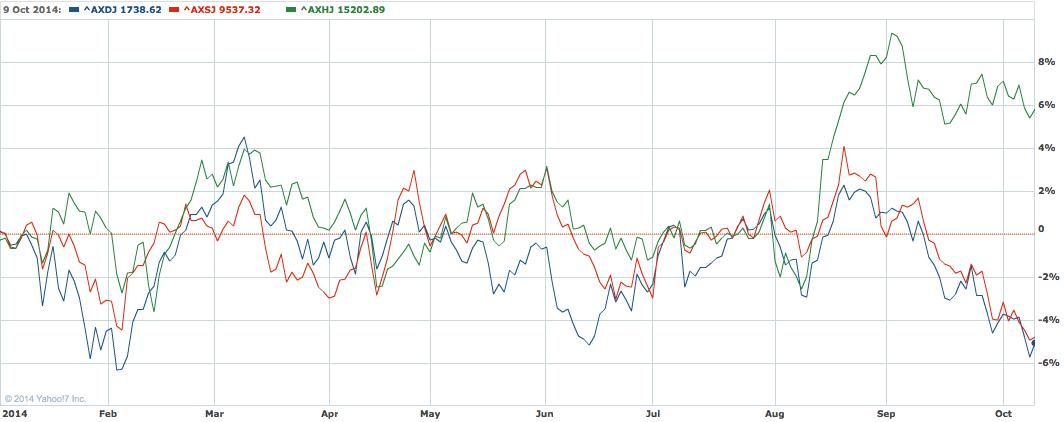
Both consumer staples (XSJ) and discretionary (XDJ) are down year-to-date, and this is reflective of lacklustre consumer sentiment and subdued retail sales post-budget. Health stocks (XHJ) are looking healthy, although that’s almost entirely because of CSL’s rally in August after its profit beat and buyback plan announcement (CSL is roughly half the index).
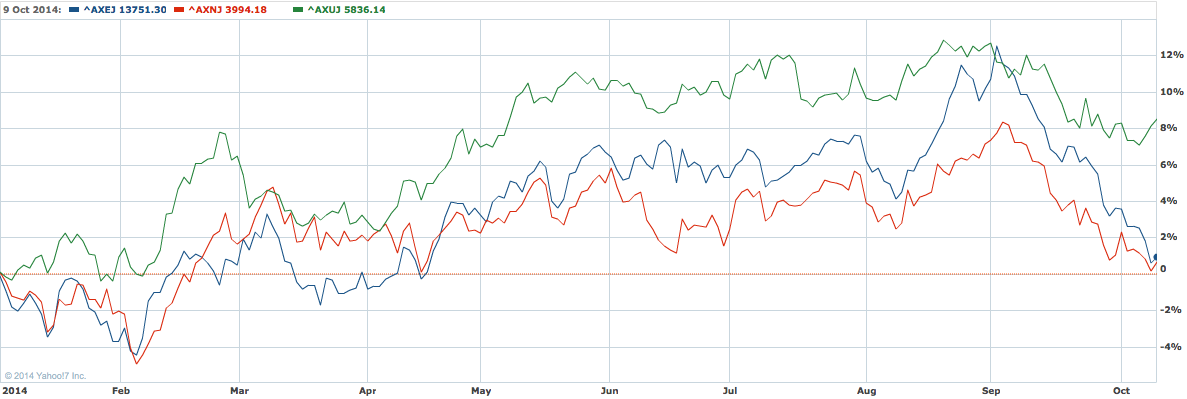
Industrials (XNJ) have mostly sold-off in sympathy with the market since early September. Energy stocks (XEJ) briefly joined utilities (XUJ) as the star performers of 2014, until the collapse in oil prices spoiled the party. This leaves the humble XUJ as the stand-out sector so far in 2014. The driver of the strength in the utilities space this year has been natural gas pipelines operator, APA. As Australia prepares to ramp up its LNG exports, APA has been in the box seat to exploit bottlenecks in gas transportation networks. Even after the recent broad market selloff, APA is still up around 20% for 2014.
Steel-ore complex
Better price action for steel and iron ore today in China, with the most-traded rebar contract up 1.6% and Dalian iron ore up 2.3%. More in the usual place.
Here’s what spot is looking like at:
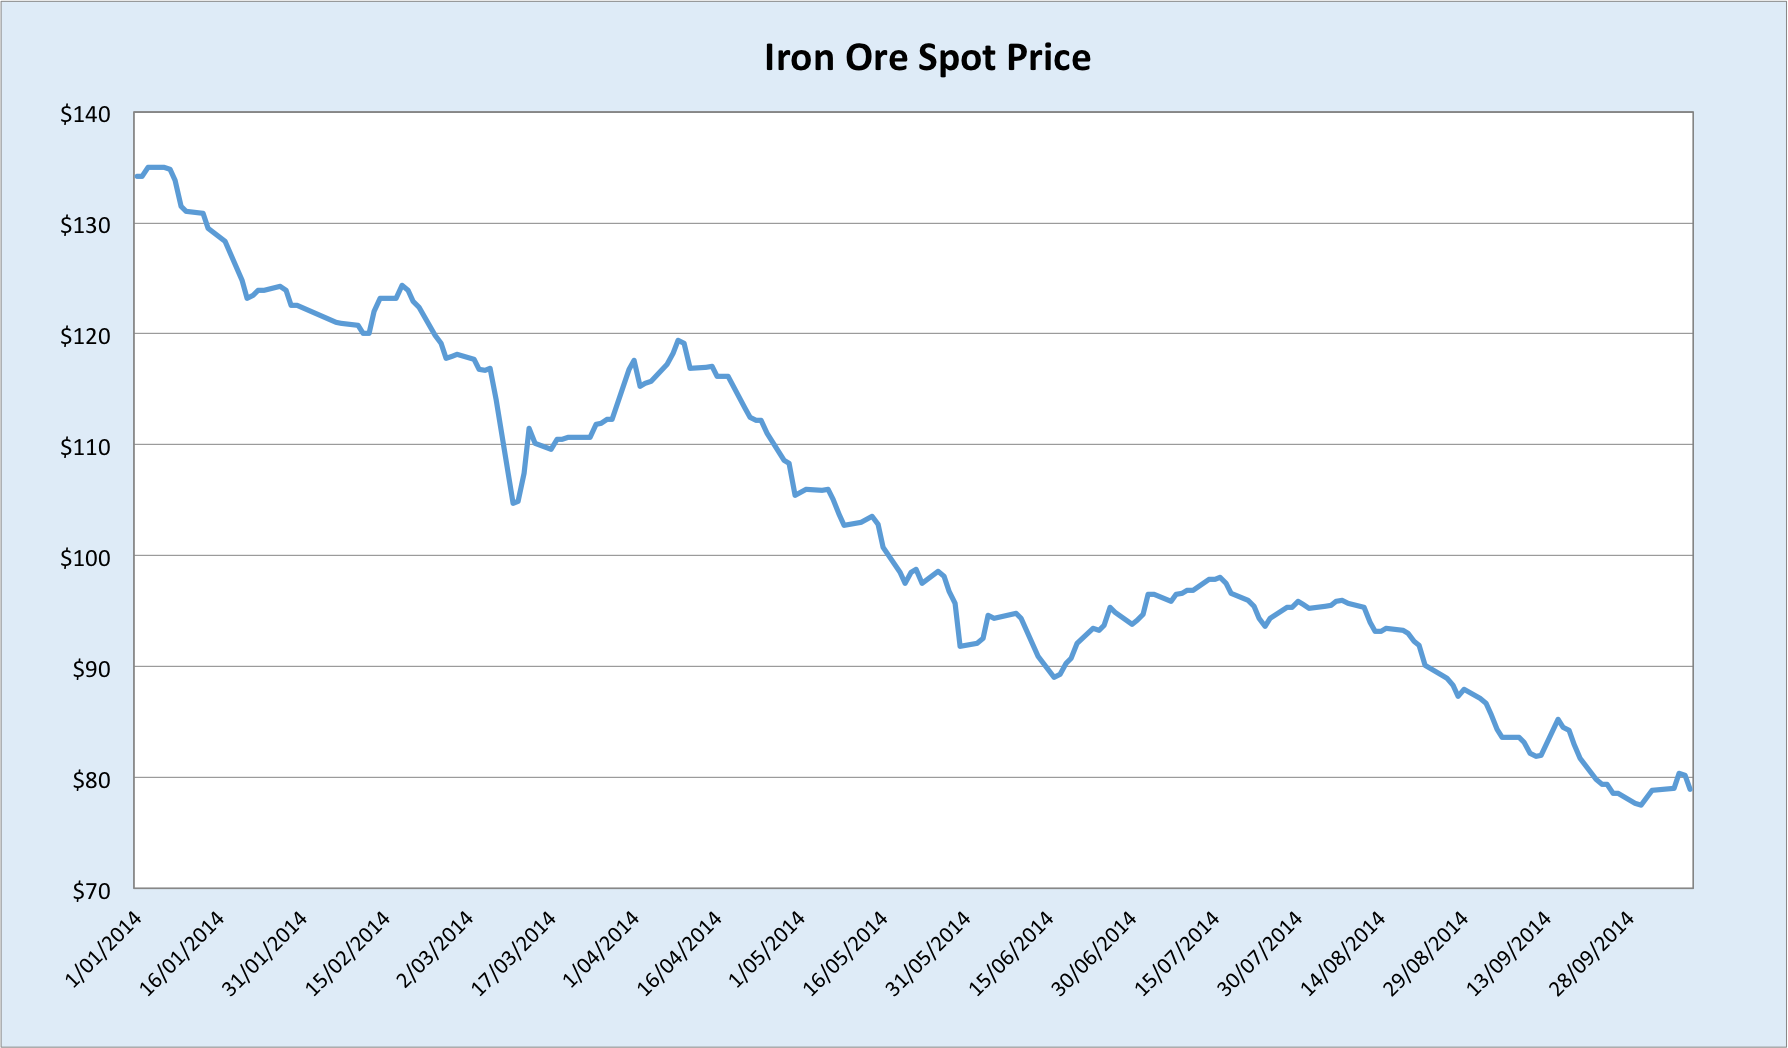
Still fishing for a bottom.
There has been a noticeable thawing in the policy stance towards property in China recently, and if this helps property prices stabilise then it could provide the impetus for a bit of restocking by steel mills, bestowing upon us the fabled Q4 rebound. The trouble is, along with steel and iron ore, property is oversupplied to a degree it hasn’t been in the past; it’s going to take a truly massive credit splurge to reboot the bubble now. And all signs indicate the government isn’t stupid enough to do that.
Still, the worst may well be past for the iron ore miners in 2014. But they’d better pray the AUDUSD has fallen hard by the time the pain resumes in 2015.

Pingback: Straya T’day 16/10/2014 | Strayanomics
Hi there to every body, it’s my first pay a quick vijsit of this website; this website carries awesome and genuinely excellent
information in suppoort of readers.
LikeLike