

Having had the weekend to digest the Bank of Japan’s shock decision to increase its quantitive easing program, I’ve a few thoughts on what this might mean for the globe.
Permafrost of a permabear
Back in 1996, hyper-bear Albert Edwards unveiled his ‘Ice Age’ thesis, arguing that the West would find itself beset by the same deflationary forces that had seen Japanese equities persistently trade far below the bubbly peaks of the 1980s. This ‘Ice Age’ entailed equities under-performing both in absolute terms and relative to bonds (falling inflation makes fixed-interest securities more attractive, since in real terms the income received rises).
Even with the wild spasms of recent decades, his extreme bearishness towards Western equity markets has been a big loser.
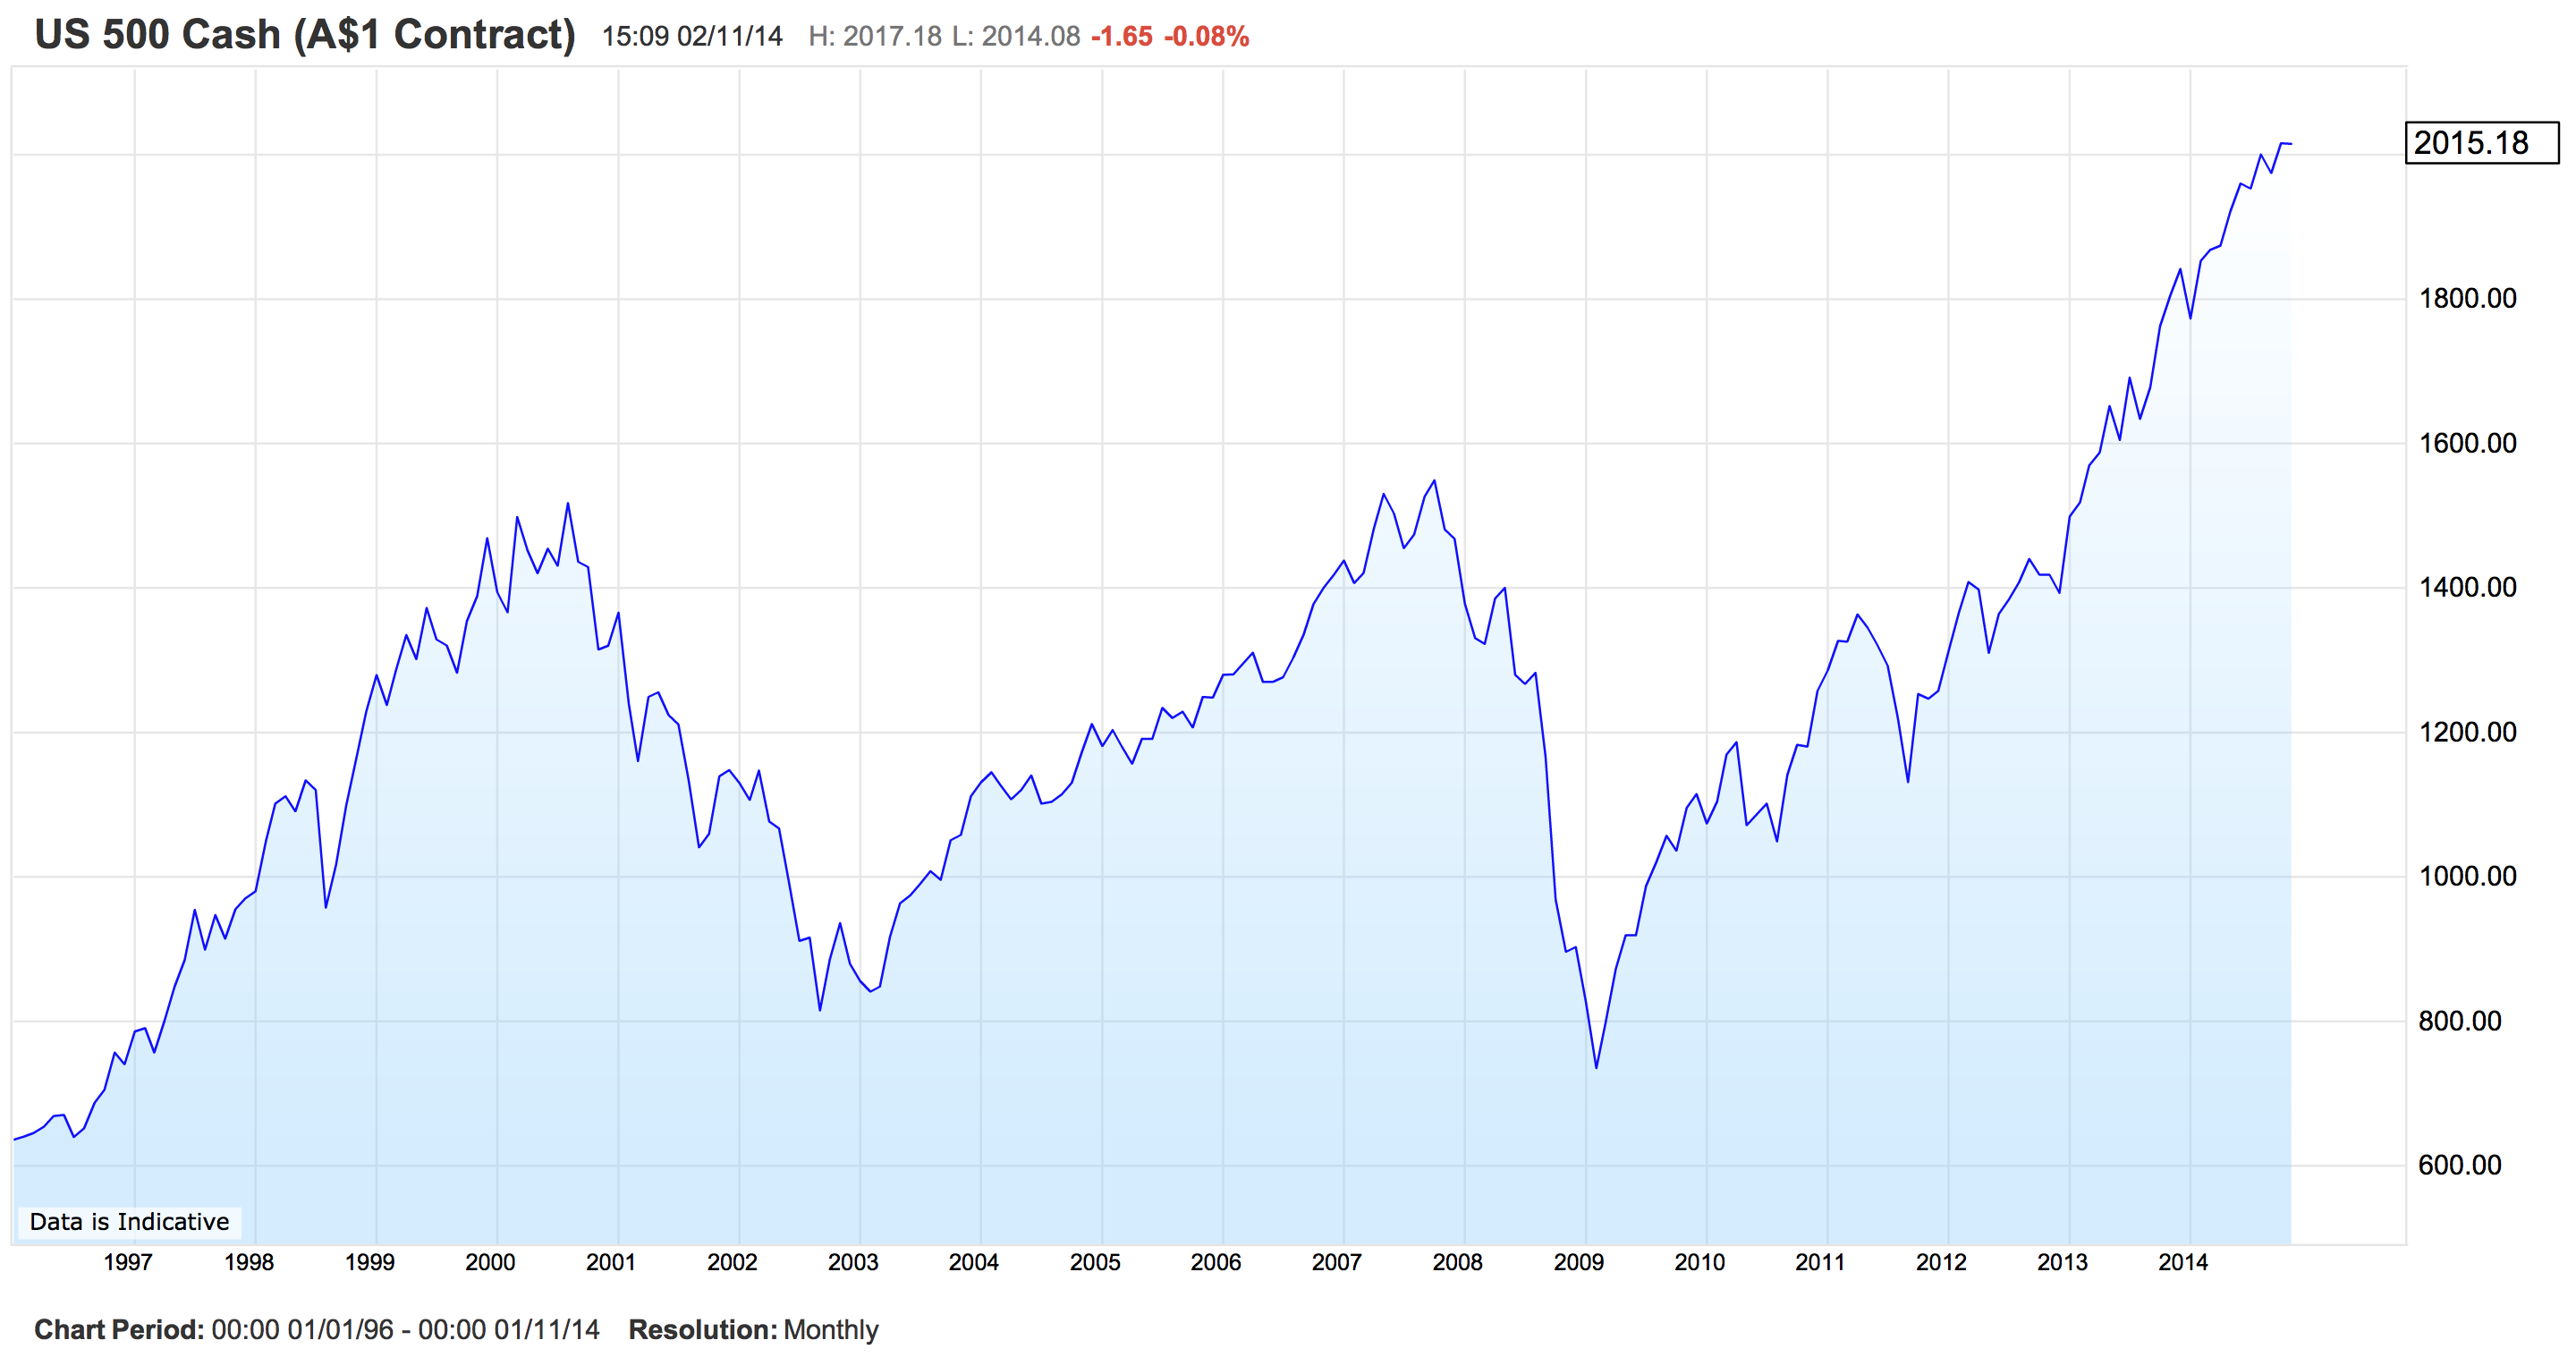
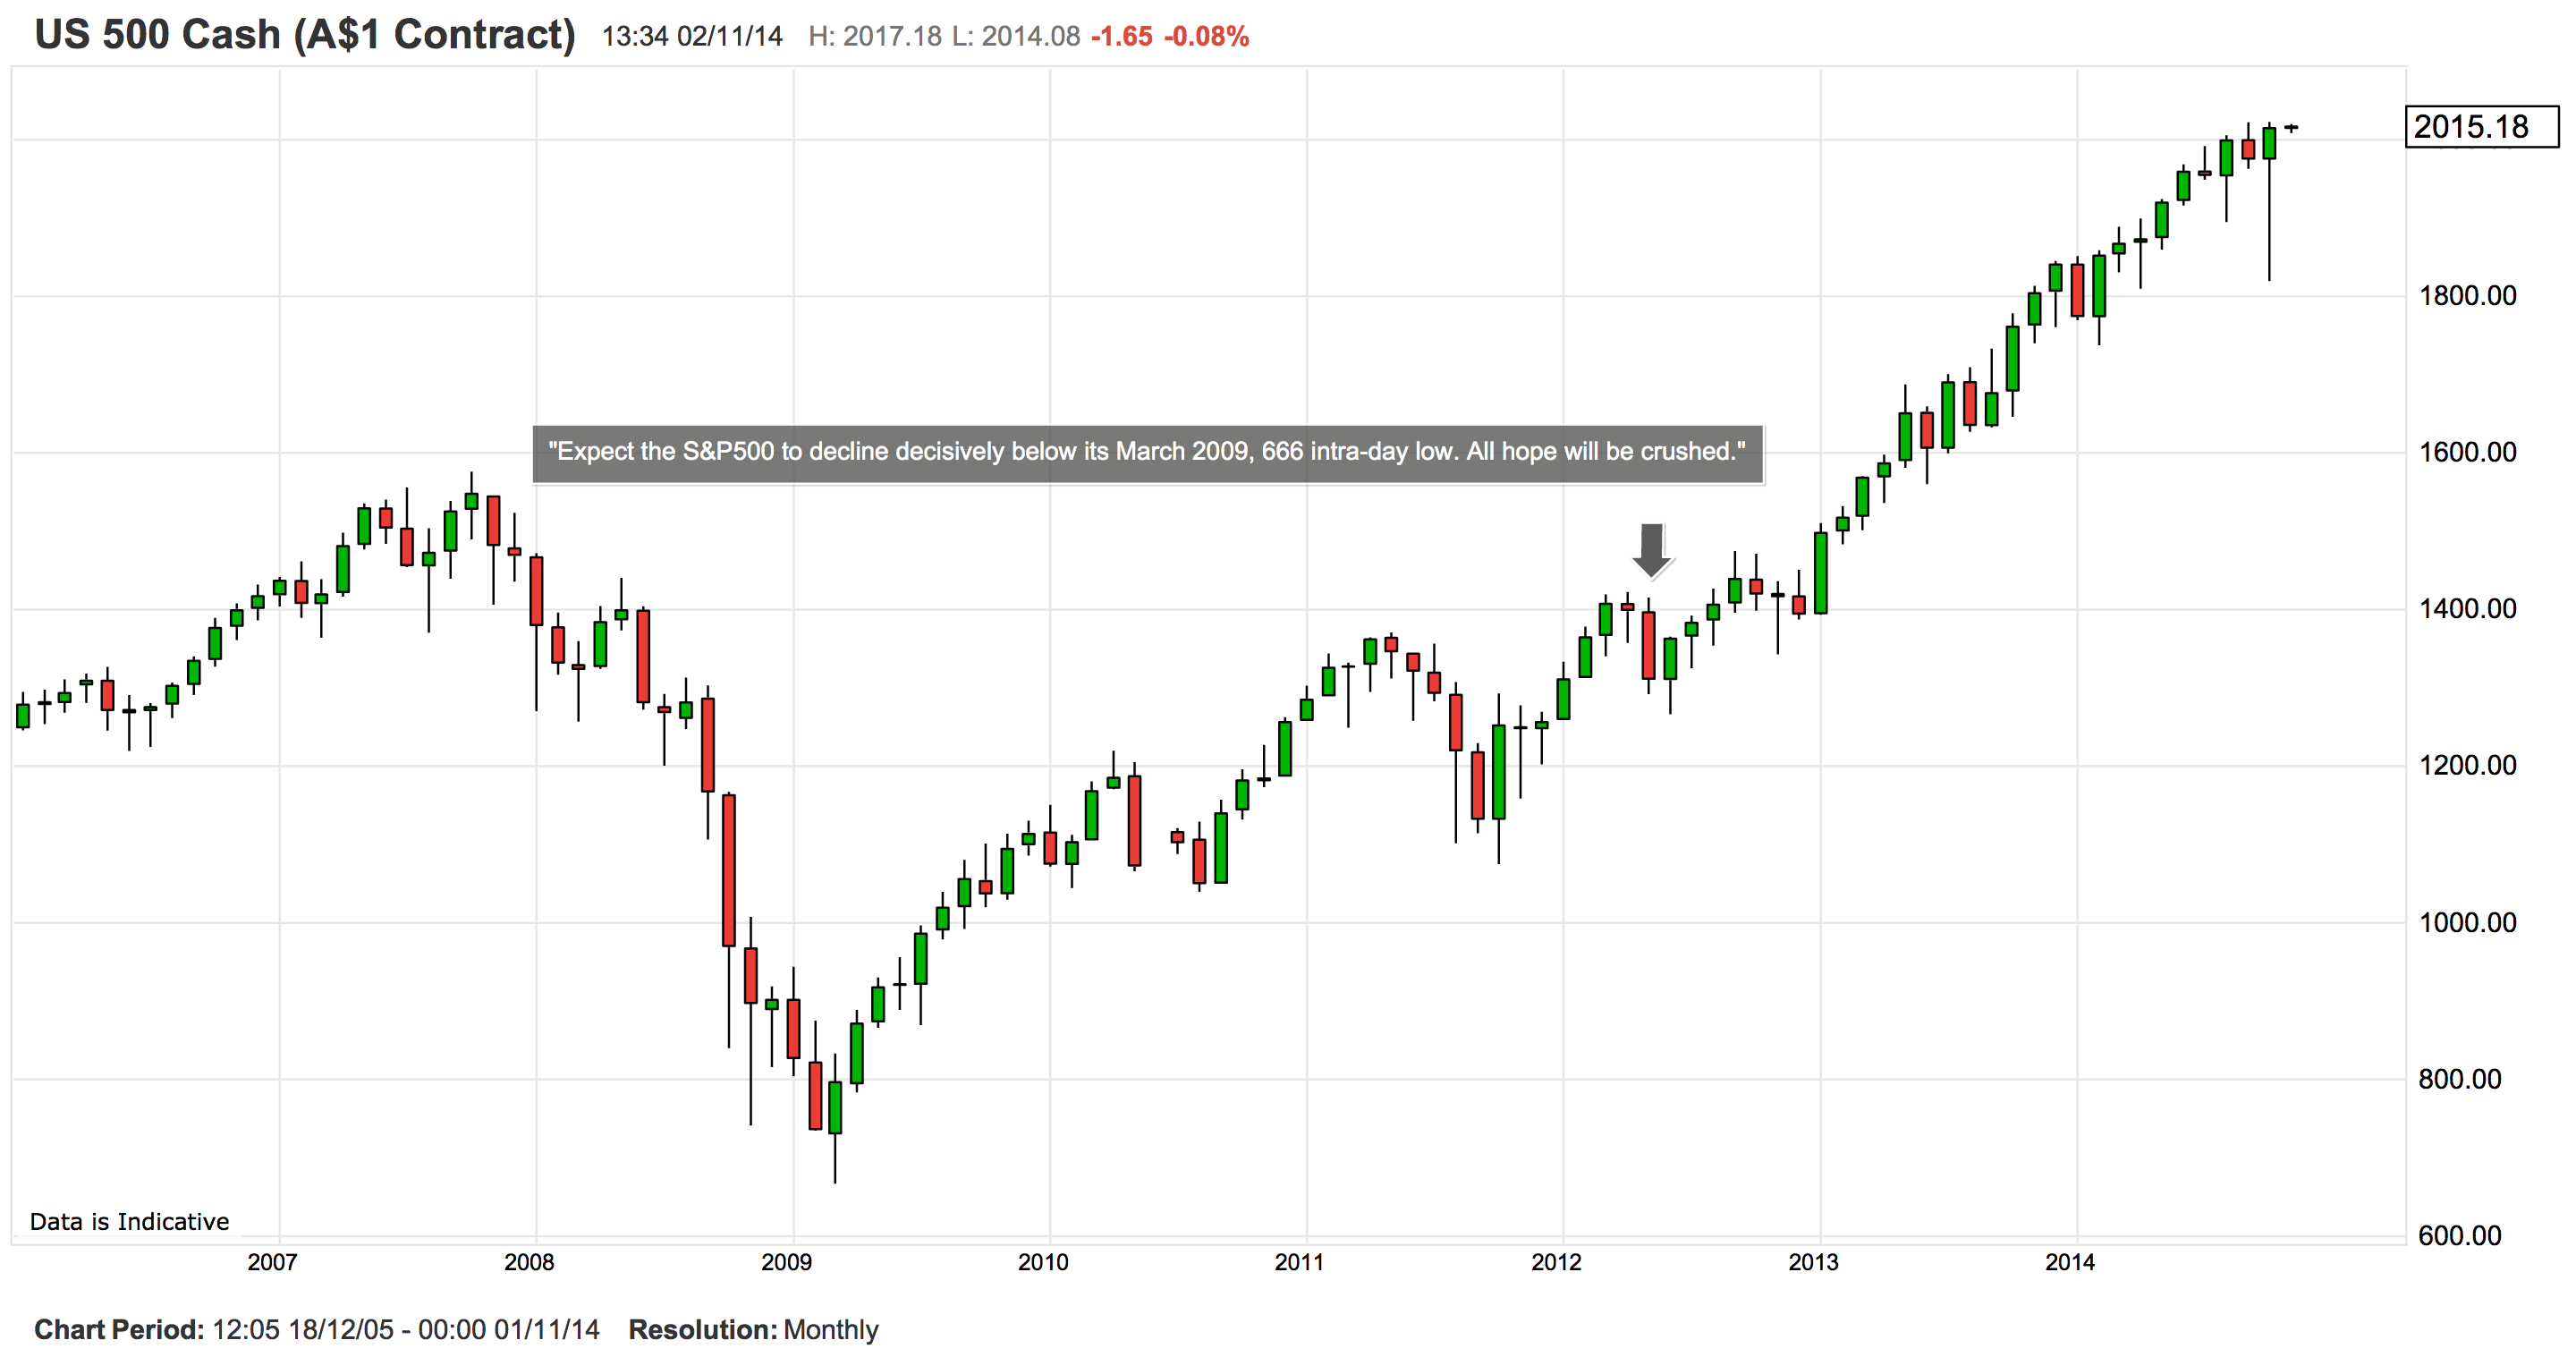
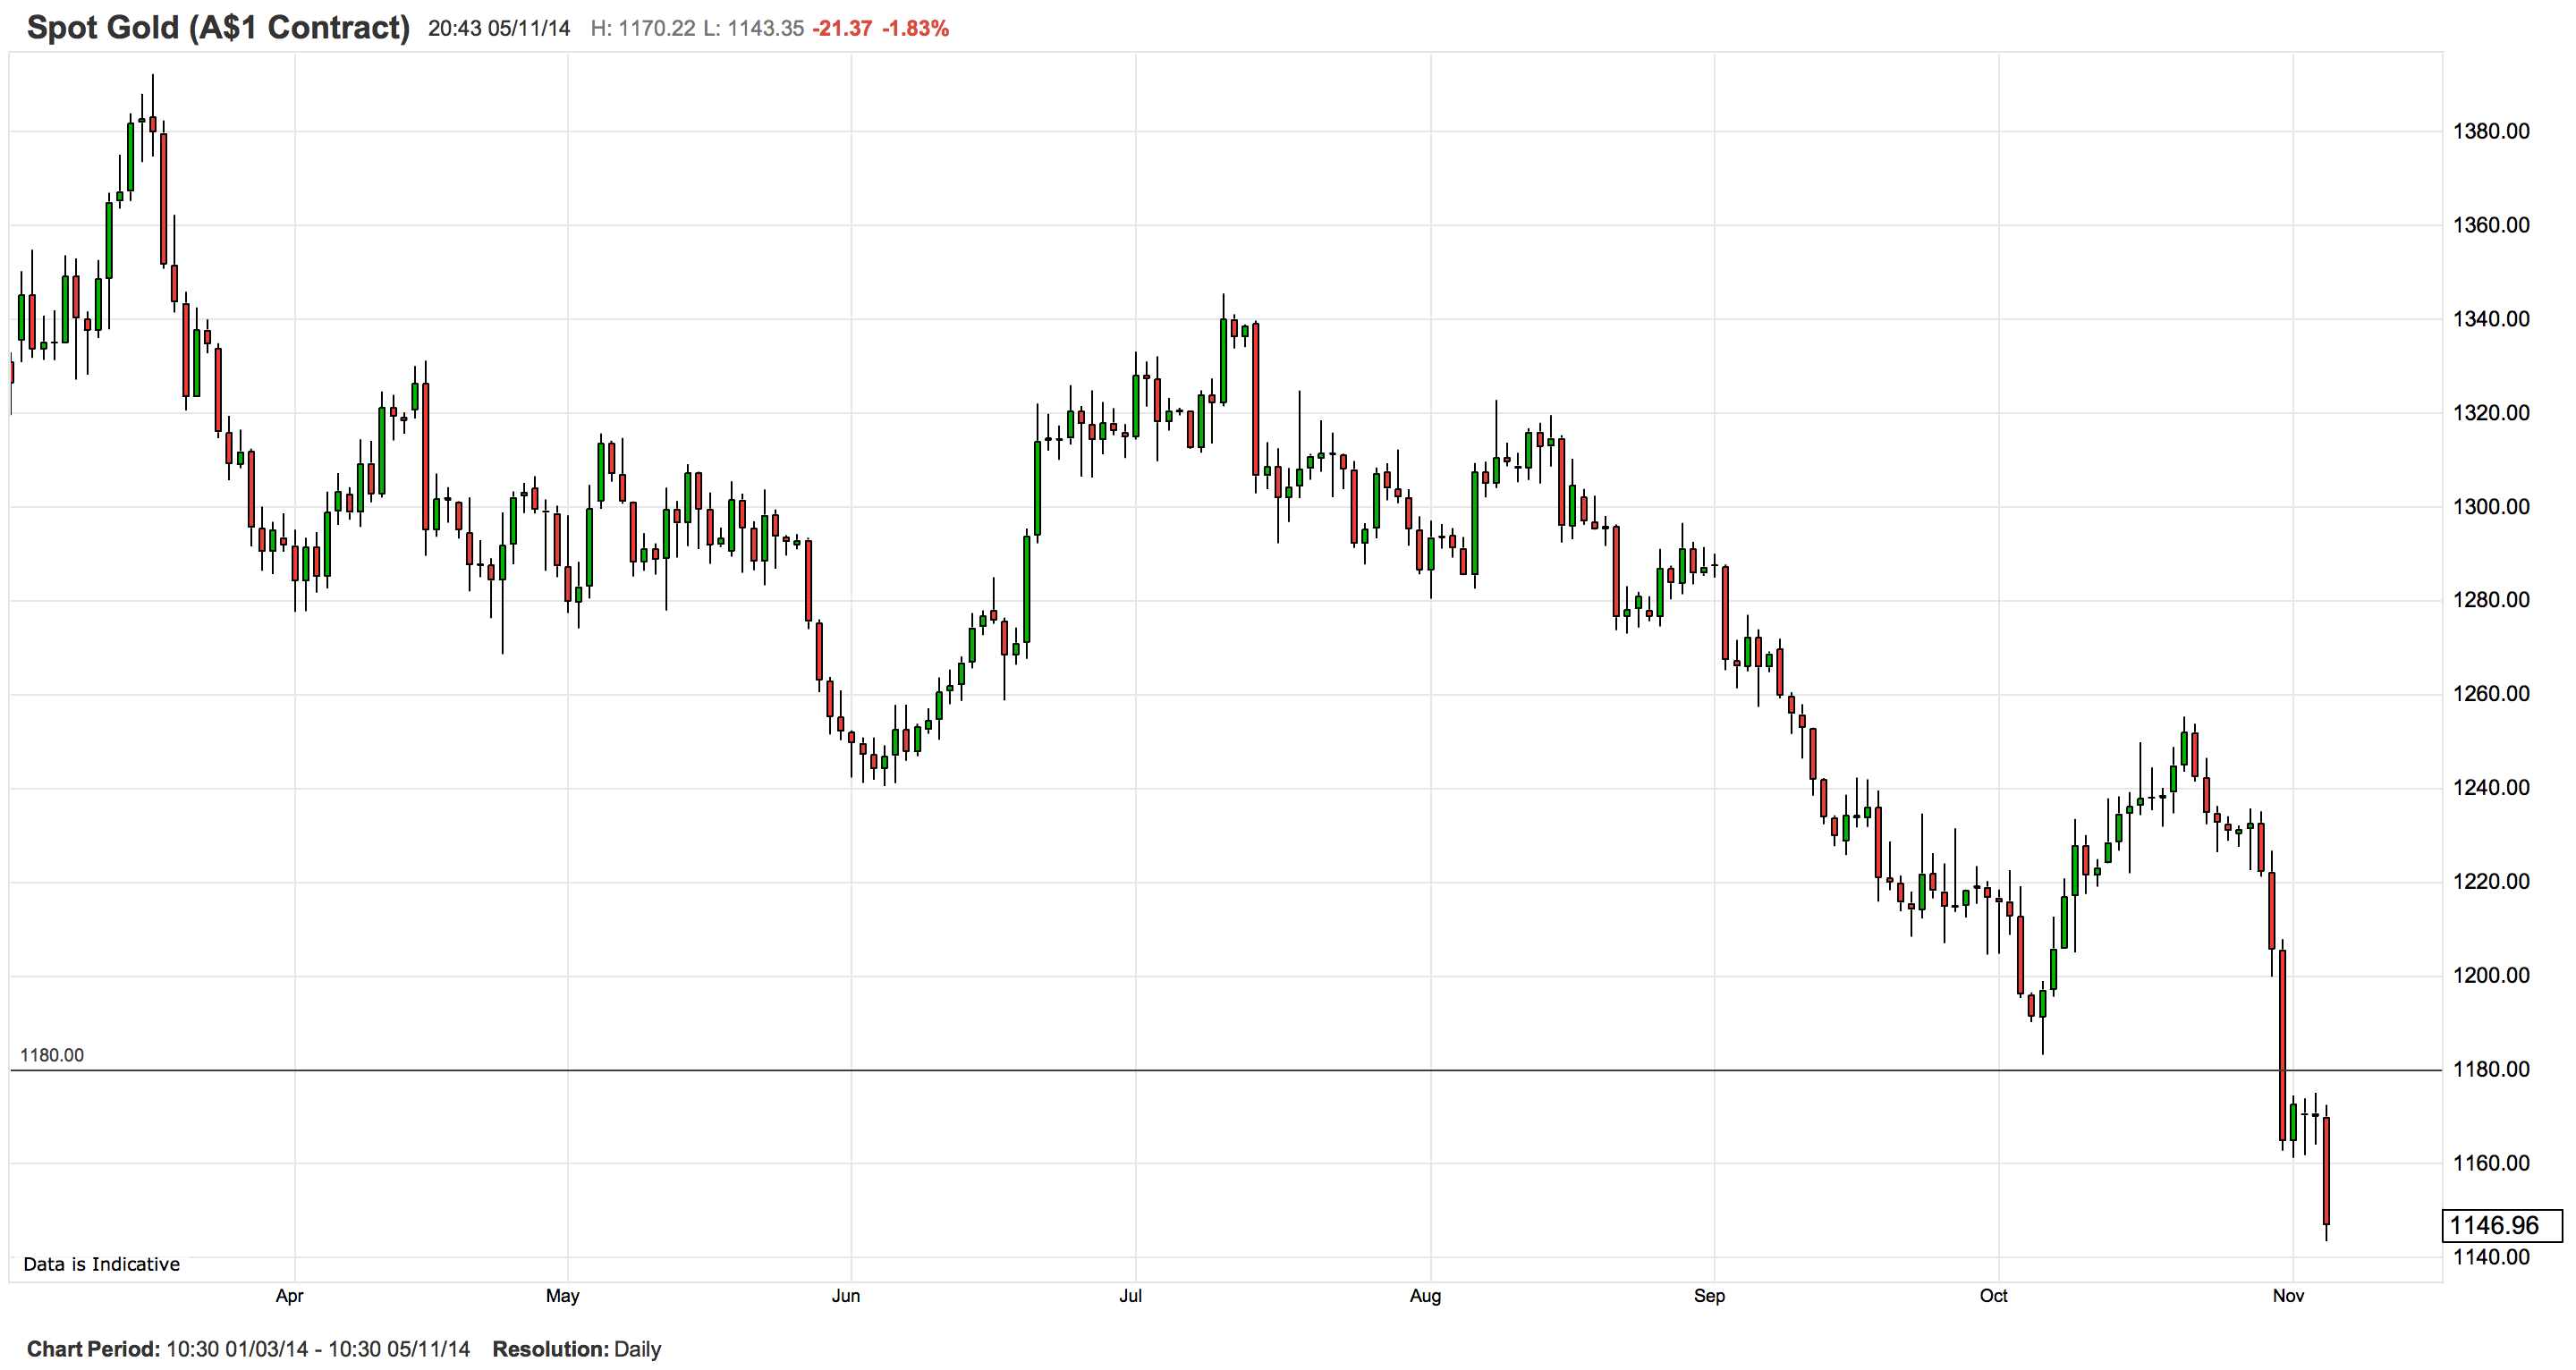
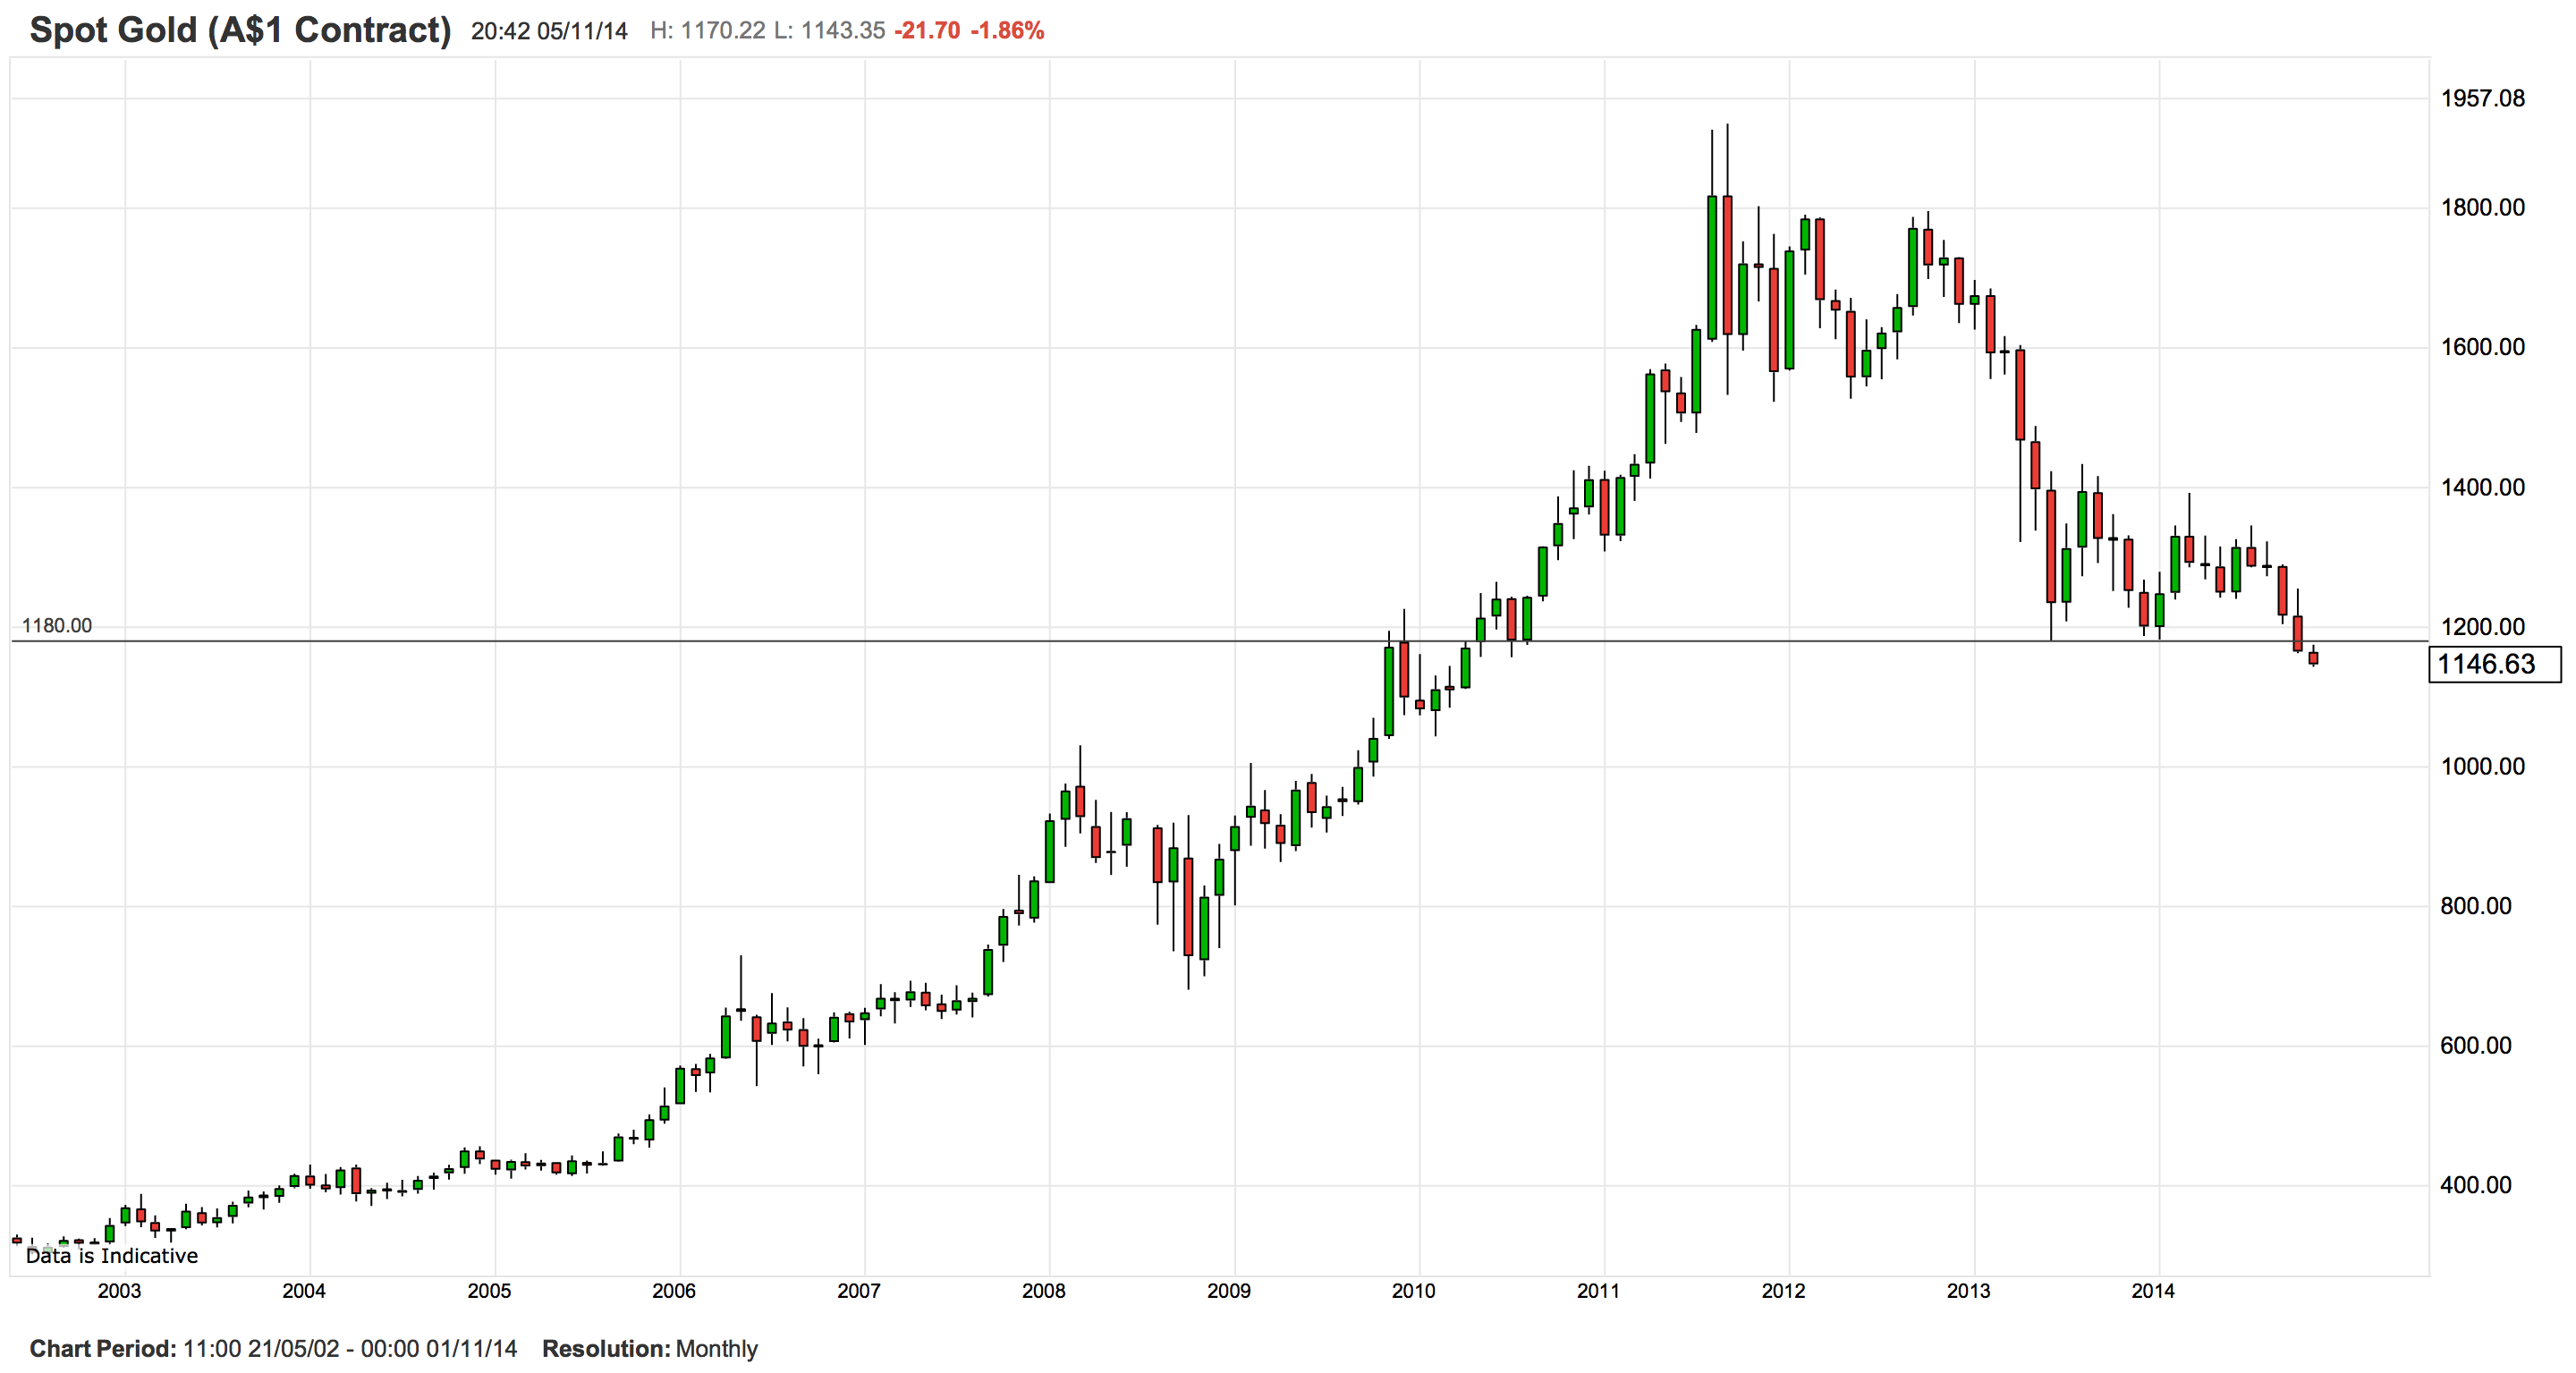
This hasn’t discouraged him; you can see one of his latter-day howlers on the chart below.
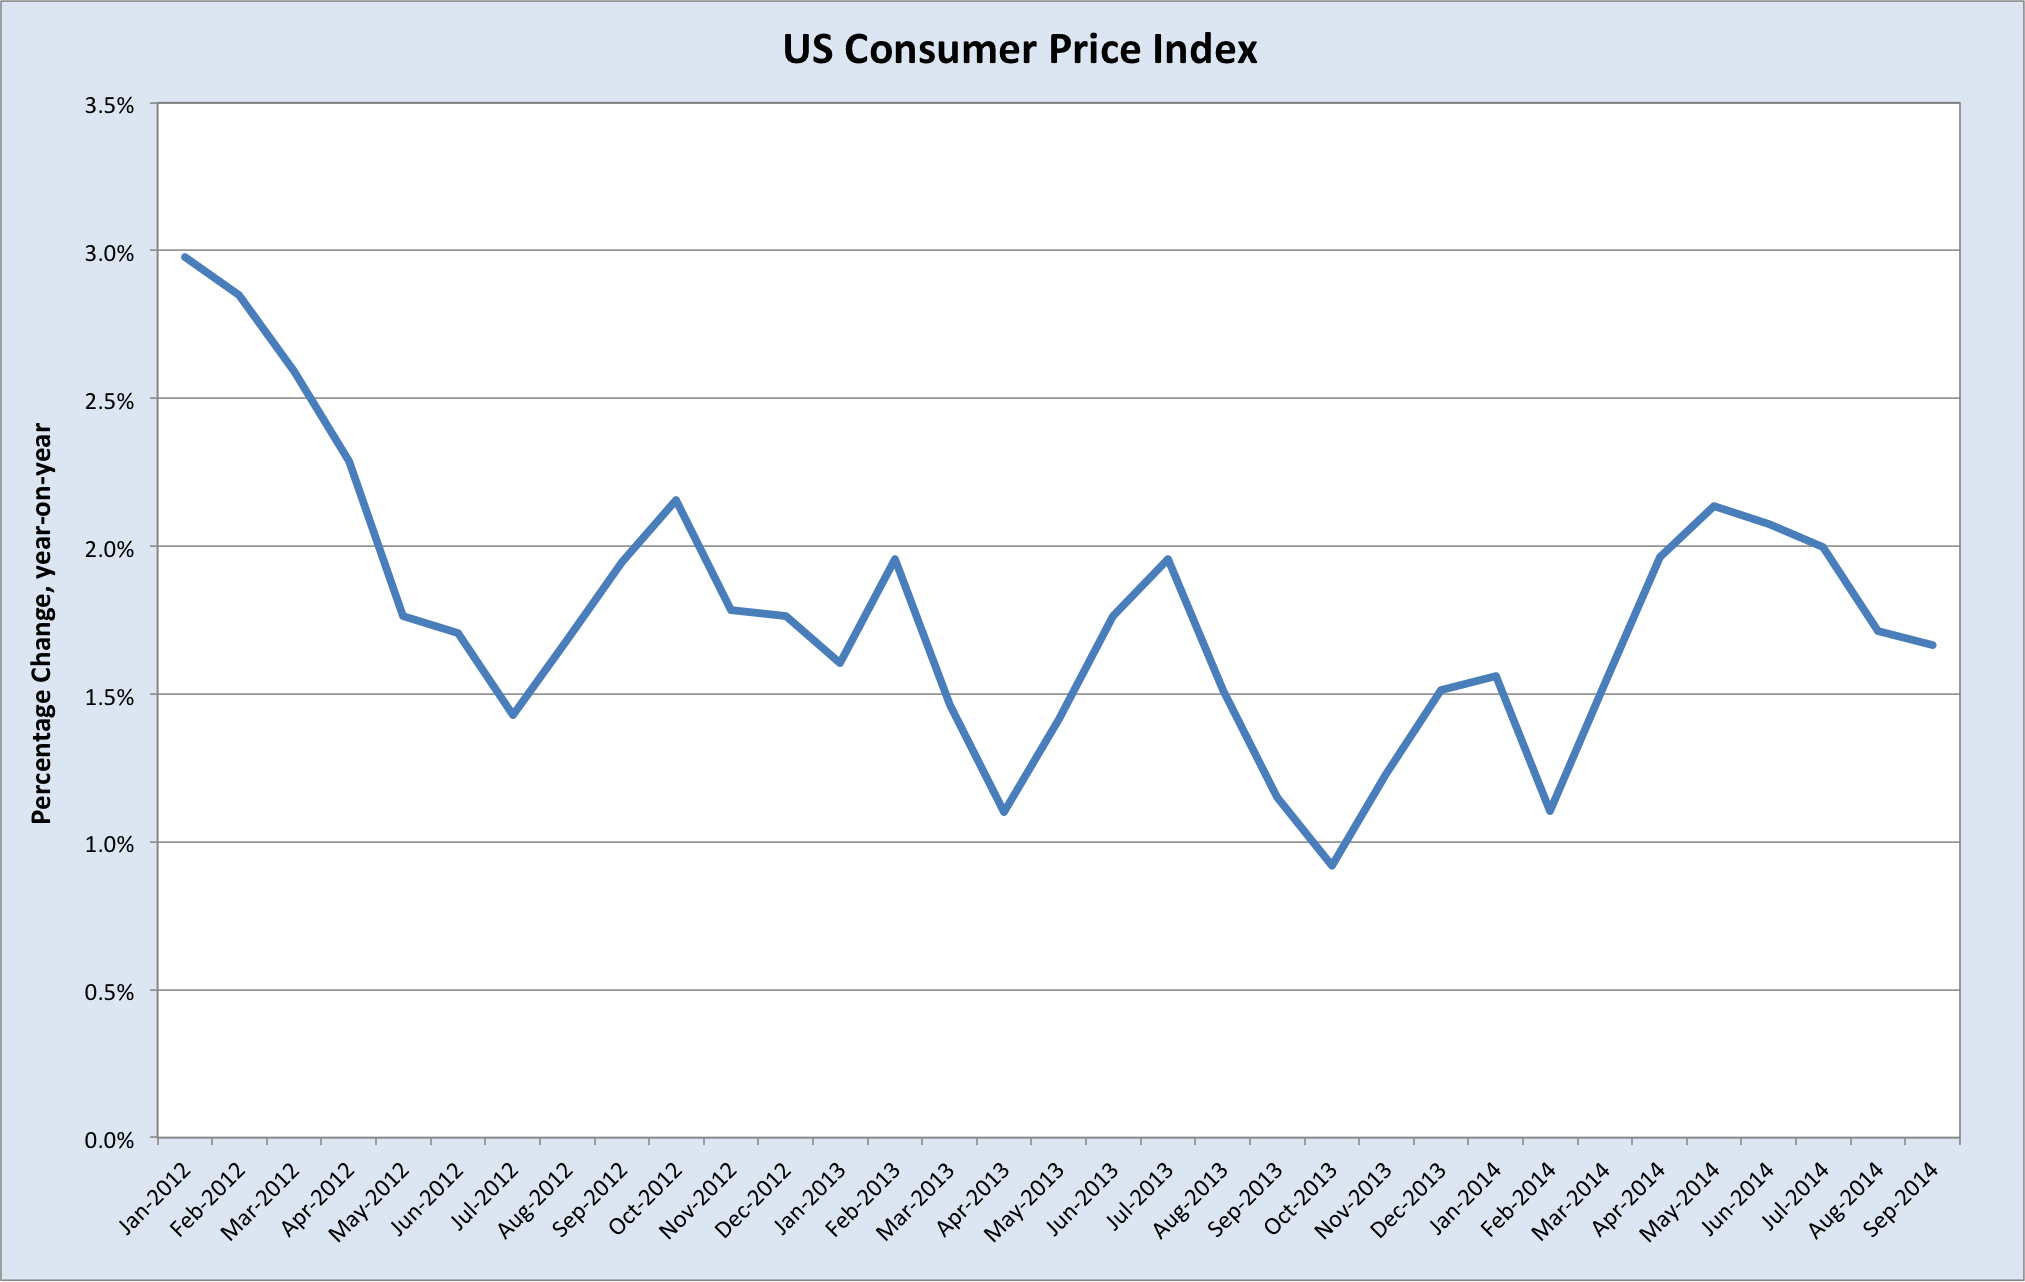
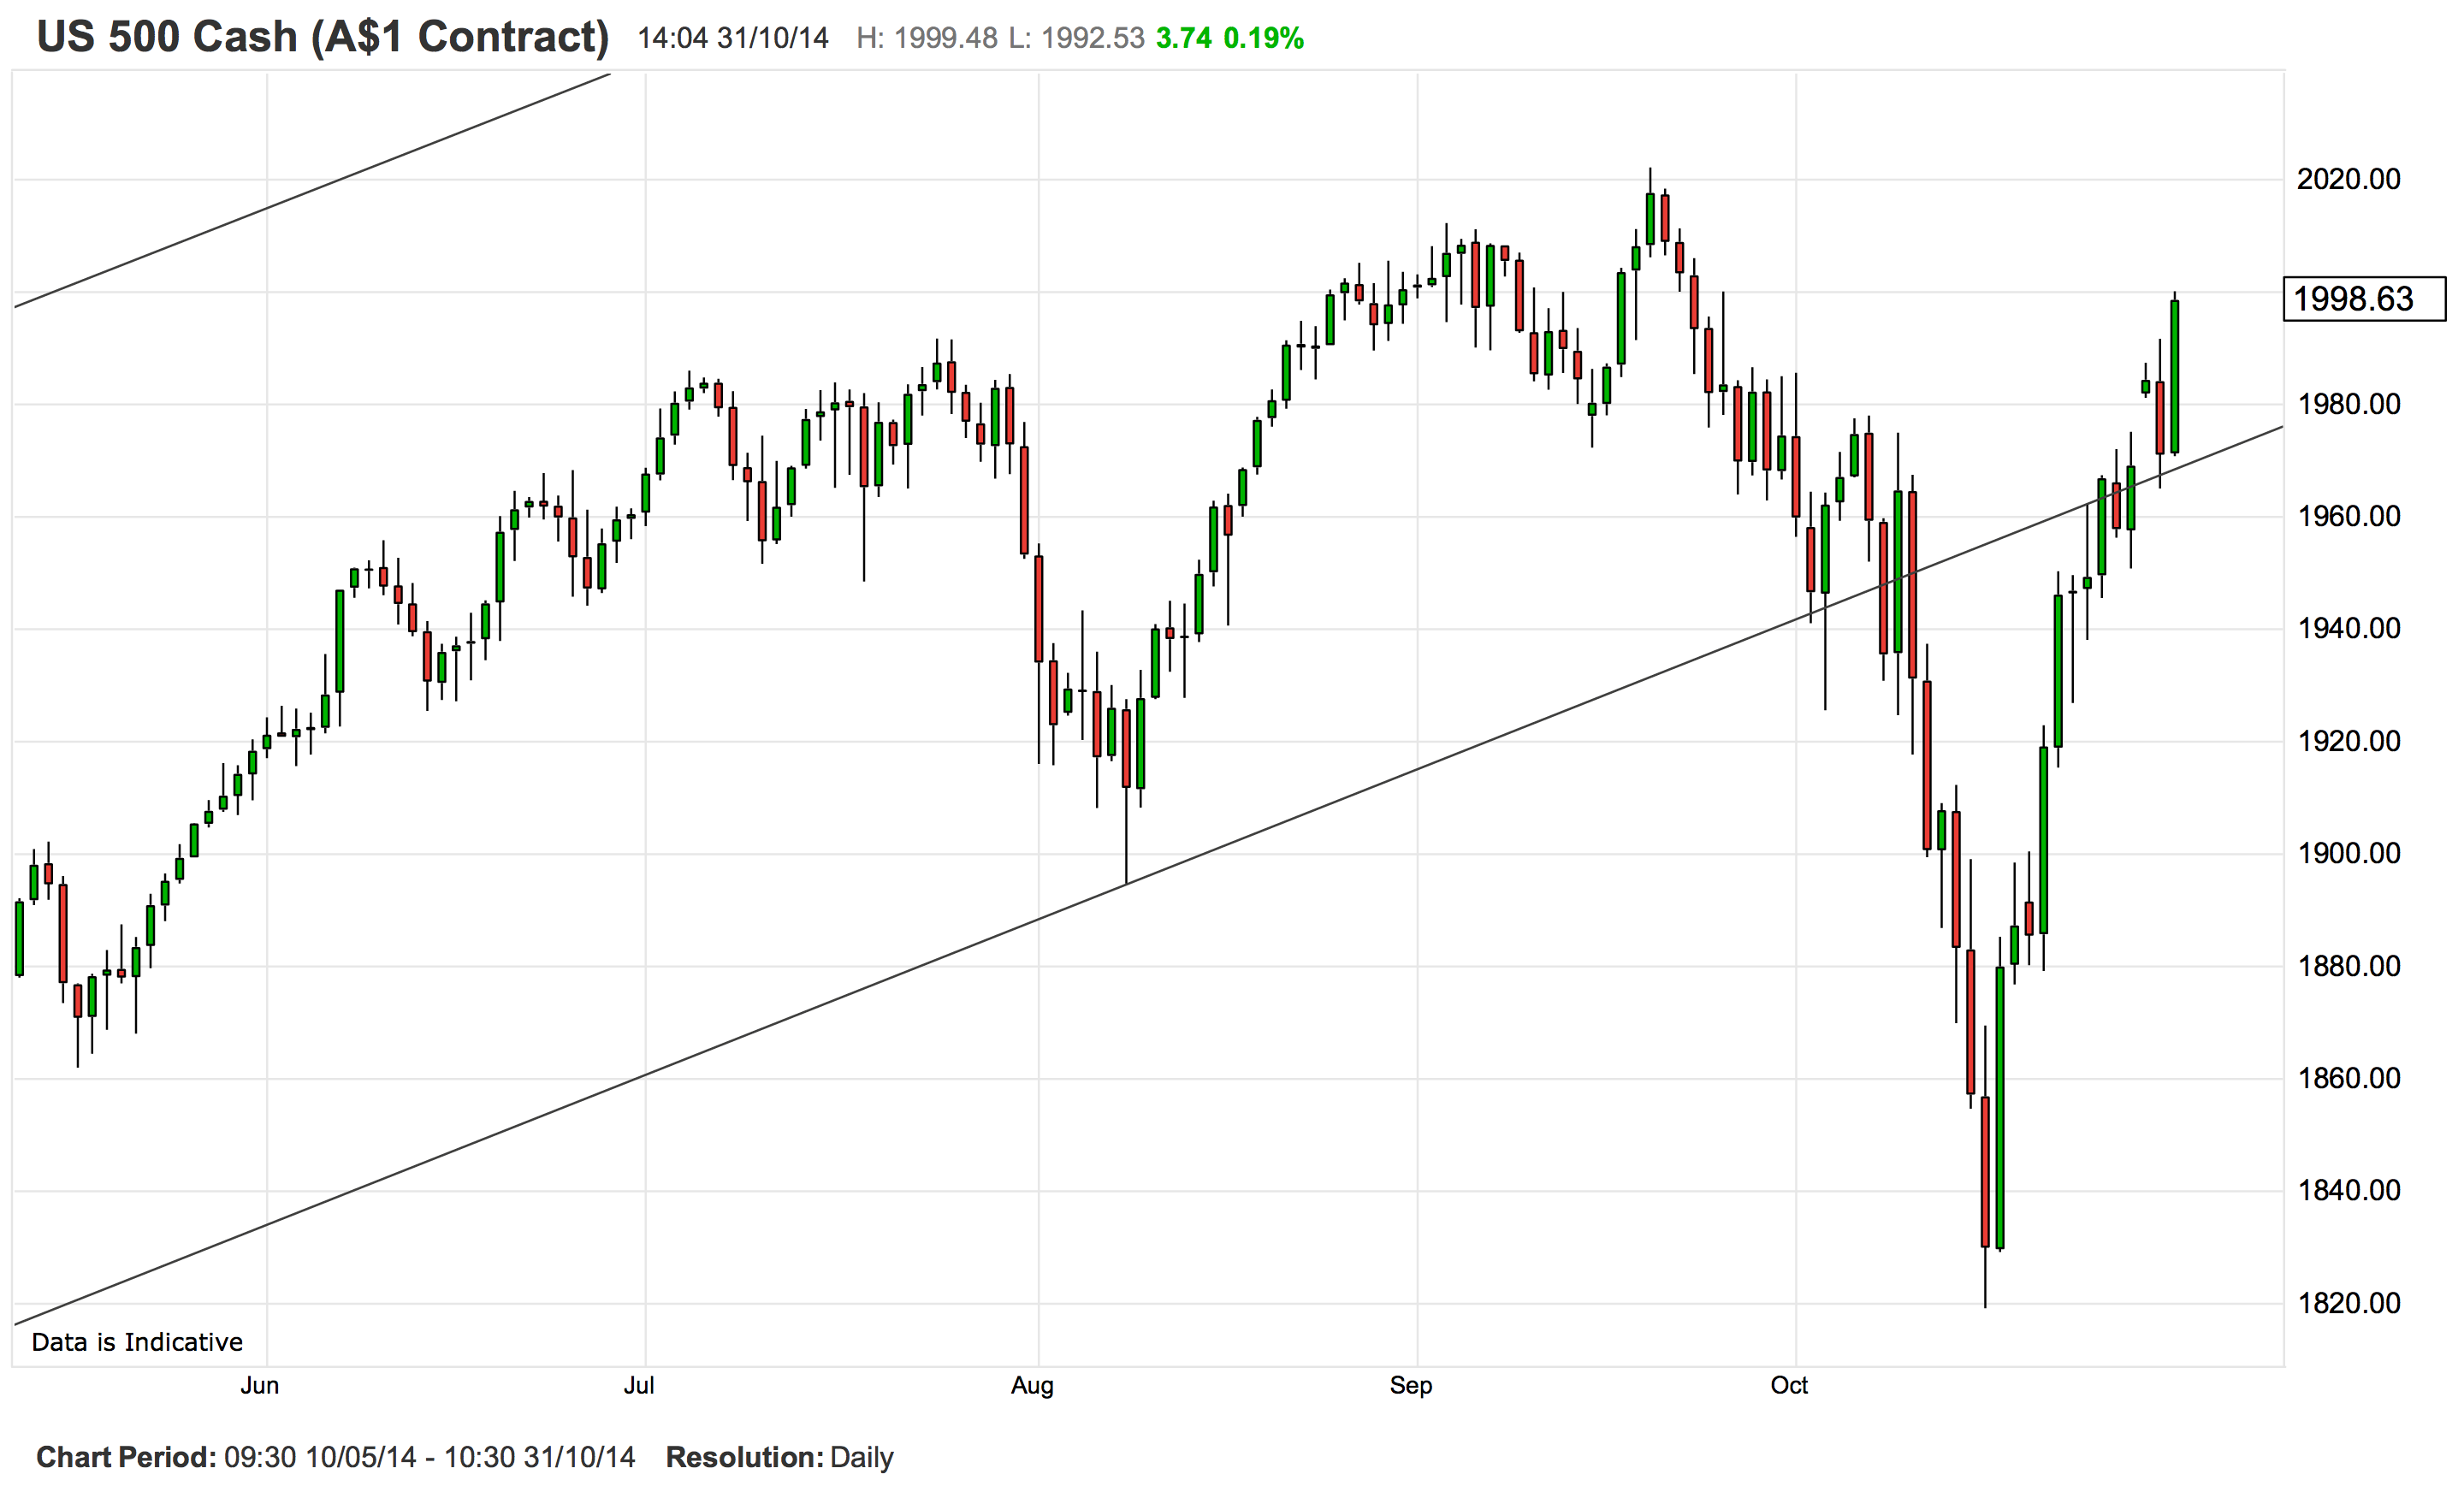
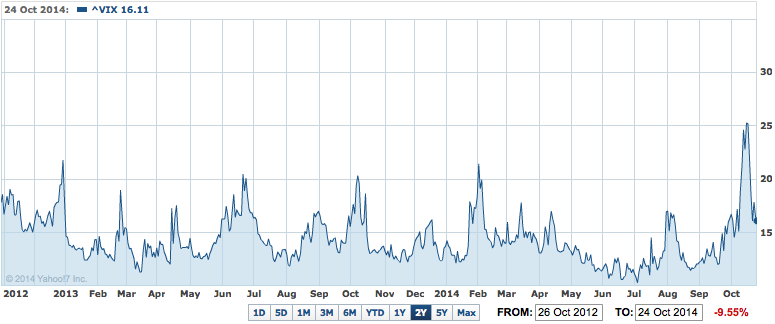
The bond market, however, has been considerably more sympathetic to his thesis.
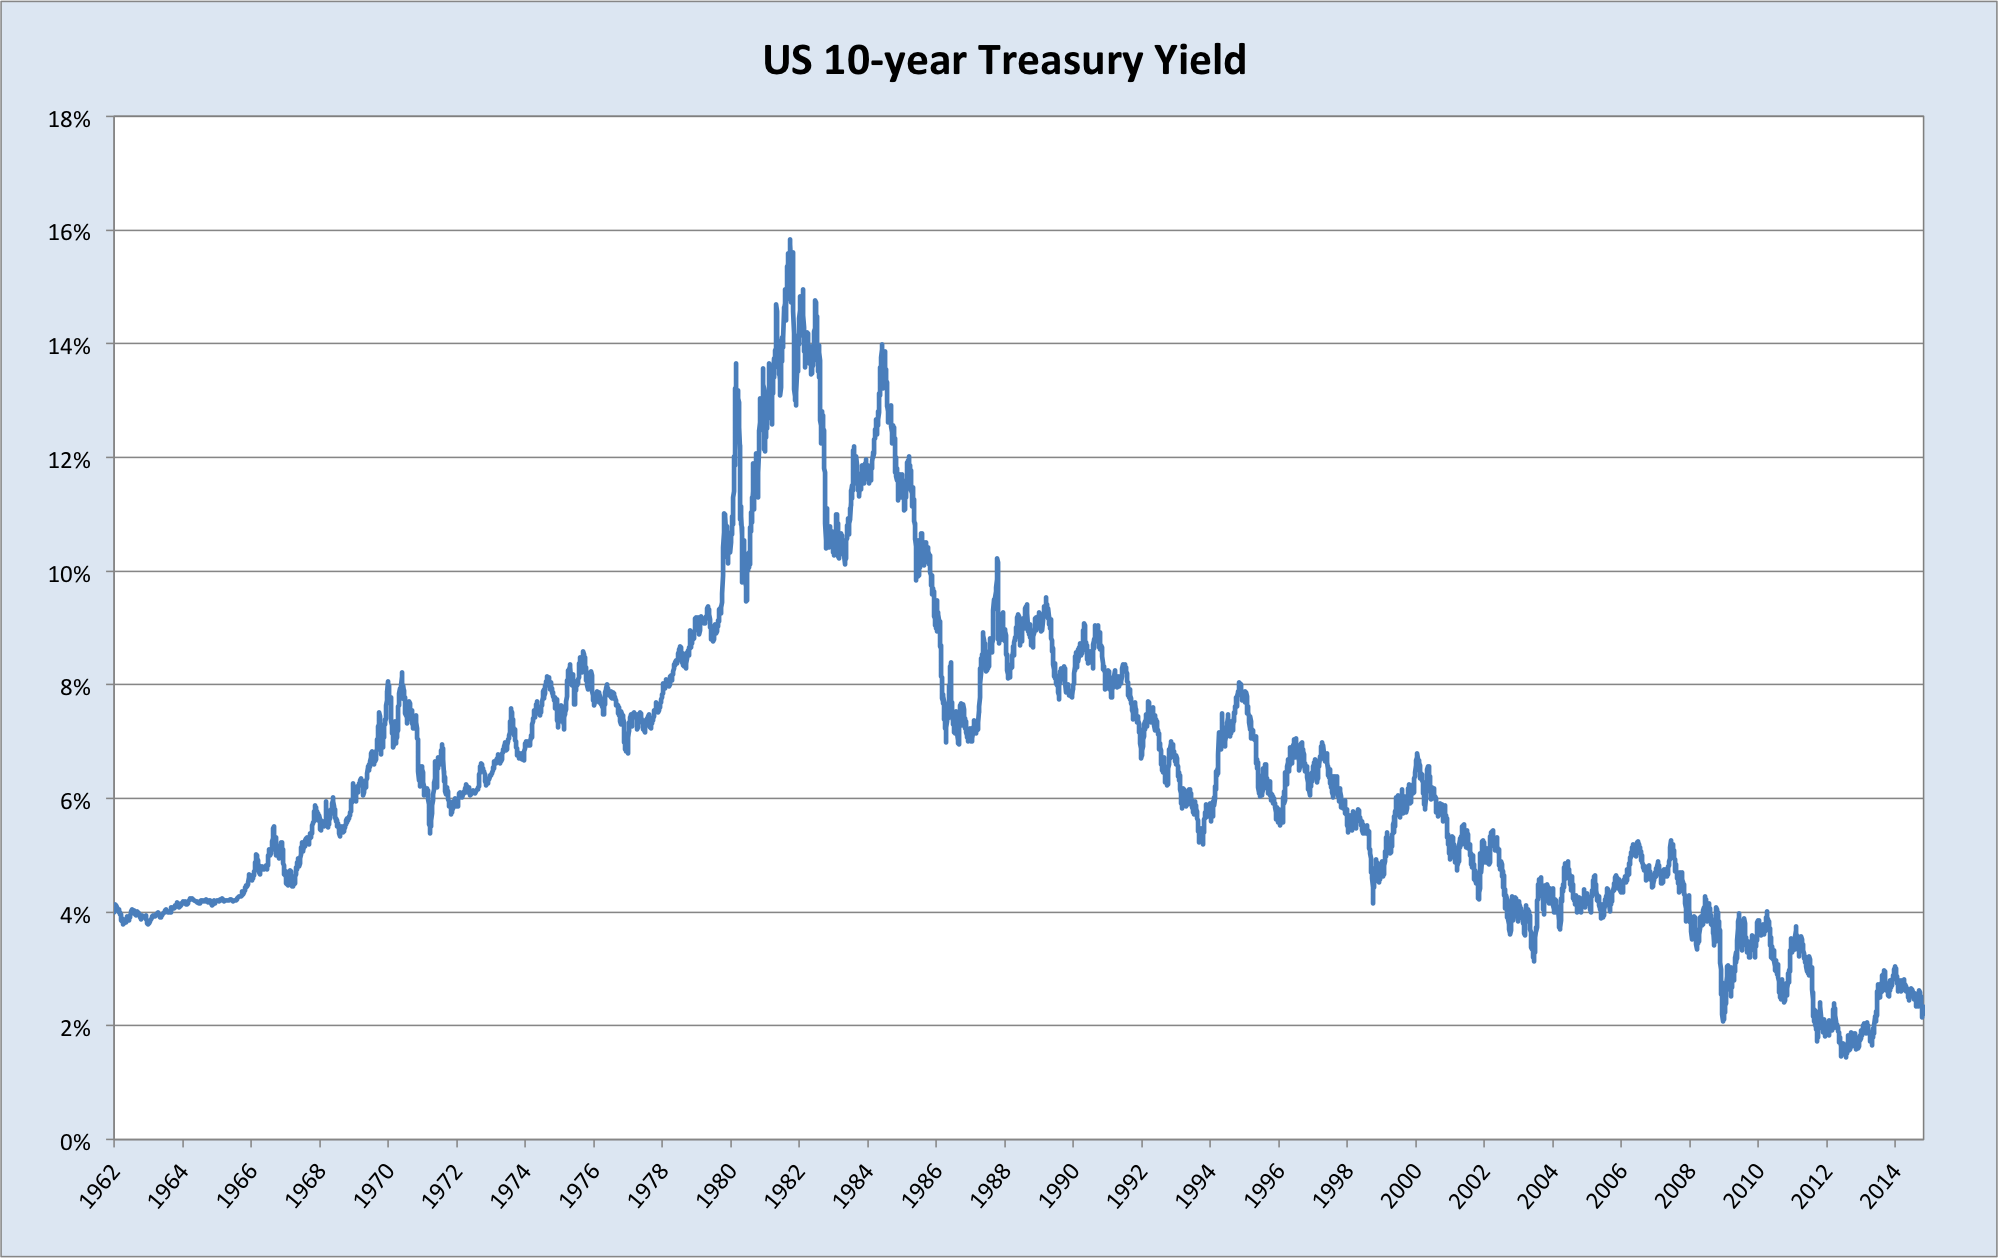
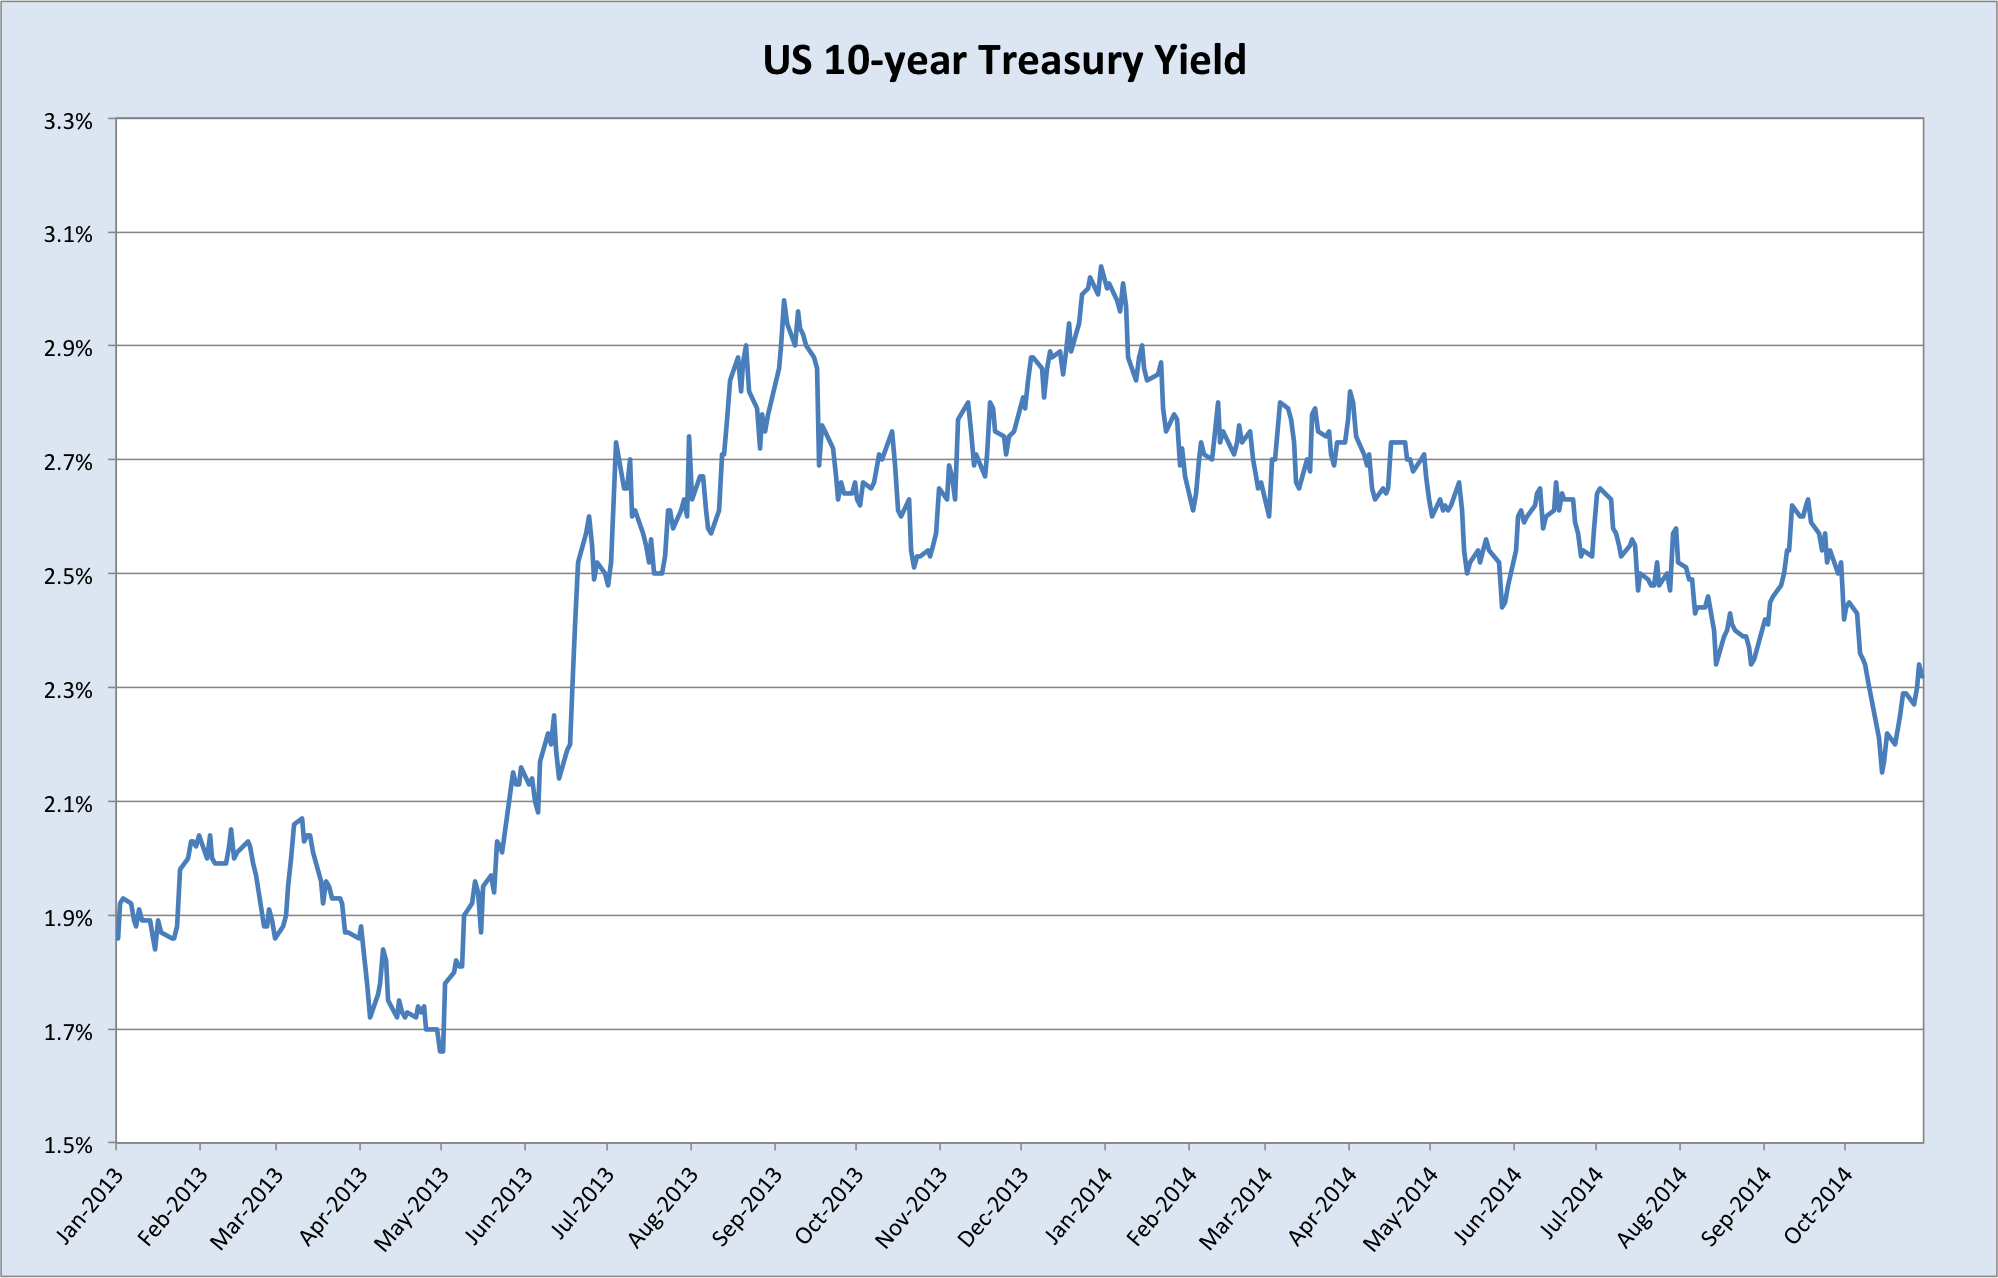
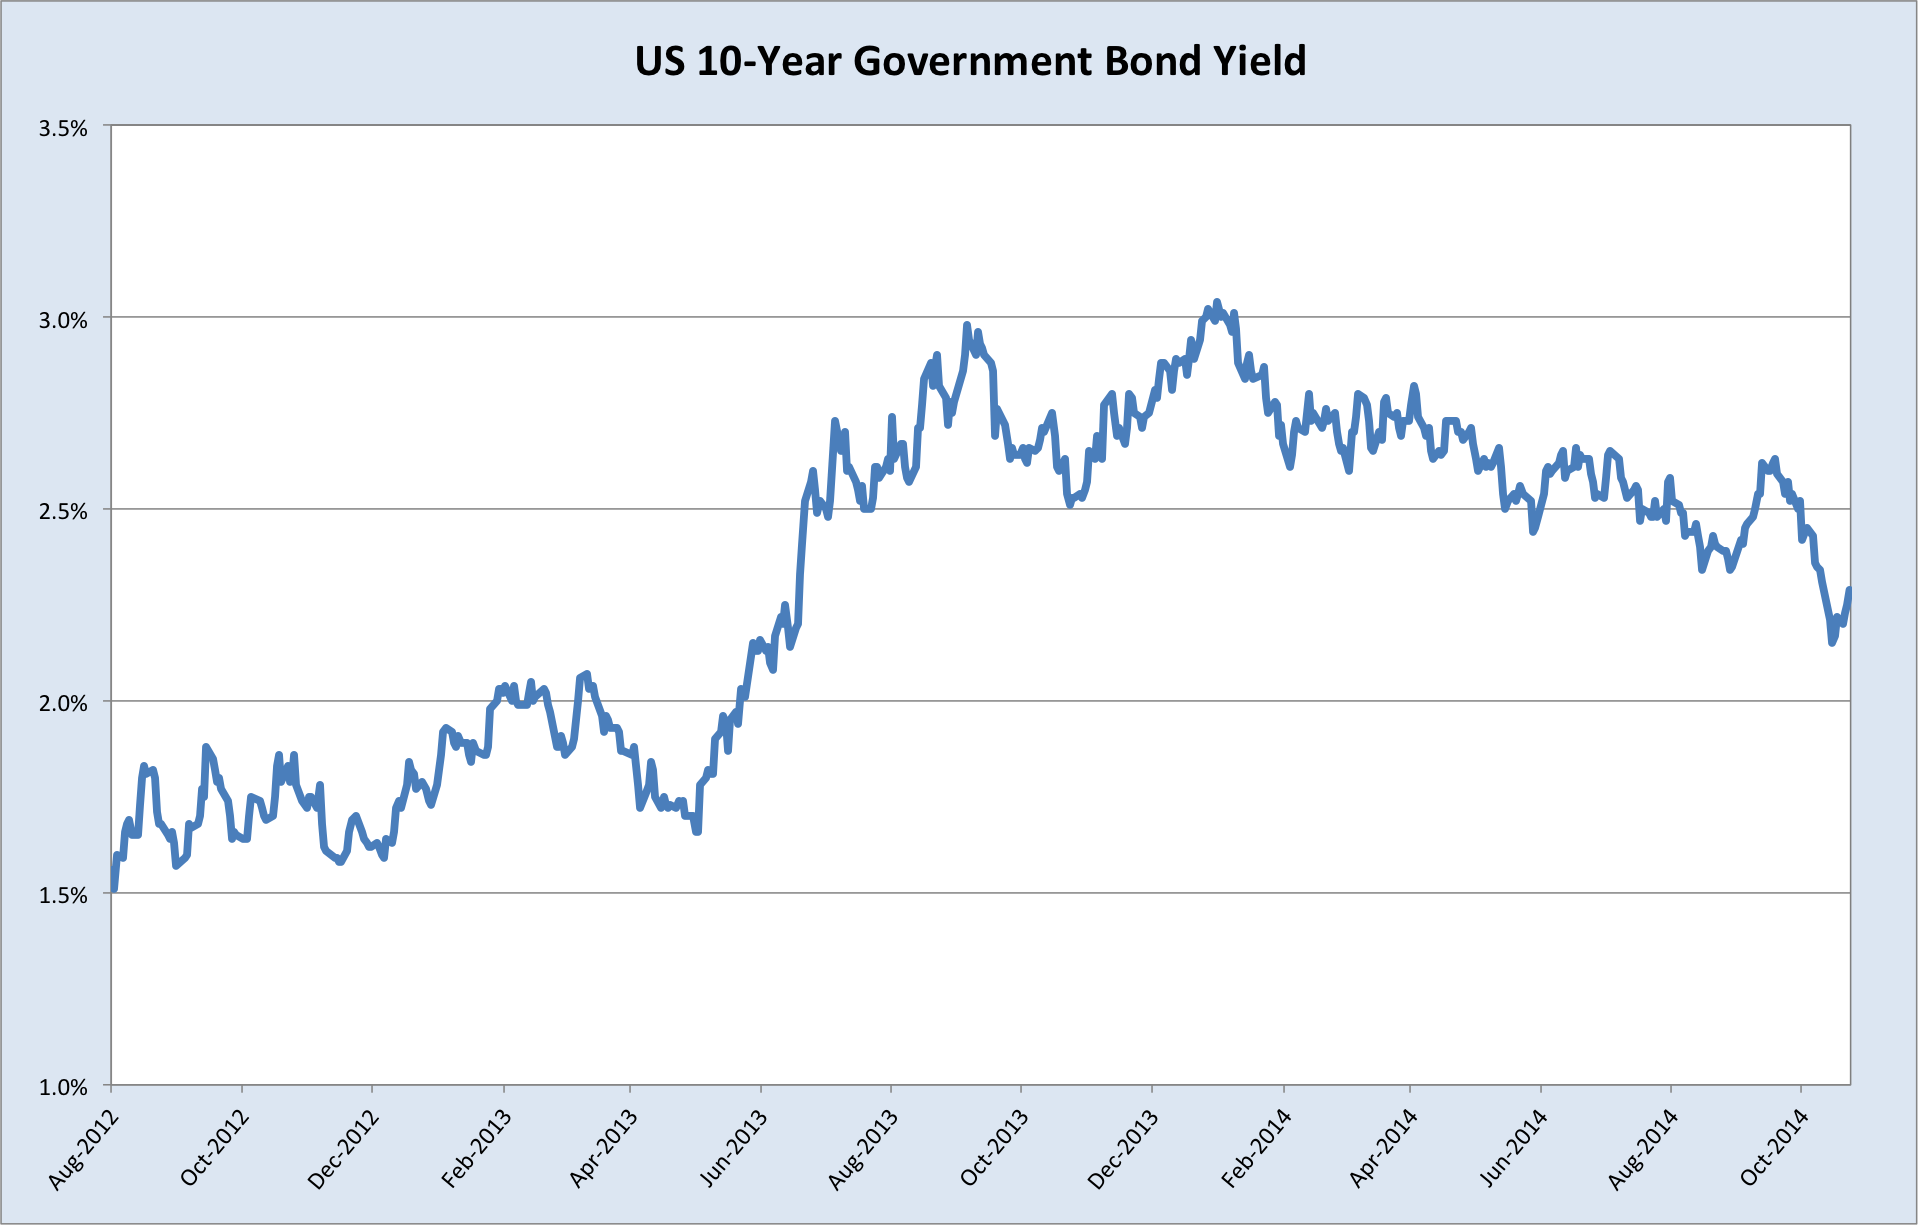
One of his key claims was that the US 10-year government bond yield would spend a long time below 2%. It spent some time below this level in 2011 and 2012 (something many would have considered impossible a decade ago), but news that the Fed was planning to ‘taper’ its QE program sent yields sharply higher in 2013. This, along with signs of growing strength in the US economy, had analysts and institutional desks calling a continuation of the bond sell-off in 2014 (rising yields). Quite the opposite has happened. In fact, as shorts stopped out en masse last month, the 10-year yield sunk briefly below 2%. (This isn’t captured on the chart below as it only plots daily closes).
Despite the conclusion of the Fed’s QE program, markets have been anticipating a passing of the baton to the European Central Bank (ECB) as it initiated its own asset purchase program. This has been highly EUR-negative, and the cycling of funds out of EUR exposure into USD has likely supported demand for US bonds. This strong demand for the USD, as the outlook for relative monetary settings began to clearly favour the greenback, has driven back inflationary pressures.
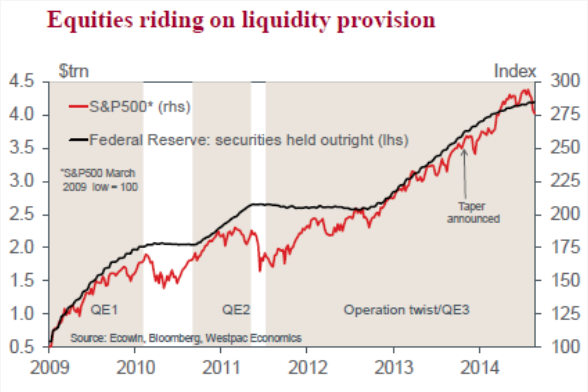
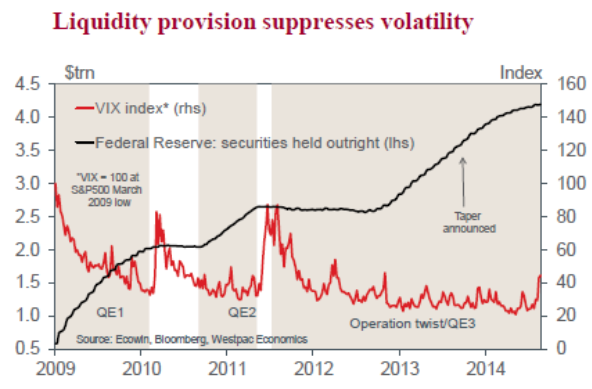
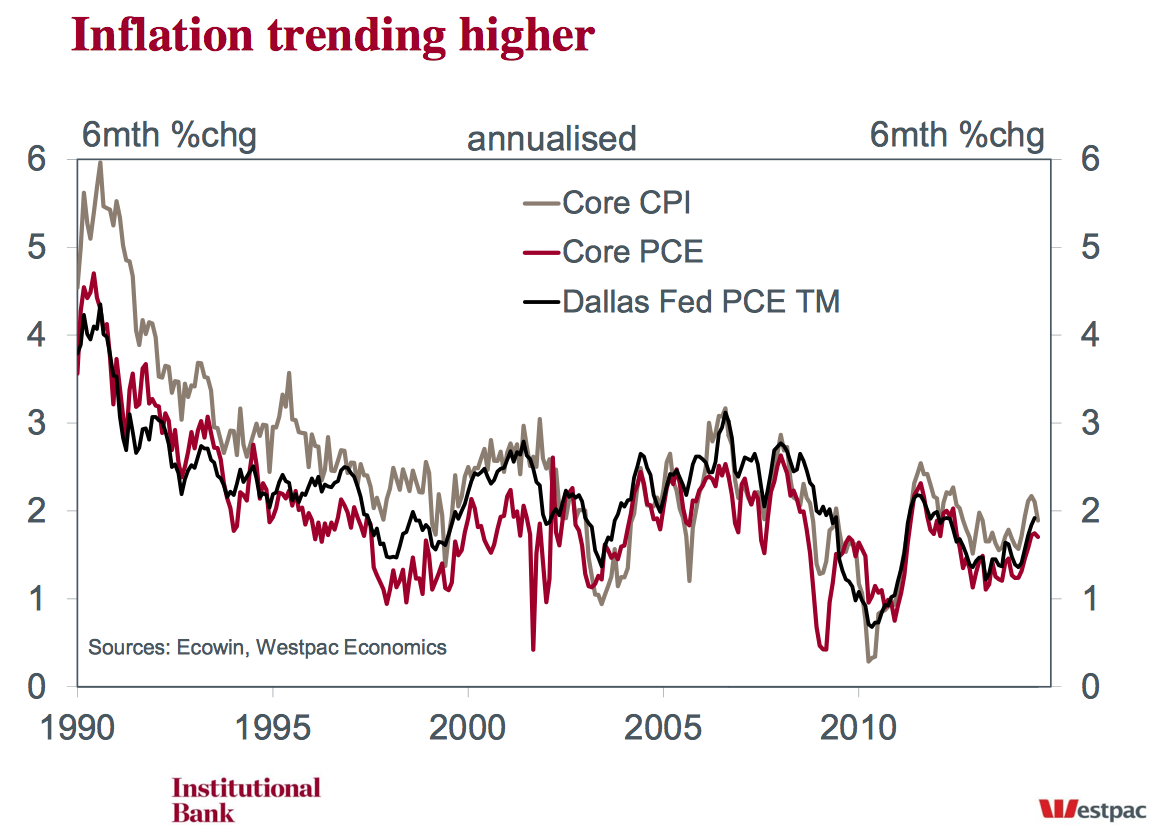
Falling inflation is uncharacteristic of an economy in an upswing, and has kept demand for bonds healthy even as equities marched higher this year. Indeed, the general absence of inflationary pressures is, to my mind, a central feature of global economy today. As I have said before, “from the US to the UK to China to Japan to Europe and even Australia, the spectre of deflation looms large over the global economy.” So although I tend to ignore Edwards’ hysterics regarding the ever-looming equities Armageddon, his Ice Age thesis, at least the deflation foundations on which it rests, is worth paying attention to.
Bank of Japan’s boreal blast

BOJ Governor Haruhiko Kuroda
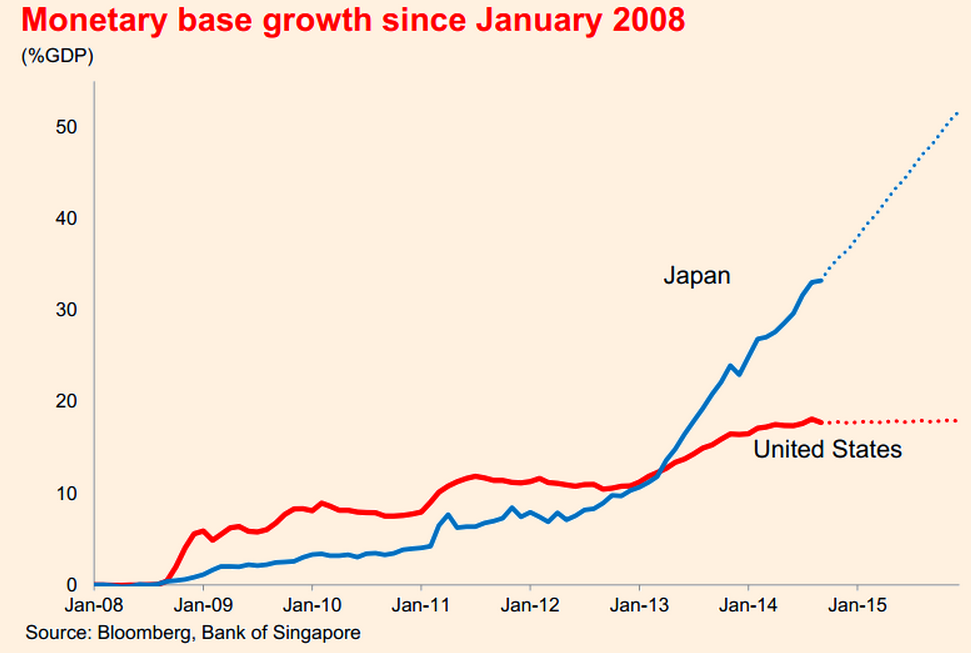
It was into this environment, of persistently low global inflation, that the BOJ dropped its QE bombshell on Friday. This chart from the Financial Times illustrates the magnitude of the monetary stimulus afoot in Japan.
The movement of foreign exchange rates, which signify the nominal value of a currency against its peers, basically maps out the relative monetary policy trajectories of the institutions that issue those currencies (central banks). When a central bank is loosening its monetary policy (or rather when markets expect that this will be the case in the future), the currency it is responsible for tends to depreciate, ceteris paribus. Conversely, when the market anticipates monetary tightening, the tendency is for the currency to appreciate. It is useful to recognize then that although currency changes hands when international trade in goods and services takes place, the ‘goods market’ has very little influence on exchange rates in the short- or medium-term, when set against the influence of the ‘capital market’. Which is to say, money changing denominations happens primarily for investing and speculative purposes. (Note: when the euro crisis was raging, currency markets oscillated primarily on a risk-on/risk-off dynamic; the EURUSD being the axis of the market’s risk temperament. After mid-2012, currency markets drifted back to a relative monetary policy dynamic.)
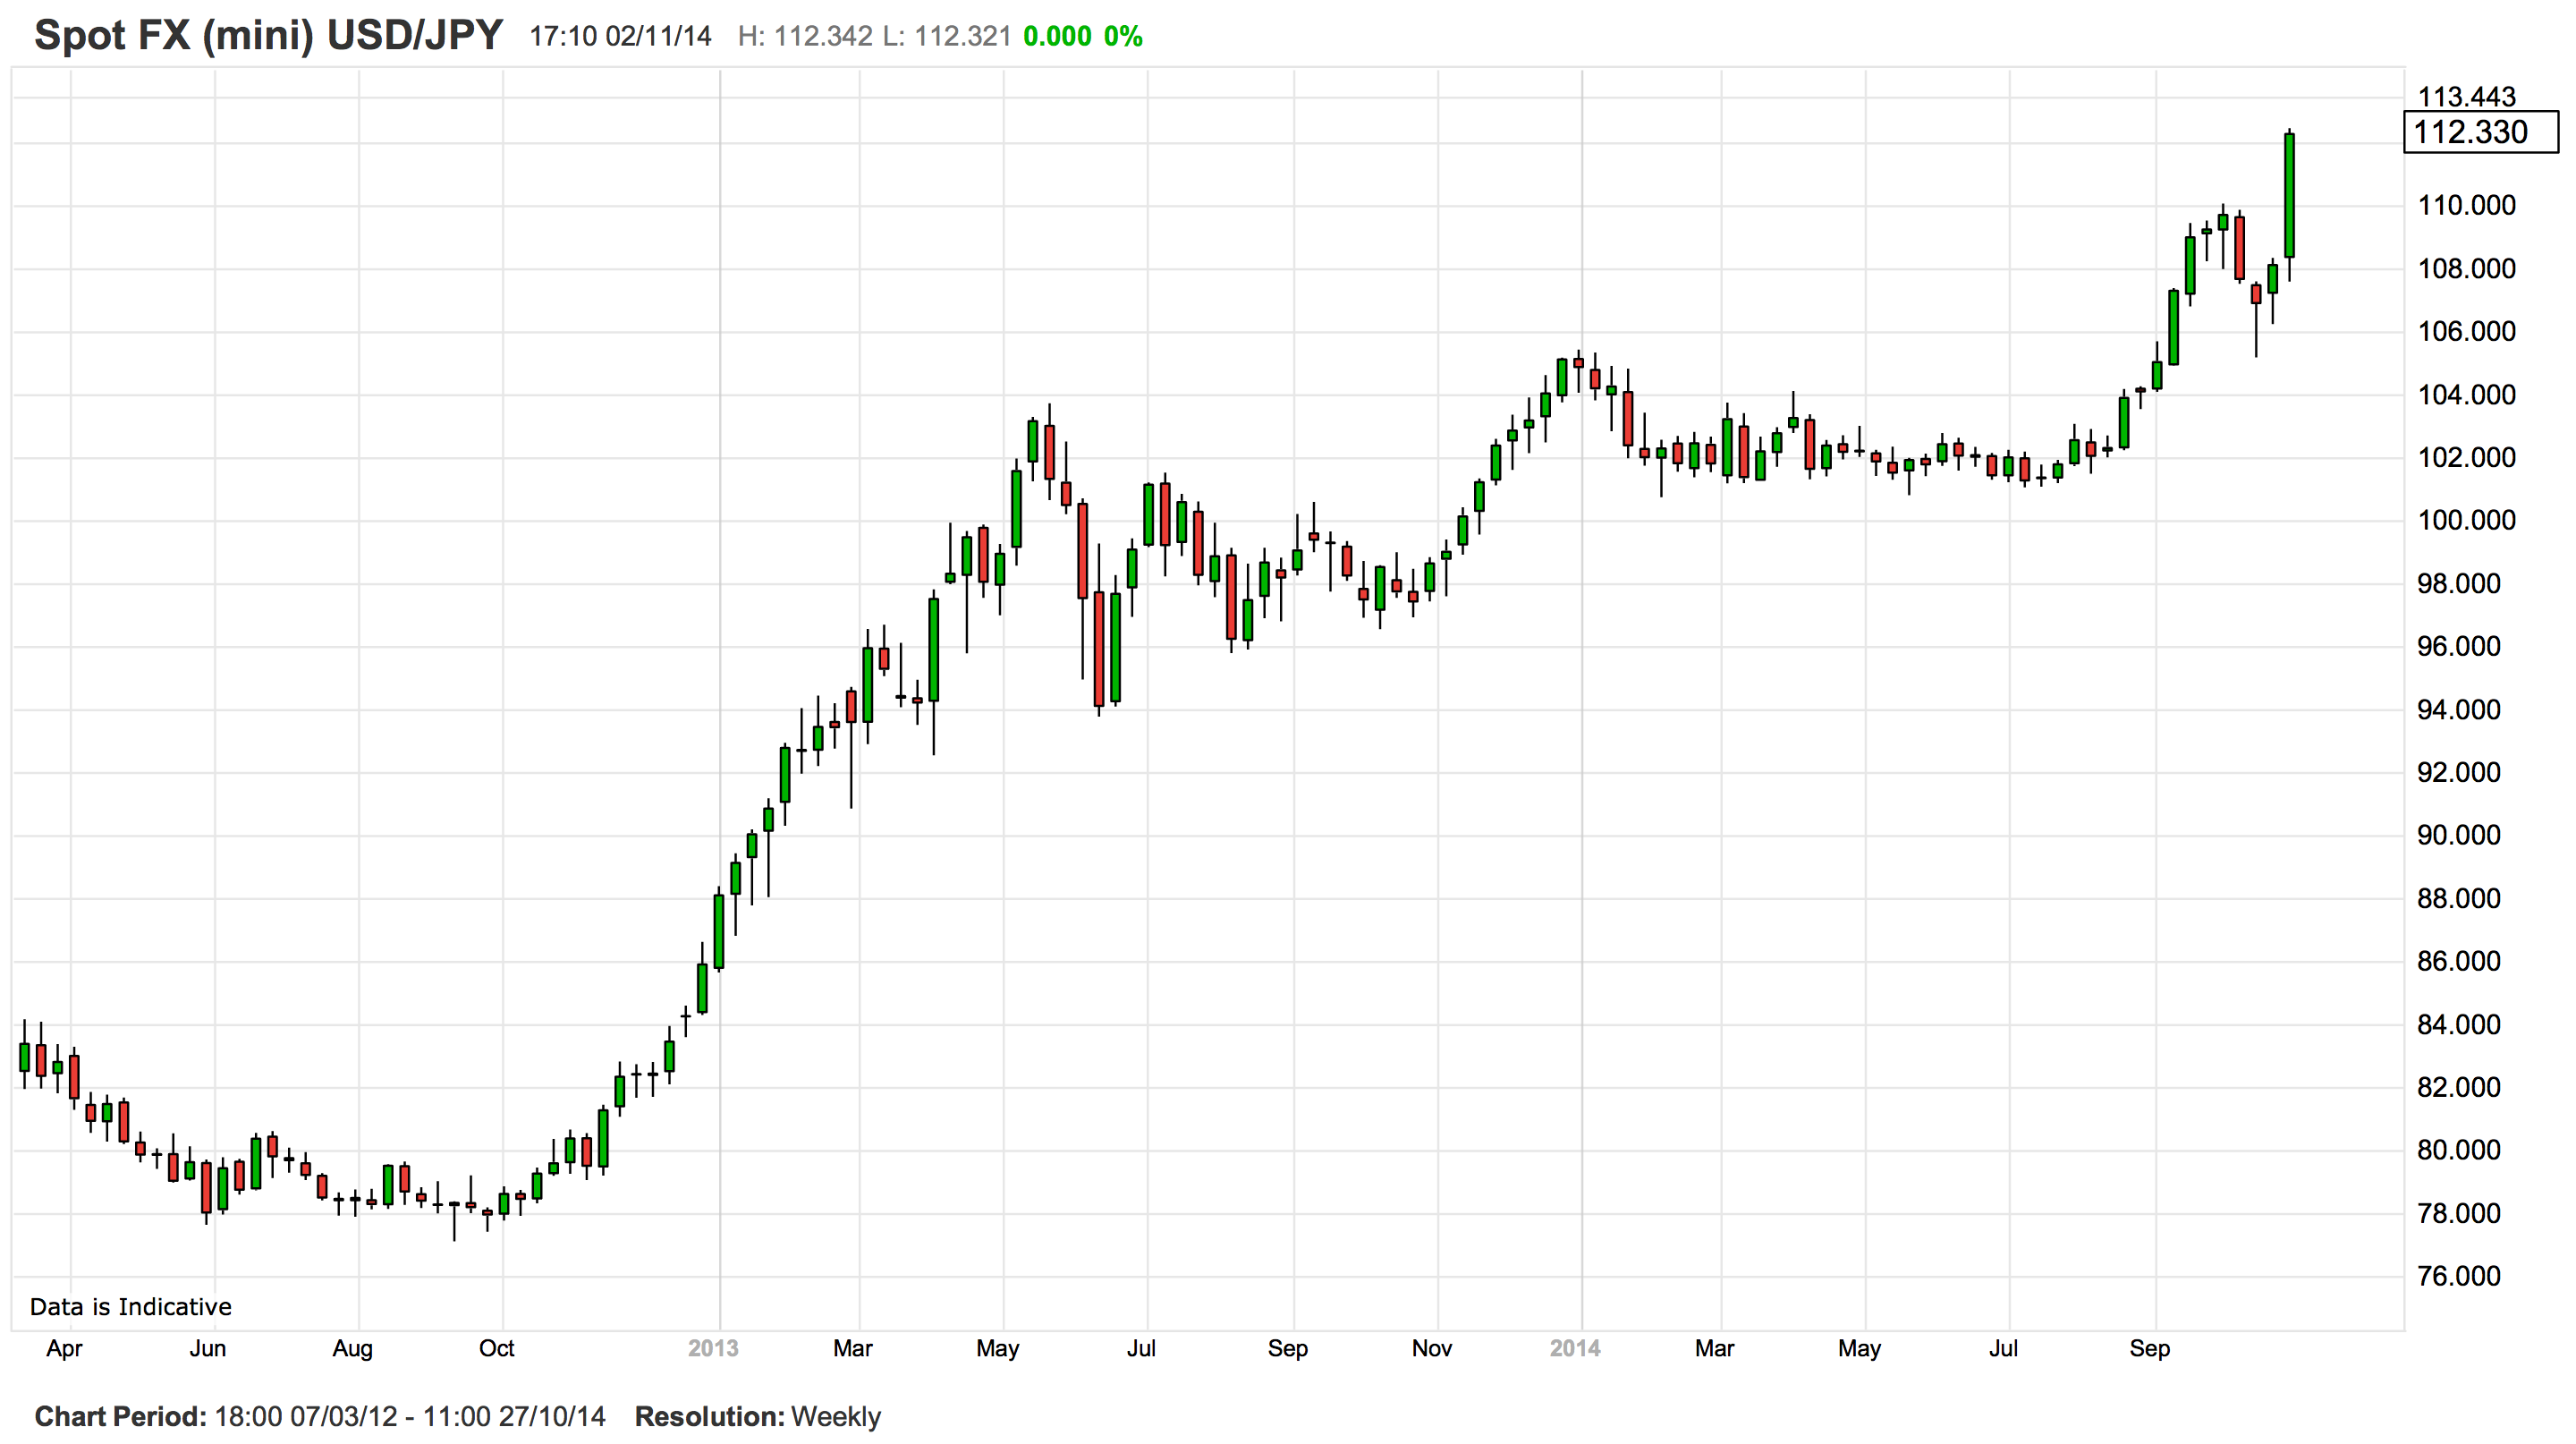
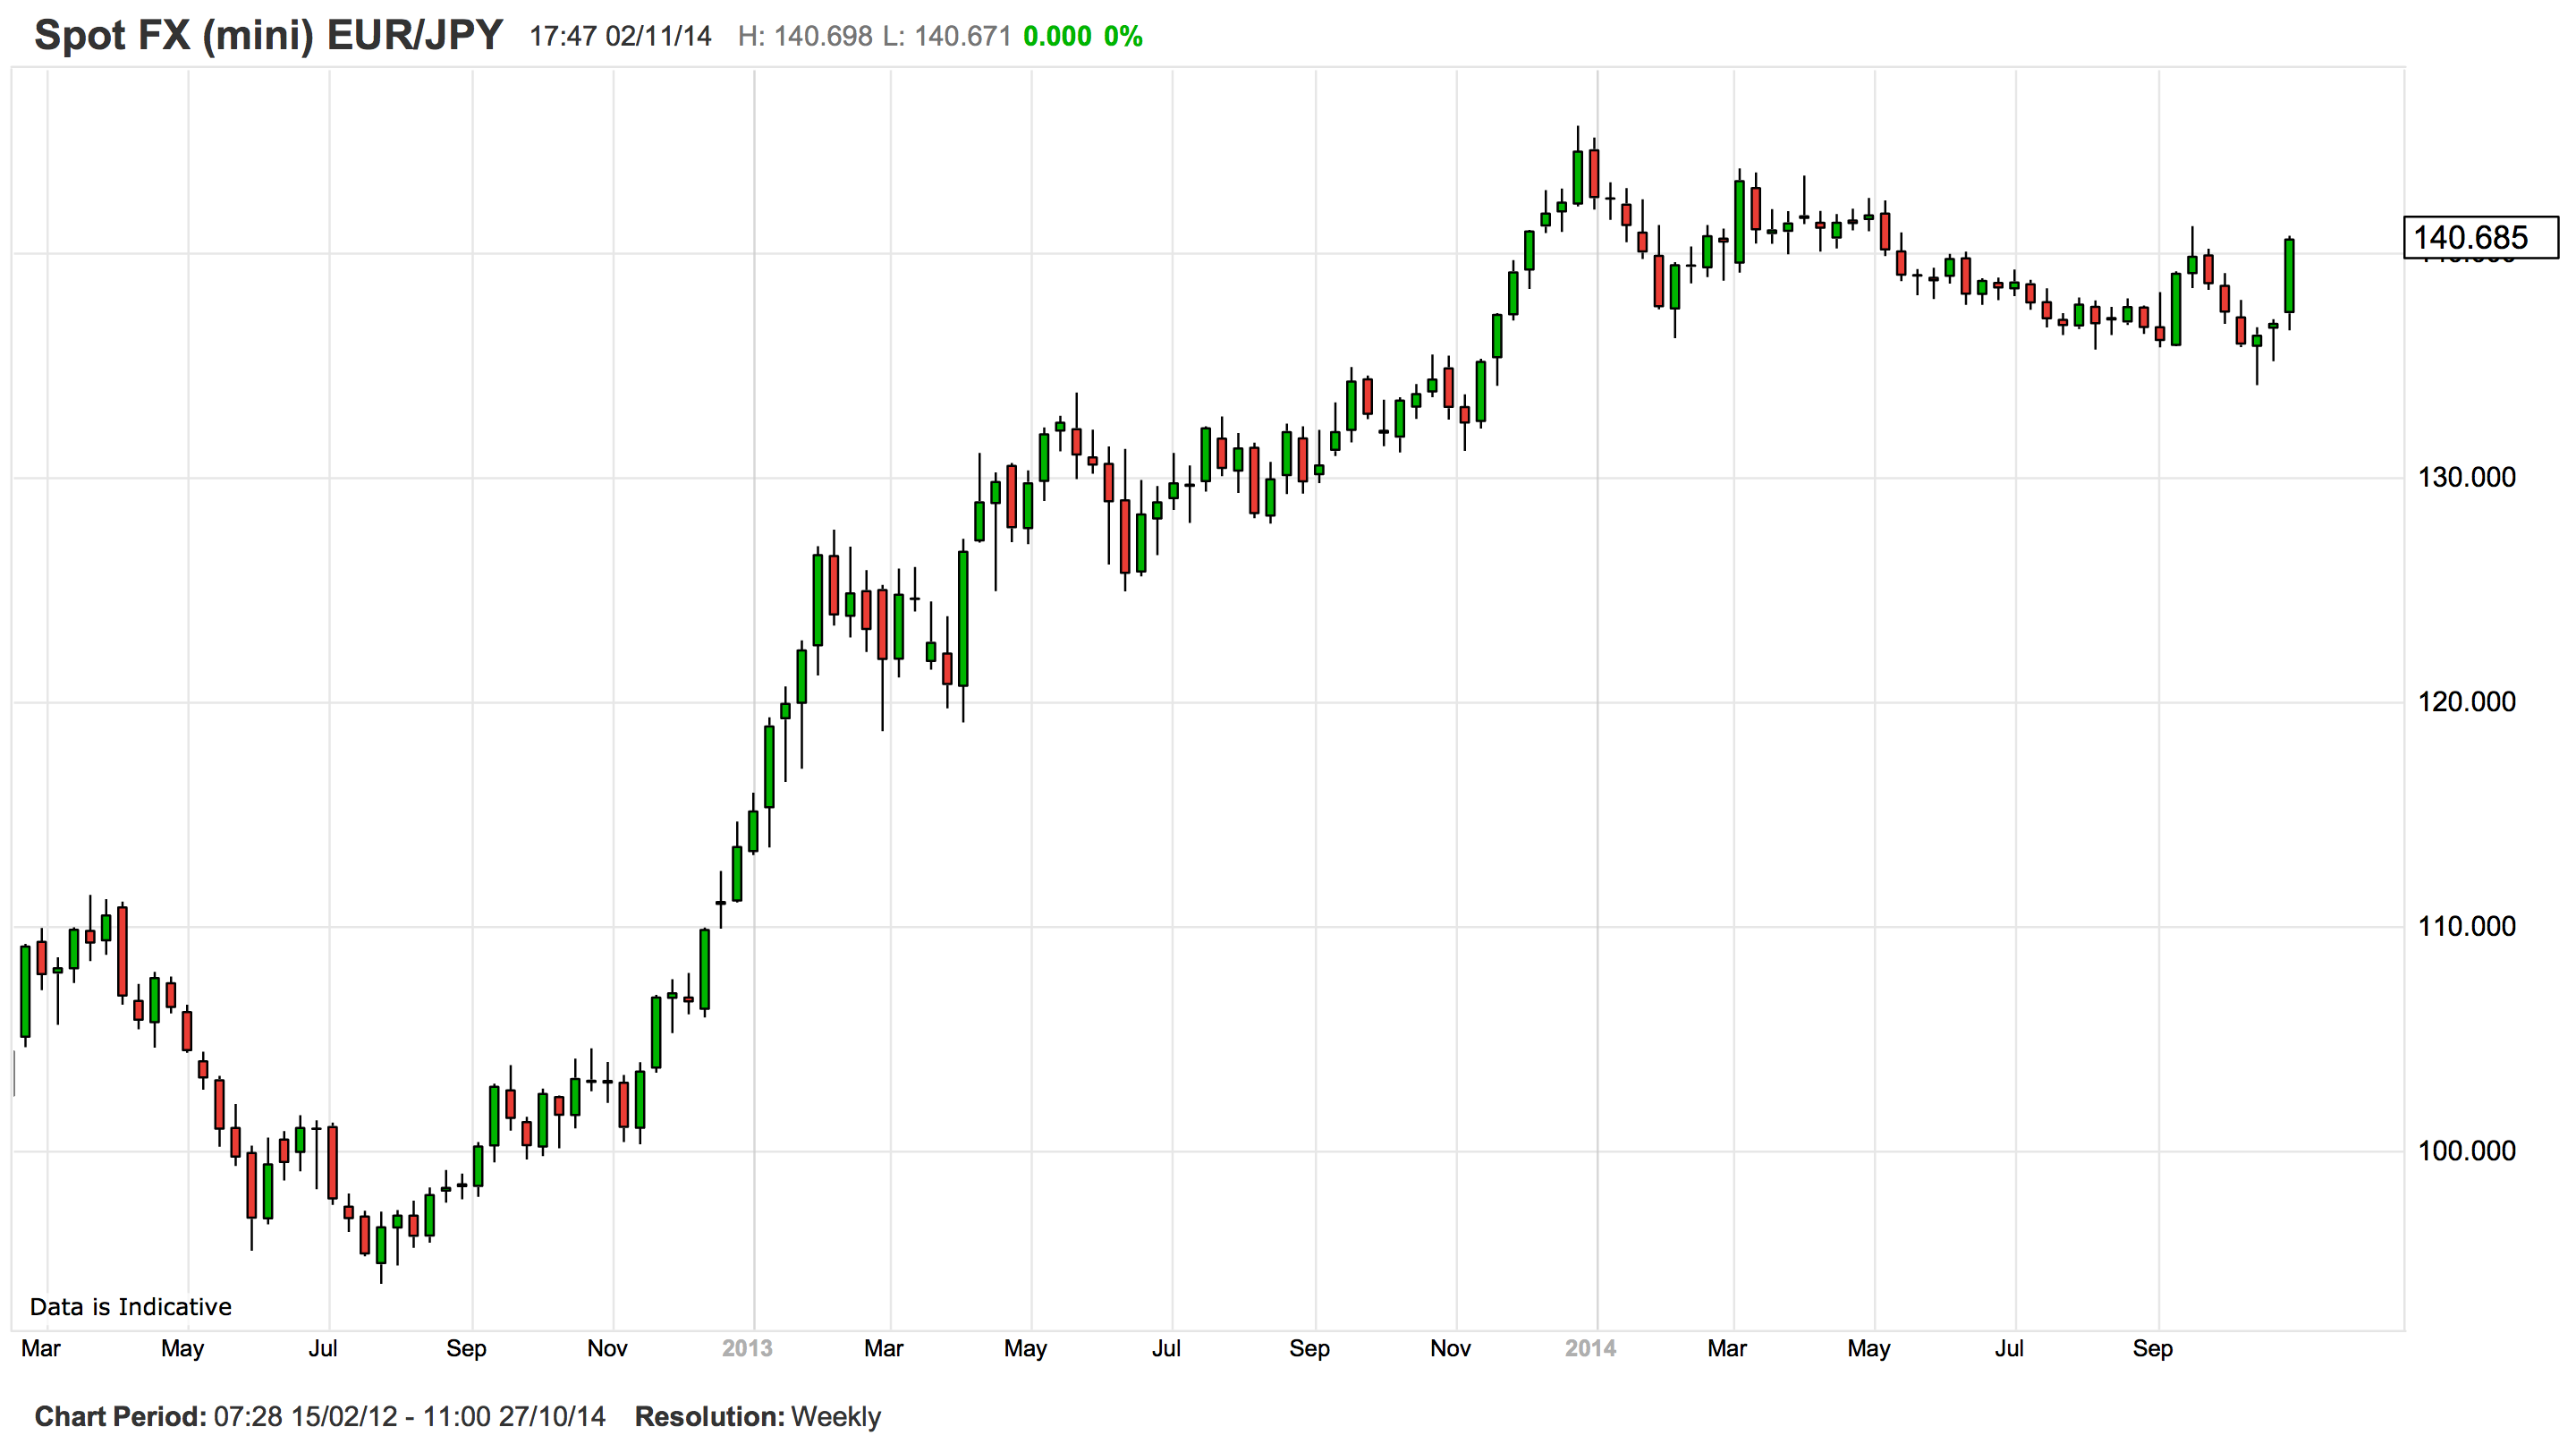
It is scarcely surprising then that the Japanese yen has undergone a massive depreciation since late 2012, when it became clear that the BOJ would embark on a radical expansion of the money base, or that the announcement of further easing on Friday sent the yen into freefall. (USDJPY rising indicates the yen is falling against the USD.)
The reason I have mentioned Albert Edwards is that back in September he received a fair amount of attention for his call on the USDJPY (from Bloomberg):
A divergence in U.S. and Japanese monetary policy — with the Fed slowing stimulus and the Bank of Japan expanding the money supply by record amounts — may have started the exchange rate moving. Now that the yen is past a tipping point, Edwards says the psychology of traders is likely to take over and turn the currency into a runaway train.
“Now we’re heading to 120, which is the 30-year support,” he said. “You break through that, and you can see it moving to 140, 150 very, very quickly indeed.”
Edwards found the yen’s price graph so compelling, he devoted an entire client note to it last week. He called it: “Presenting the most important chart for investors.”
I shared his view towards the yen wholeheartedly, although I certainly wasn’t expecting the BOJ to move this early on further stimulus, nor, consequently, that the yen would move so fast so soon (and remember that it was only by a 5-4 majority that the BOJ decided to increase its QE program on Friday).
So, with the USDJPY now on track to breach 120 within the next 6 months or so, we best reflect on some of the possible implications of this move, remembering, as always, what Aristotle may or may not have said: It is the mark of an educated mind to be able to entertain a thought without accepting it.
Currency chills
A currency devaluation is akin to a tax on domestic consumption and a subsidy for domestic production. When the currency falls, it reduces the purchasing power of domestic households. This tends to cause fall in demand for imported goods, which are now more expensive relative to local goods, and an increase in demand for locally-produced goods. Total consumption tends to decline as the wealth effect dominates the substitution effect. On the production side, firms can now lower the foreign currency price they charge for their exported goods, since a lower foreign-currency price can provide them with the same revenue in domestic-currency terms. Straight away, therefore, we can see that this tendency to reduce consumption and increase production is inherently disinflationary for trading partners. The bigger the economy is, the greater the international impact of the devaluation.
(Of course, the BOJ is easing because it is trying to increase inflation in Japan. A currency devaluation raises the prices of imported goods, and it is hoped that this contributes to sustained gains in domestic prices, especially wages, and in so doing negates the need for perpetual currency depreciation. Whether this domestic goal is met is uncertain; the export of disinflationary pressures as a side-effect is not.)
Currently Japan is the third largest economy in the world. A big depreciation in the yen will therefore have important global consequences, and indeed these are likely to be playing out already.
Glacial creep
China undertook a significant currency intervention earlier this year, which has no doubt contributed to the rise in net exports in recent national accounts data.
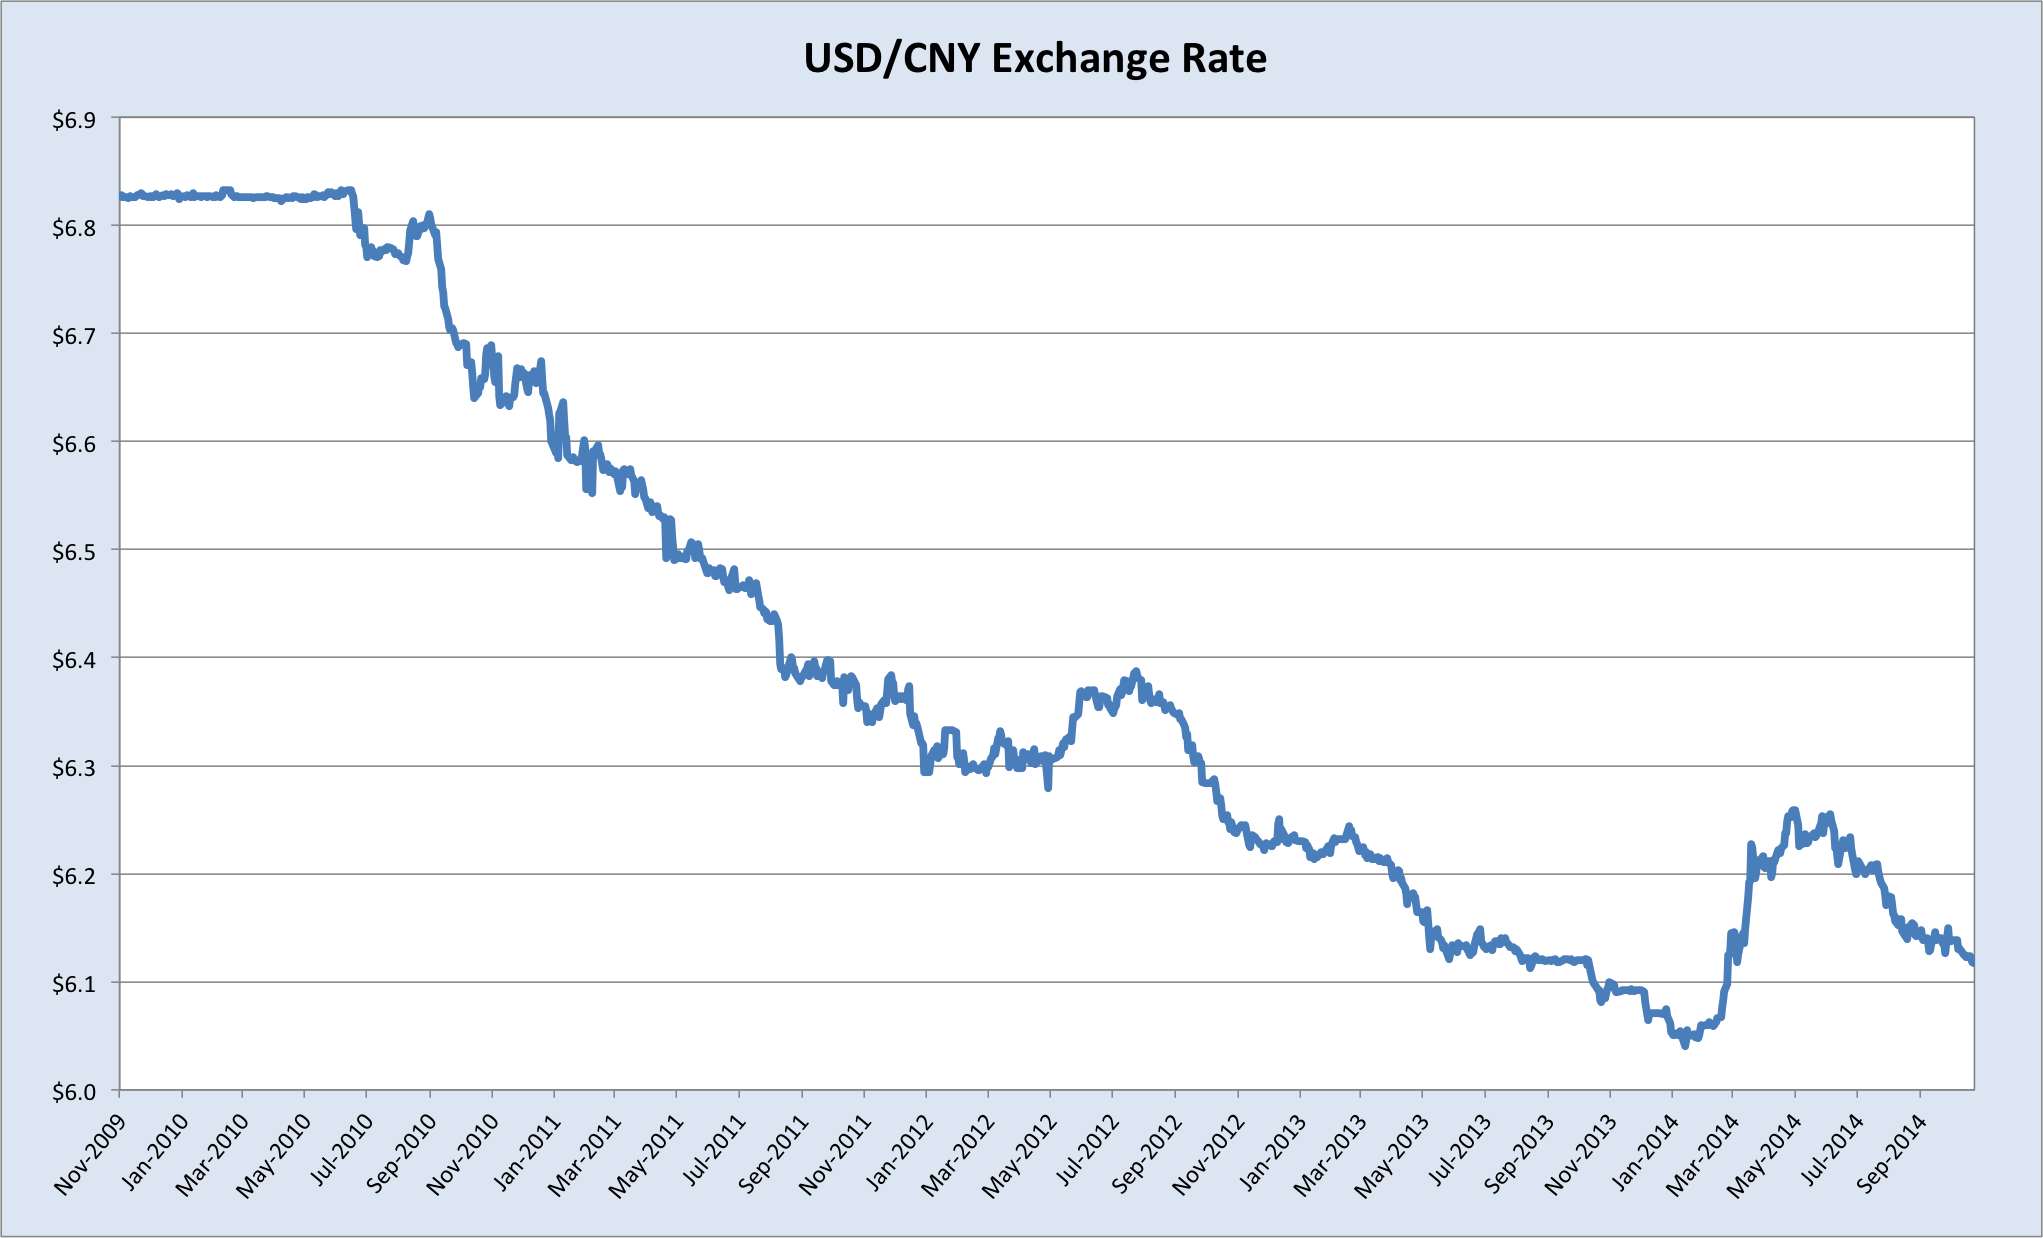
This fall has been partially retraced in recent months, despite pronounced USD strength, as the People’s Bank allowed its foreign reserves to decline. Recent moves in the USDJPY, and the likelihood that it will devalue to 120 in fairly short order, therefore represent a jump in China’s real exchange rate. By and large, China still produces lower value-add products for export than Japan, for instance fully assembled automobiles and vehicle components remain Japan’s largest exports by a long way, whereas China exports few fully assembled cars (though it has developed a stronger presence in vehicle components). Nevertheless, China has been rapidly closing the gap in this regard, and therefore Japan’s currency devaluation will make it more difficult for China to compete in those higher value-add industries which Japan currently enjoys a lead.
Moreover, Japan is China’s third largest export destination (8.3% of total), and China’s largest source of imports (10%), so the sharp depreciation of the yen against the renminbi will place substantial pressure on China’s competitiveness with a very significant trade partner. This will add to what are already difficult times in China’s economy, and if it’s not offset by stronger credit growth and a rebound in property (and there are tentative signs of both) then the PBOC may well judge it necessary to place further weight on the renminbi. Any depreciation in the renminbi would amplify China’s exporting of deflationary impulses, which has arisen from domestic overcapacity. We should therefore keep a close eye on Chinese factory data, and remain alert to any signs of a policy shifts.
There has been some improvement at the margins in Europe over the past year, with Spanish unemployment falling to 24.4% from high of 26.3% early last year. Clearly, this is still a monstrously high figure, and celebrating the fall requires a certain sadistic sense of humour. And sadly, more important than any signs of life in the periphery this year has been the weakening of the core, namely Germany. There is a risk that the Q3 national accounts will show Germany in a technical recession, and inflation has been falling (as it has across Europe). Similar to Japan, Germany’s export engine is heavily skewed towards cars and vehicle components.
Japan’s assault on the yen therefore represents a stiff challenge to Germany, whose economy has been consciously engineered to be hugely reliant on export competitiveness. So far this year the EURJPY has been largely flat, as the EUR sold off heavily in anticipation of ECB easing.
Now that the yen is getting hammered, a bold monetary response from the ECB is assuredly required to prevent further deterioration in Europe. Whether we get this in the near-term is debatable; there is still staunch opposition to large-scale quantitative easing from Germany. We’ll have to wait and see if Japan’s devaluation forces a capitulation from the Teutonic hawks. If the ECB stops short of a significant easing program, there is ample room for a EUR rally, which has hit the single currency area hard. Conversely, if they do deliver, it will provide yet more support for the rampaging USD rally.
The frozen core
Evidently, the discussion so far has centred on how affected countries might respond to the threat of increased competition from Japanese exports in the event that the yen continues to sell off sharply. The threat, of course, is to the production base of those countries. As Japanese production rises and consumption falls, real global aggregate demand falls and supply rises, unless the shifts in Japan are offset with less supply and more demand in other countries. But if China decides its shift to internal consumption demand entails too great a slowdown, and rescinds on its commitment to undertake structural reforms (say by devaluing the renminbi or funding more investment spending); and if Europe moves to protect domestic production by easing monetary policy, further devaluing the EUR against the USD, then clearly the international adjustment will fall upon the only economy with the wherewithal to absorb such a burden: the USandA. (Note: this is why commentators are, or should be, so interested to see China and Germany rebalance their economy towards internal consumption, not just for their own sake, but for the global economy’s.)
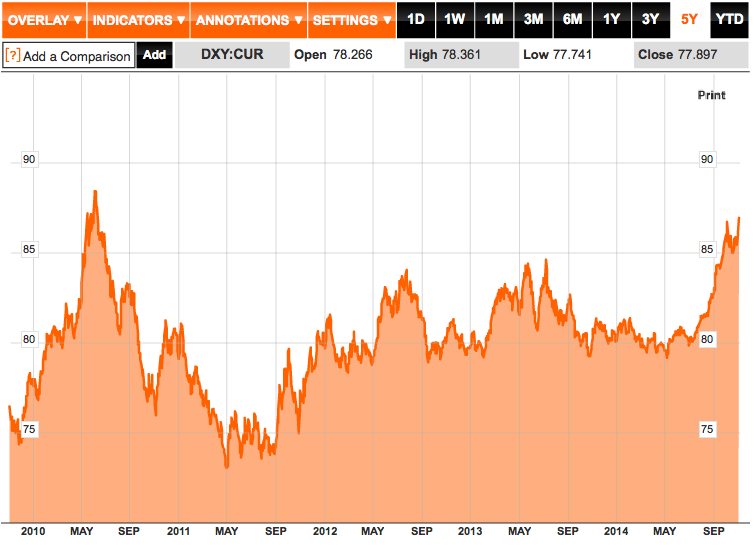
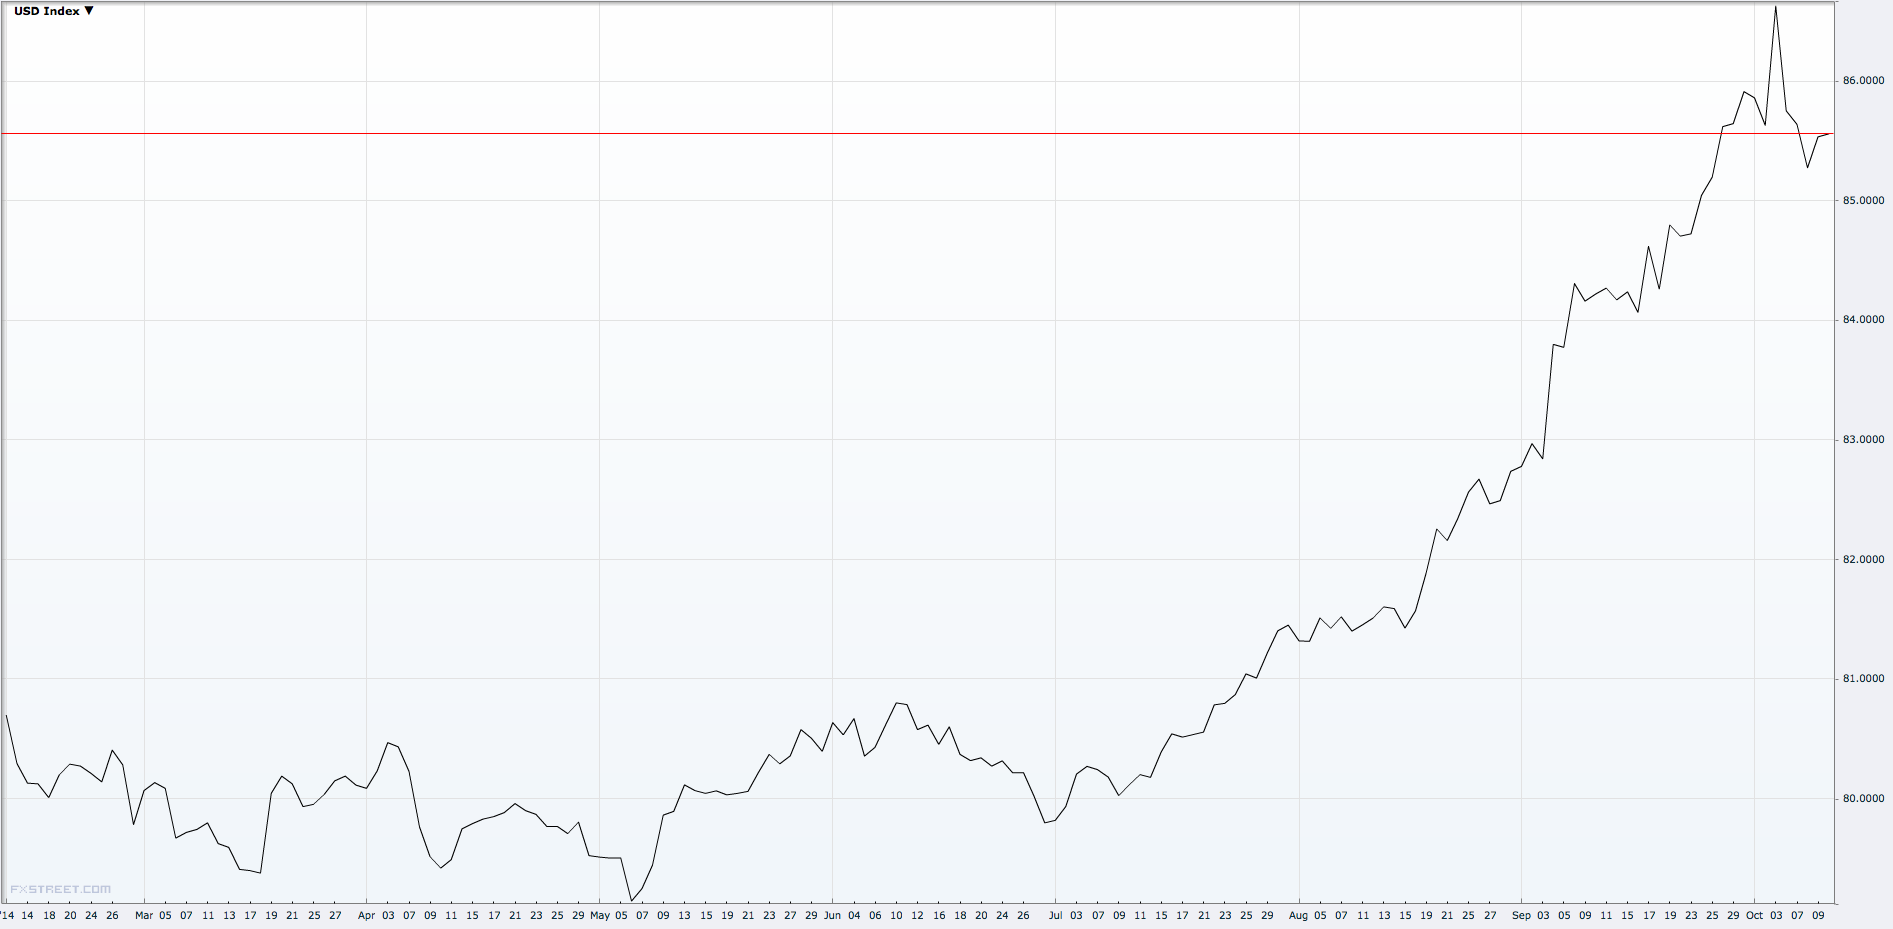
As exchange rates are priced in terms of other currencies, one currency’s loss is another’s gain. Given the weakness in yen, euro and sterling in the second half of the year, it is no surprise that the trade-weighted USD index has seen brisk gains. (This is not to say that the USD has been rising solely due to others weakening; it has been the divergent outlooks for monetary policies in the respective regions where each currency is used, that has led to these moves.)
There are a few ways the US economy can react to this development, and these adjustments become more pronounced the greater USD revaluation. Essentially, a rising currency provokes the opposite responses in the home country from when it is falling. So a higher USD tends to increase consumption demand amongst US households, since their purchasing power has increased. Likewise, there is a marginal substitution away from locally-produced goods in favour of imported goods, which are now cheaper. Therefore, a rising USD exerts disinflationary pressures on the domestic economy.
A currency devaluation typically raises a country’s trade surplus, or reduce its deficit, whereas an upwards revaluation reduces the deficit or increases the surplus (speaking generally). If the US allows its currency to appreciate strongly over the next few years, the inclination will be for the US trade deficit to increase, as it responds to higher foreign production and lower domestic production, and lower foreign consumption and higher domestic consumption. But if the US is consuming increasingly more than it is producing, it must borrow the difference from foreign lenders. Luckily, higher foreign production and lower foreign consumption necessarily entails higher foreign savings, which can be lent to the US to fund its trade deficits. In fact, this process is just about automatic in the modern international system. Since the US issues the reserve currency, there is very little it can do to impede the flow of capital into or out of the USD.
This increase in capital flows into the US economy can either be directed to investment, be it productive or unproductive, or consumption. During the US housing bubble last decade, the US found itself accumulating massive foreign liabilities which were funnelled into speculative (unproductive) housing investment and consumption. Without the government stepping in and running big deficits, the private financial sector was left to allocate the capital, and did a spectacularly bad job of it.
This brings us to one of my core arguments concerning the present state of the global economy; a sustained USD bull market likely means the US must experience another private credit boom, funding unproductive investment and consumption, or that the government needs to run big deficits. (it is no use arguing that private business investment ought to rise; a strong USD reduces US competitiveness and more or less automatically crimps private business investment). If neither of these conditions are met, then the US economy will experience a prolonged period of weakness and constantly flirt with frigid deflation.
Some qualifications
The Federal Reserve could respond by loosening monetary policy further, and in so doing quash the USD rally and negate the debt-or-deflation trade-off. I examined the possibility of more QE last month, and felt that there was far more likelihood of an extension of zero interest rates than more asset purchases. Nevertheless, the risk of more QE rises the stronger the USD gets and the further inflation falls. More QE from the Fed would then mean an (unintentionally) coordinated global monetary stimulus, which would reduce the necessary adjustments in goods and capital markets from currency movements (since the movements would be less pronounced). This would be fine, except that owing to the nature of modern central banking, this stimulus would almost certainly feed asset bubbles long before it fed general goods and services inflation, setting the global economy up for another crash at some point in the future.
Another consideration pertains to developments in energy markets. When the US was running monster trade deficits during the housing bubble last decade, the most important surplus nations were the East Asian economies (China especially) and petroleum exporters. (See chart below.)
As an aside, there is a school of thought, to which I subscribe, which argues that these global imbalances were a fundamental condition of the various bubbles leading up to the crashes of 2008 and then the Euro crisis. (Although, arguing that they themselves were the cause of financial crises merely demands an explanation of the causes of the global imbalances.)
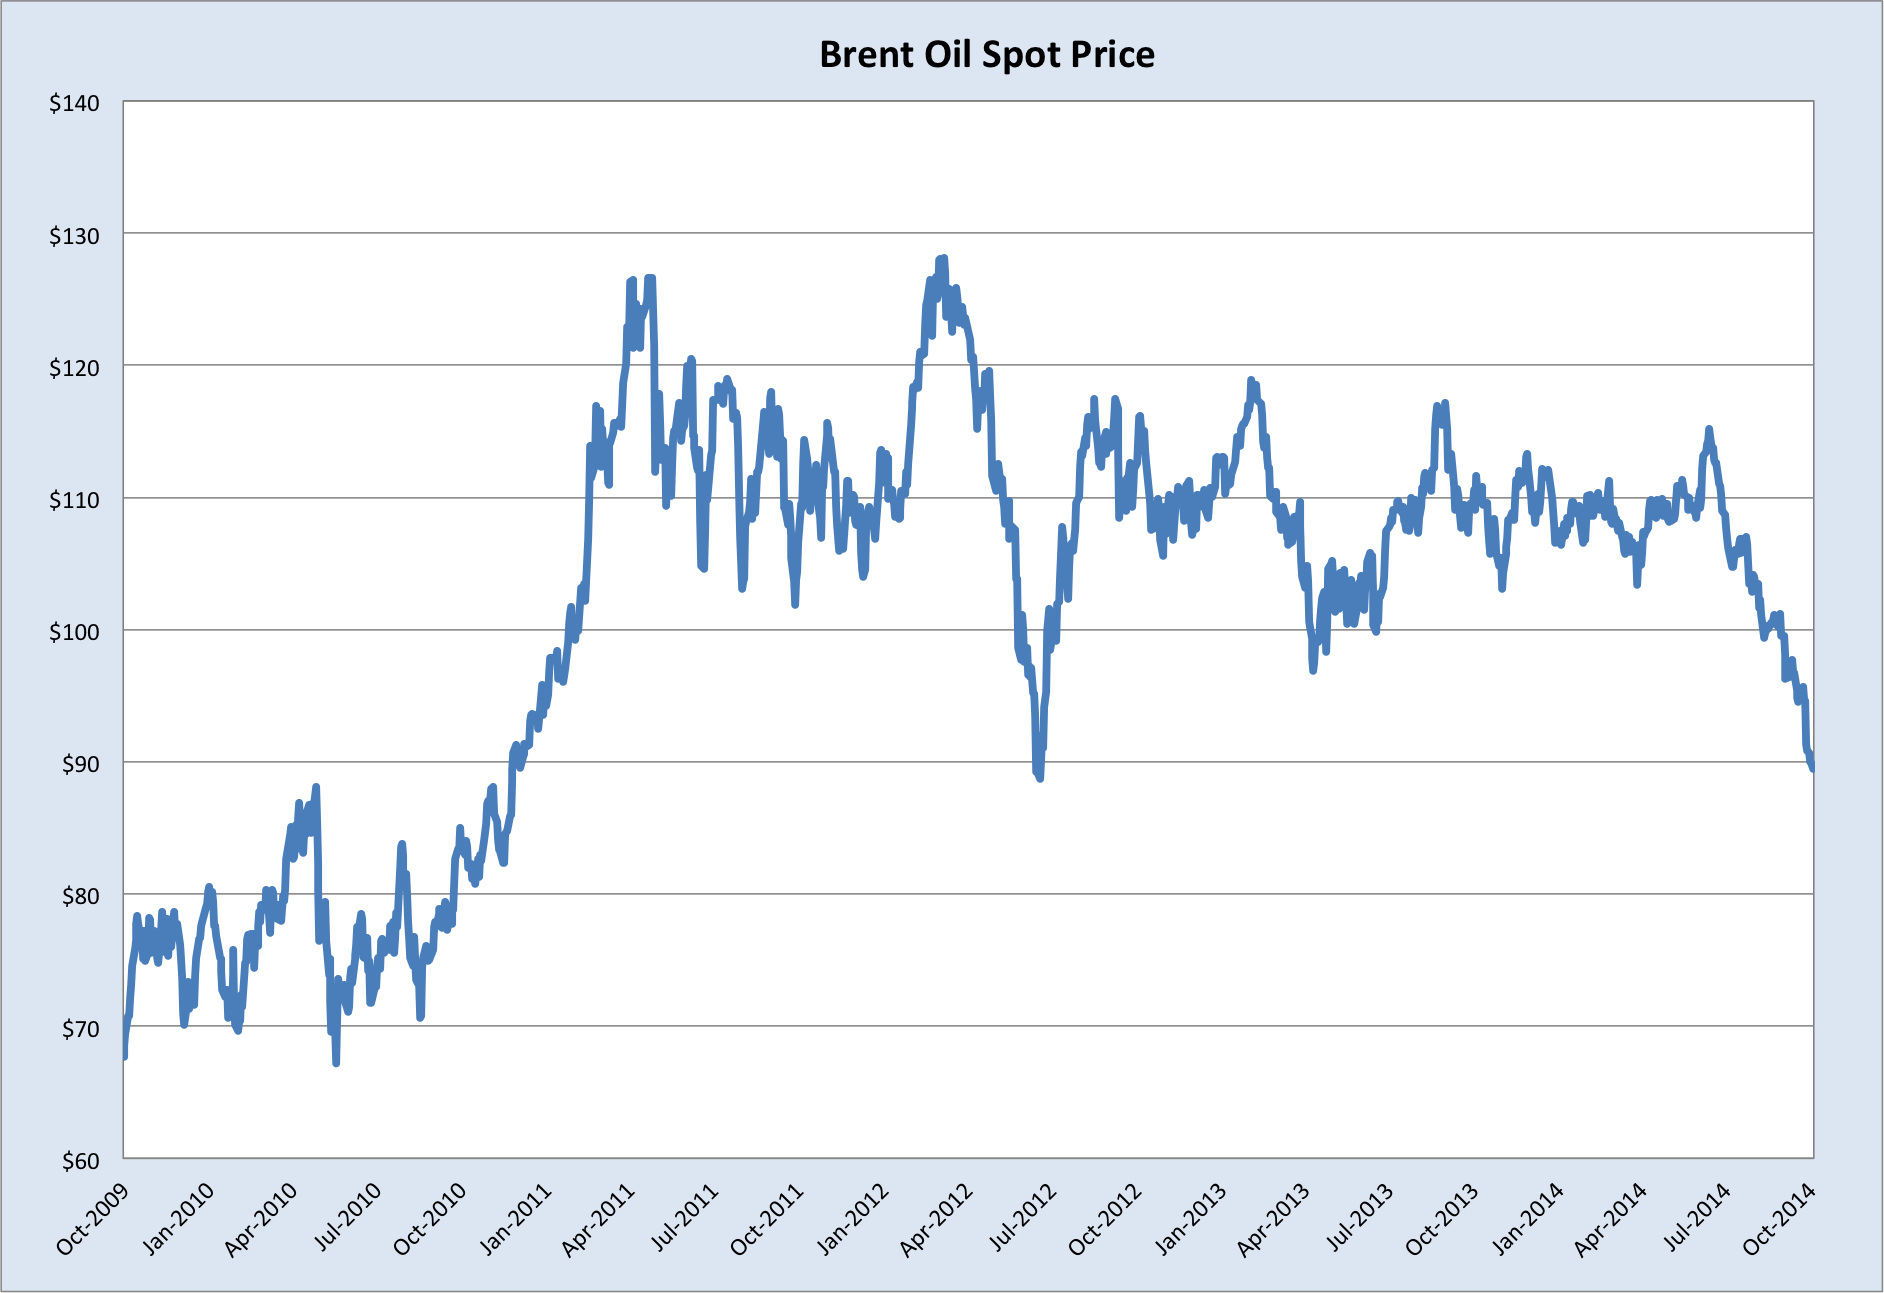
The shale gas and then oil booms have therefore been of signal importance to the US economy’s reduced susceptibility to large trade deficits.
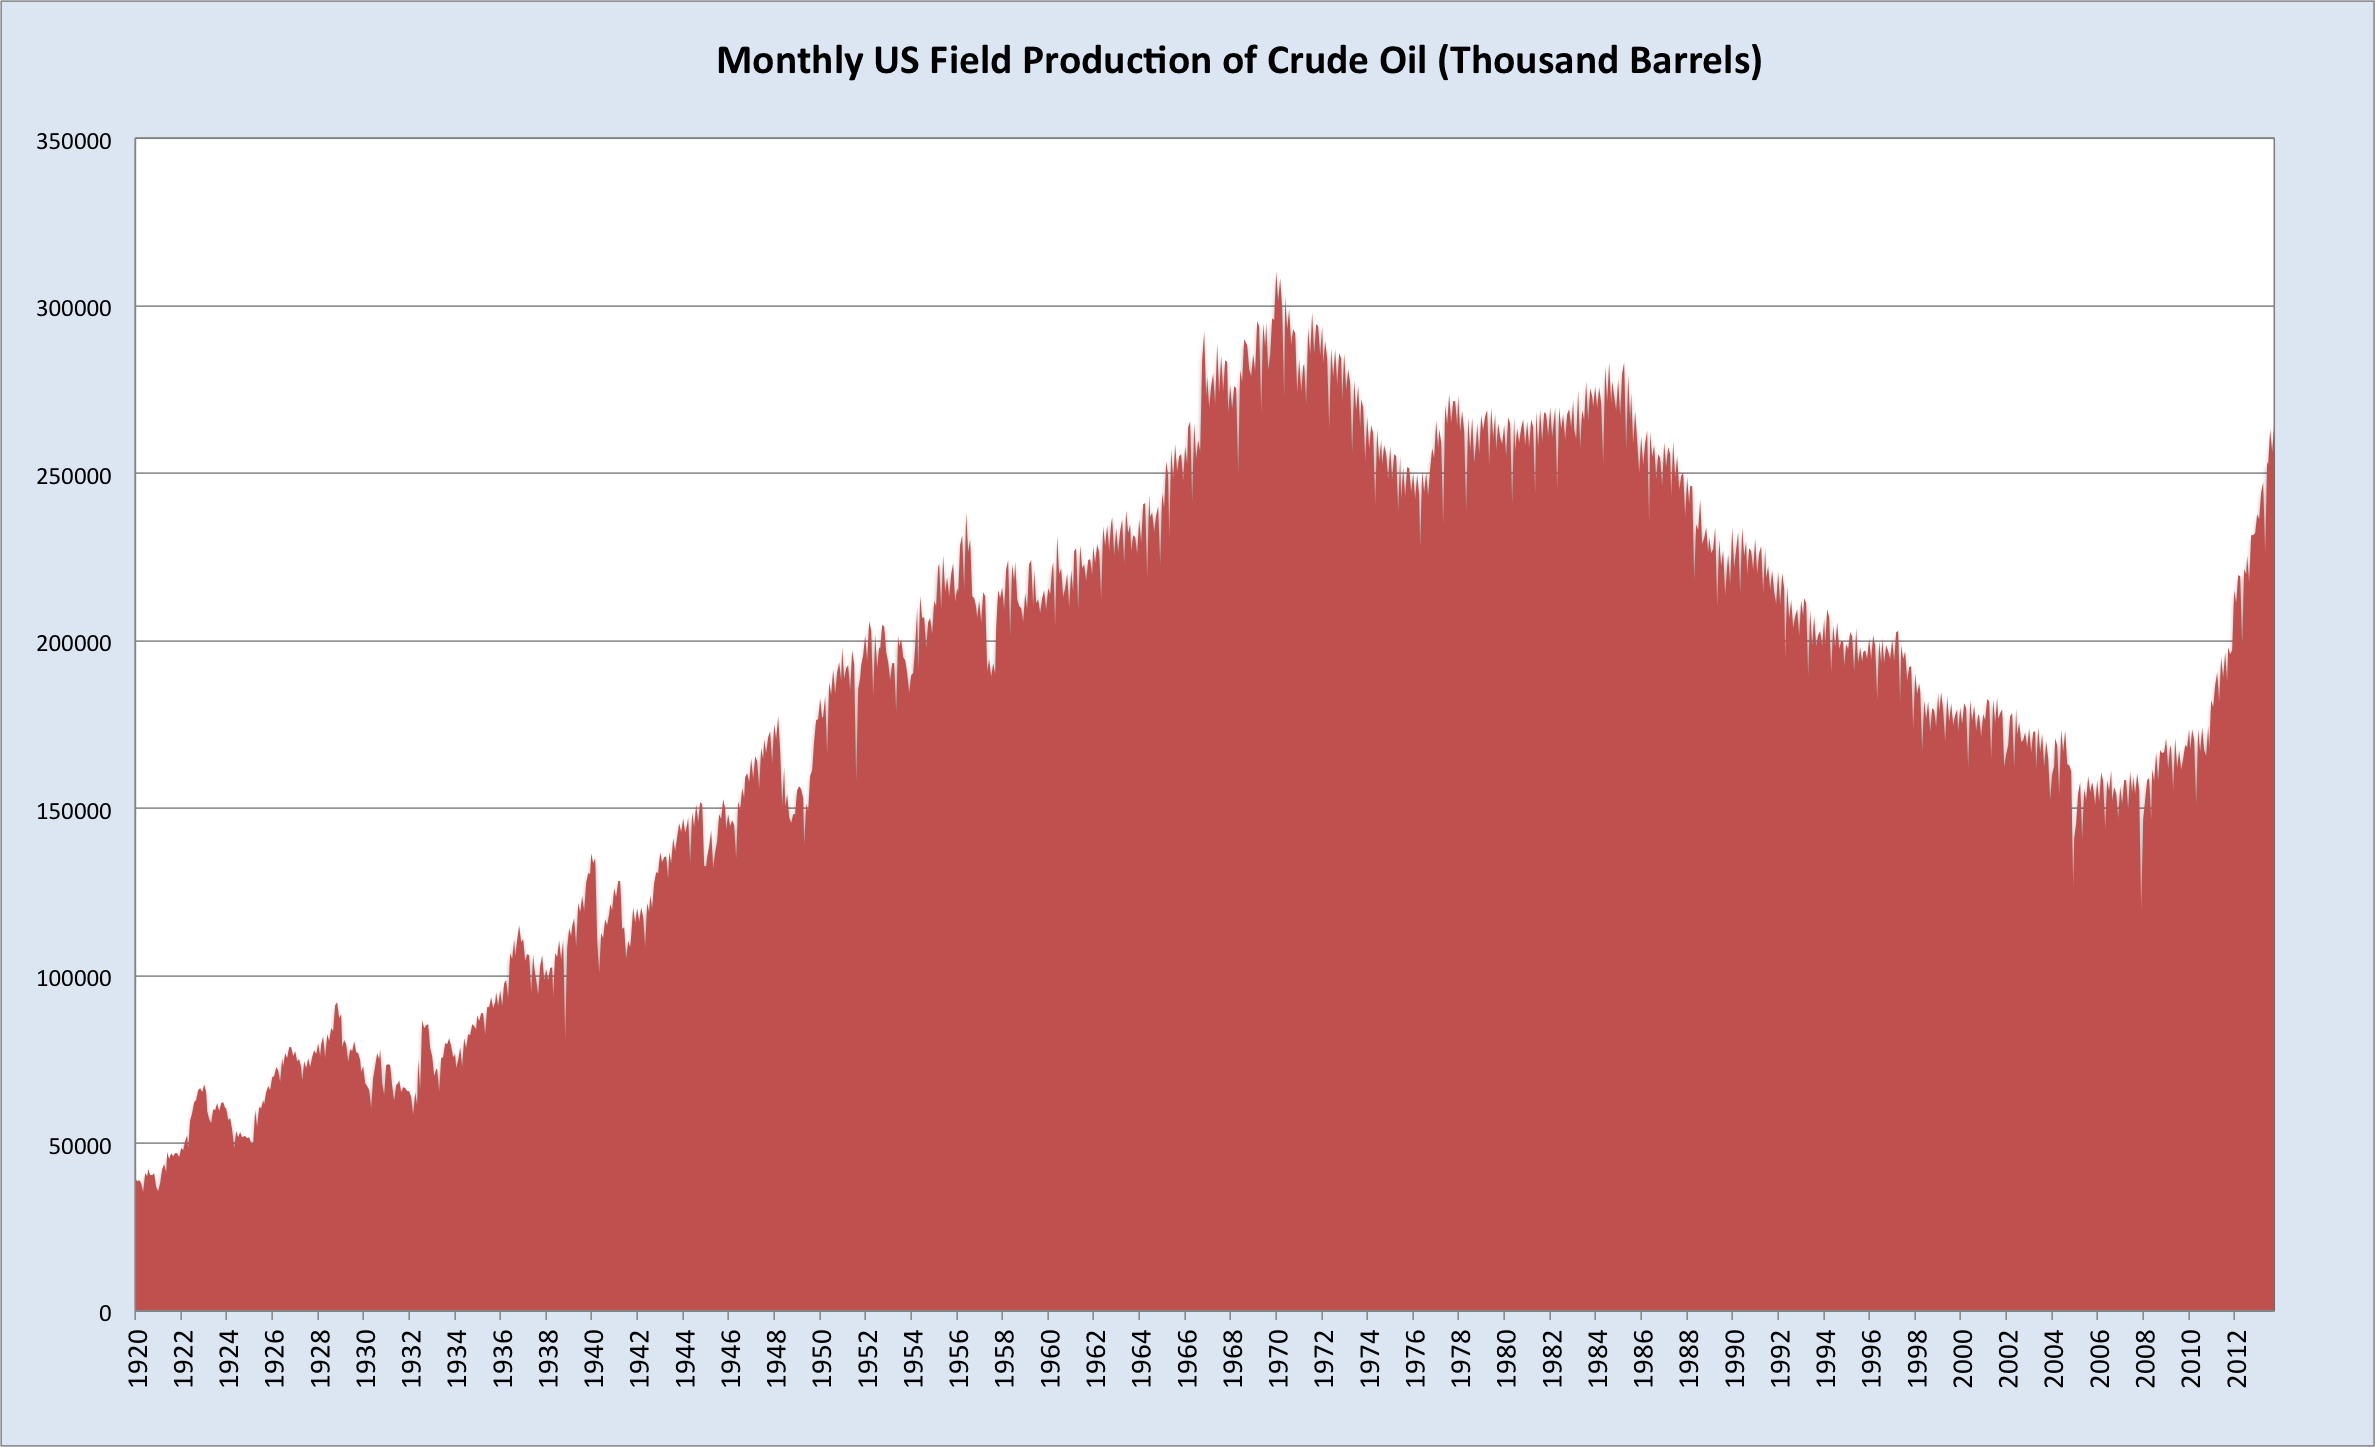
Whenever we generalise about the mechanics of economic adjustment, such as when we assert that a currency appreciation forces a deterioration in a country’s trade balance, we must be alert to the myriad of real-world nuances that could prevent such a response. There is no doubt that cheaper oil, should it be sustained, provides a significant boost for the US economy, even with the shift towards domestic production. More to the point, if the US manages to reduce the cost of shale drilling, fend off the challenges from overseas and continue pushing its oil production higher at a rapid clip, then this phenomenon could dominate the effects of a stronger dollar. In which case the trade balance may not worsen, and the debt-or-deflation trade-off I believe would arise from such a development may not be a meaningful consideration. All it would mean is that part of the burden of adjustment from the various currency devaluations around the world would shift to petroleum exporters (hardly an unwelcome prospect).
In summary, in the absence of a renewed preparedness to deploy monetary stimulus from the Fed, the appreciating USD could well force upon the US a choice between rising indebtedness (again) or stagnant prices and labour markets. As I see it, the manner of this adjustment will depend heavily on developments in the crude oil market, and the degree to which other major economies take upon themselves the burden of consumption. Most importantly, if China suddenly started running big trade deficits owing to higher domestic consumption demand, this would lessen the need for the US to choose between debt or deflation.
One final point bears mentioning. It may seem odd to be mulling over the global economy’s polar prospects in an era of mass money printing. Surely this is all going to be madly inflationary at some stage? However, it is important to remember the delivery channel of quantitive easing. When central banks wish to expand the money supply, the attempt to inject money into the economy by purchasing financial assets (mainly government bonds) from financial institutions. In modern experience, the money those financial institutions receive in exchange for their assets is overwhelming left idle as reserves deposited with the central bank. Hence the extraordinary monetary stimulus of recent history has left little in the way of an inflationary legacy. This could all change if for some reason banks embarked on a mad lending spree, pumping those idle reserves into the economy. For now though, there seems scant chance of that.
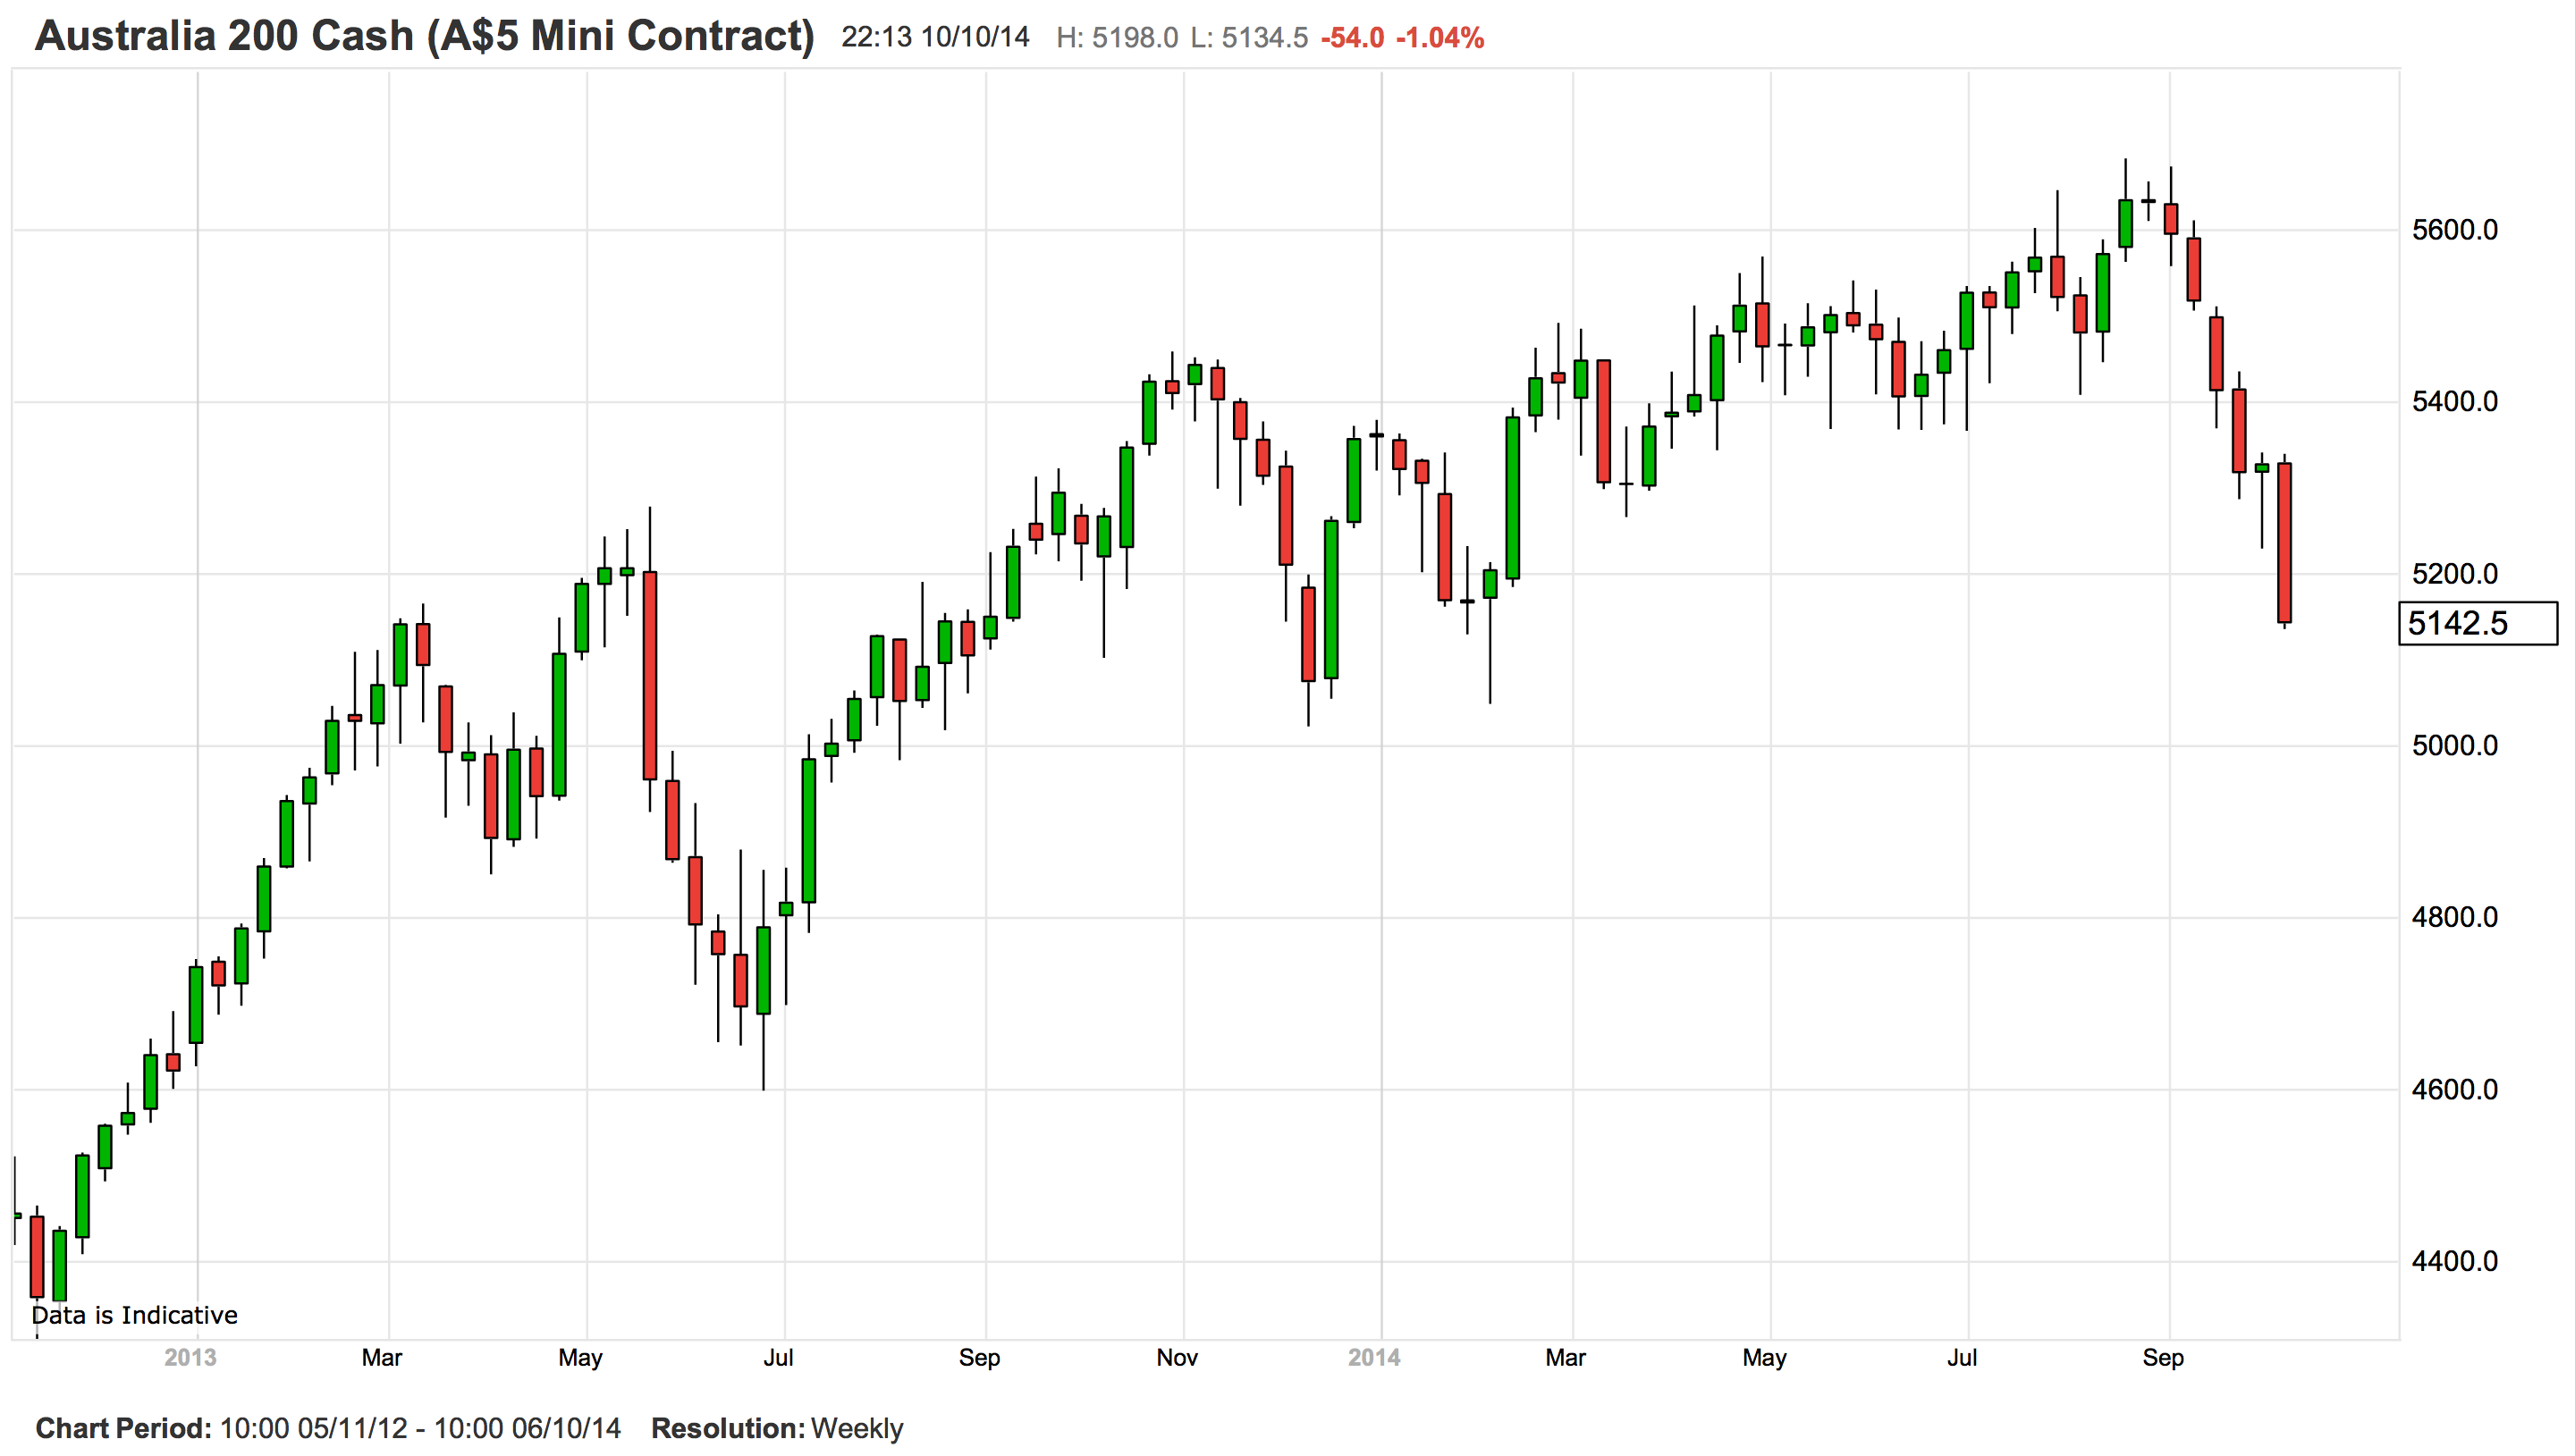
‘Strayan connection
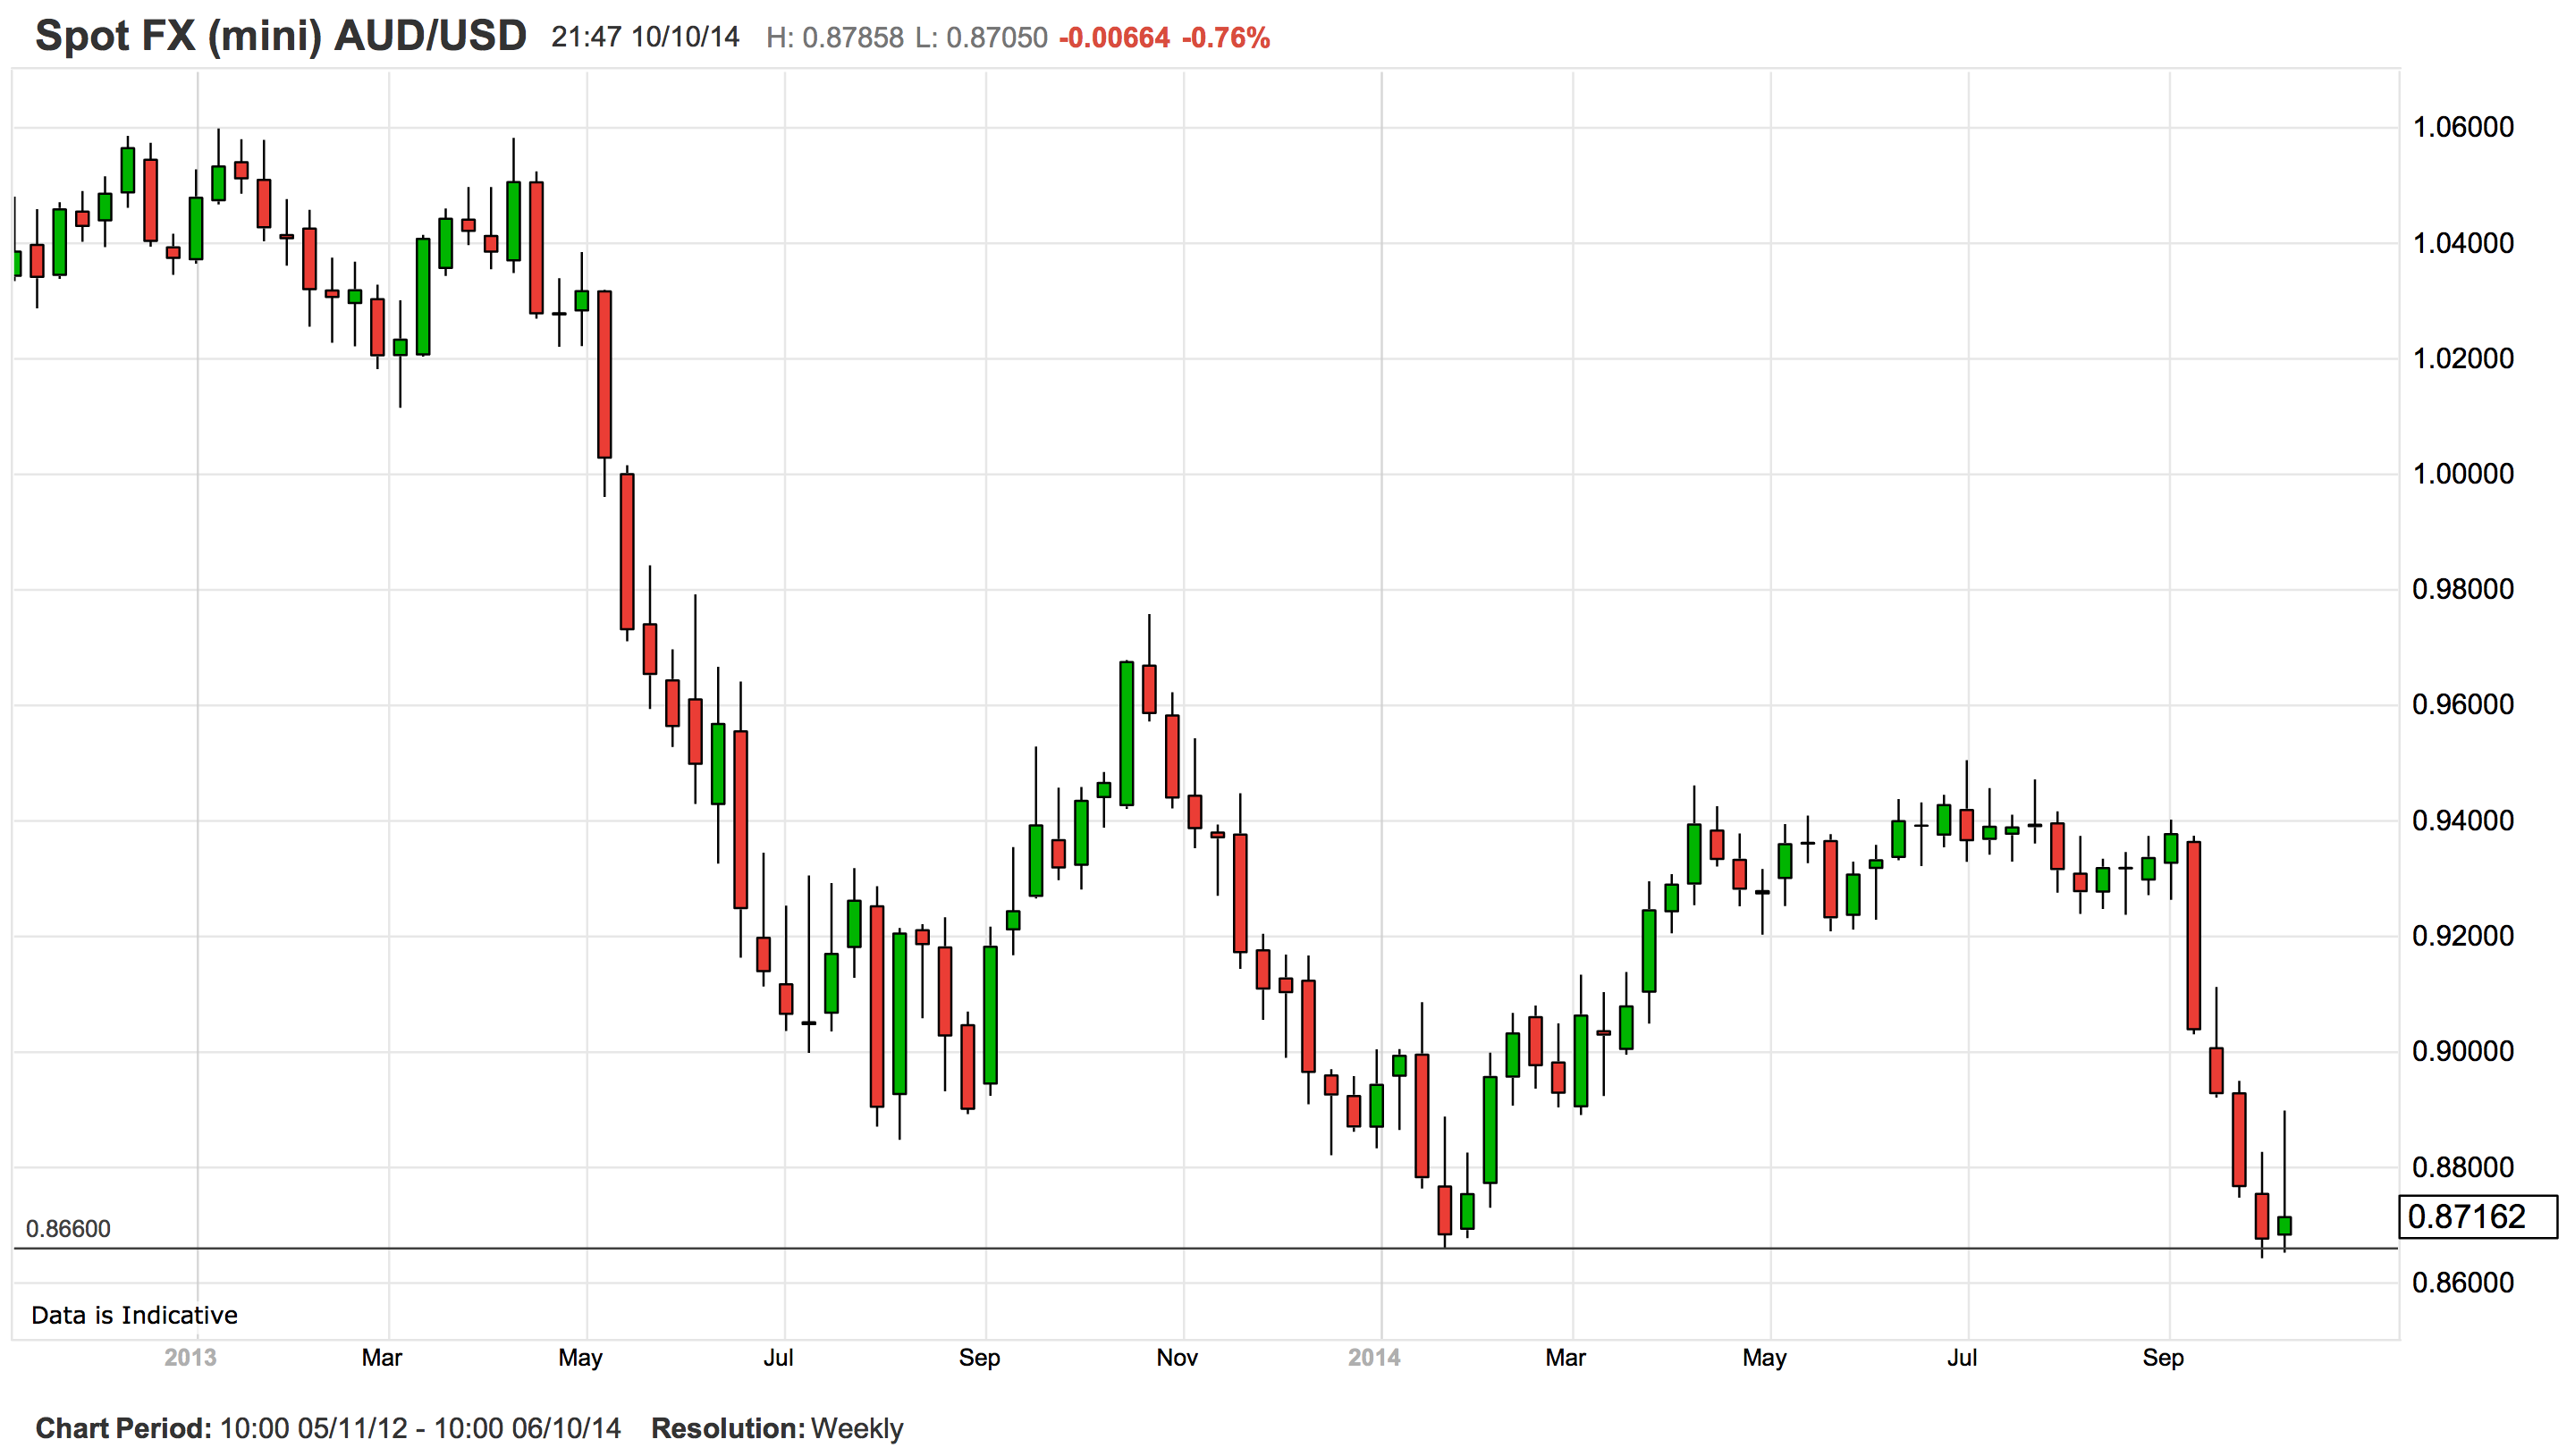
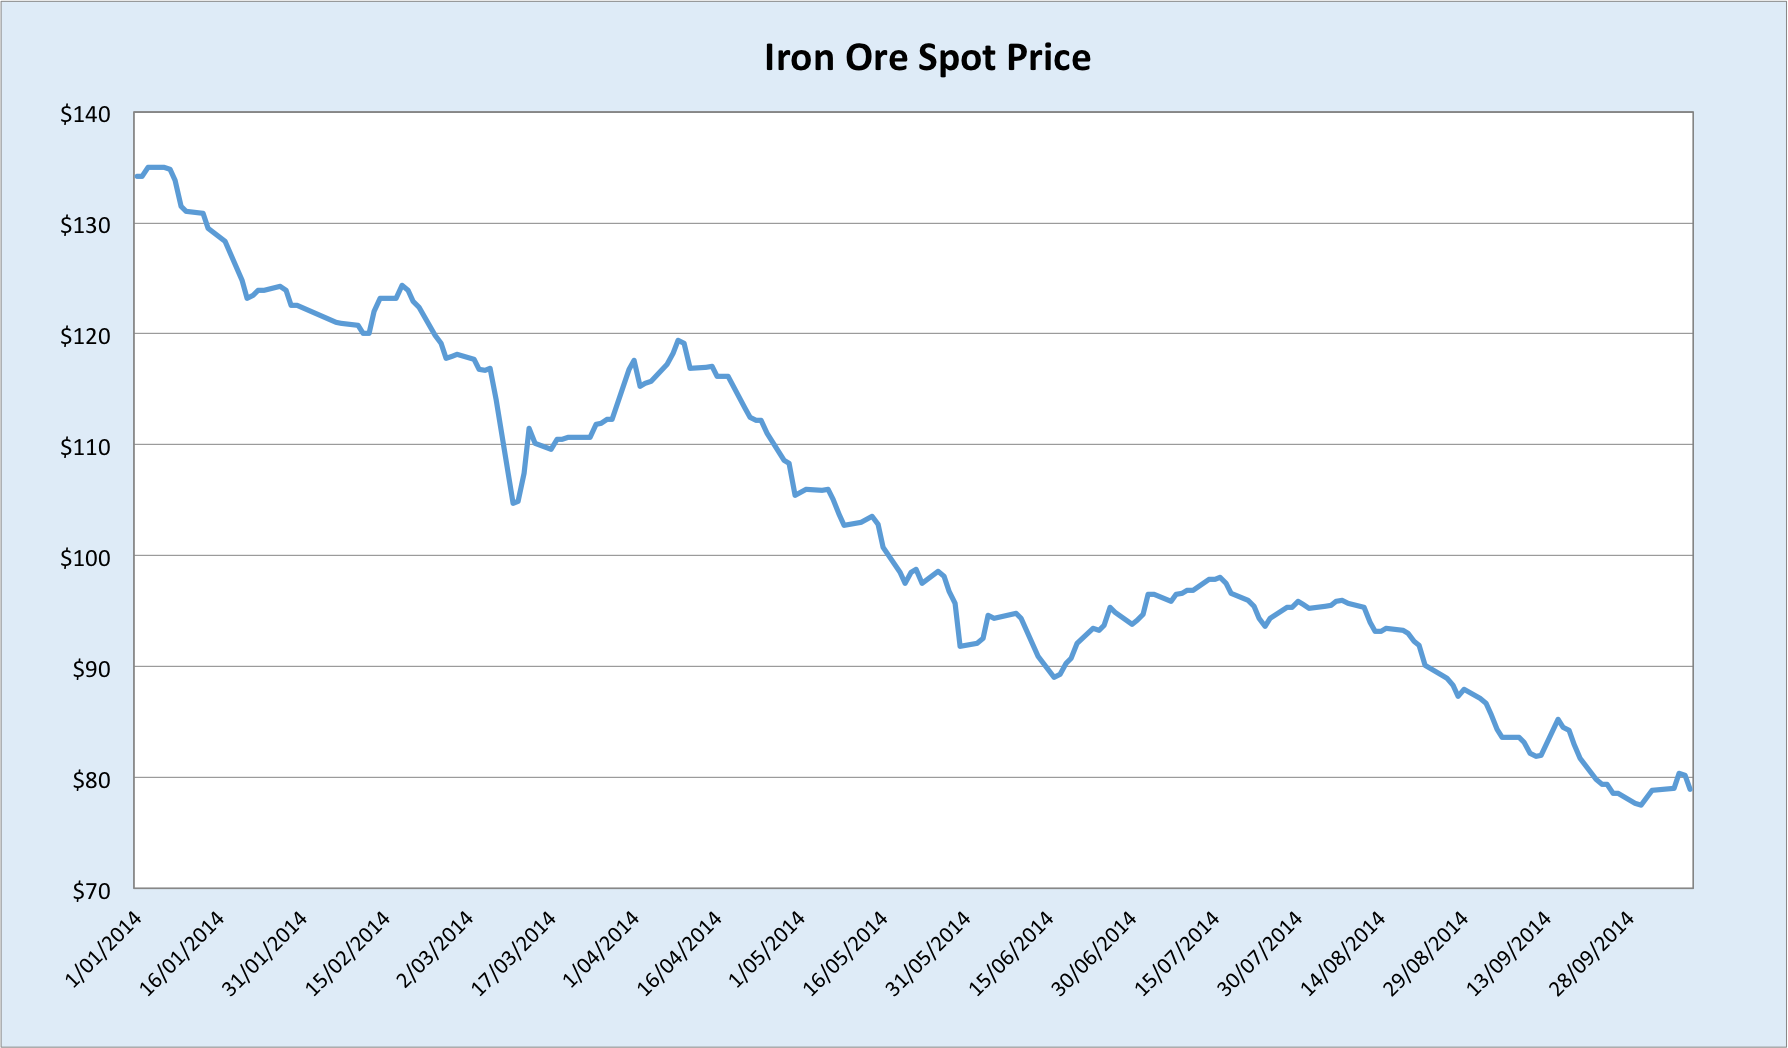
As usual, Australia would be tossed about like flotsam in the surf were all this to play out. First and most obviously, a strong USD typically hurts commodity prices. Much of this would be offset by a weakening Australian dollar, and there are obviously much more pressing concerns with say iron ore than a strong USD. The long suffering coal industry would come under further pressure, as US exports directly compete with Australian coal (all the more so after the shale gas and oil booms displaced coal as a power source in the US). However, of much greater concern to Australia is the risks that the yen devaluation poses to our emerging LNG industry.
In March 2011, Japan was devastated by a tragic triple-disaster of earthquake, tsunami and nuclear meltdown. One understandable consequence of this disaster was the shutting down of all Japan’s nuclear reactors, which required an immediate switch to imported fossil fuels. This drove Japan’s trade balance into deficit, where it has remained in spite of the massive currency depreciation from late 2012.
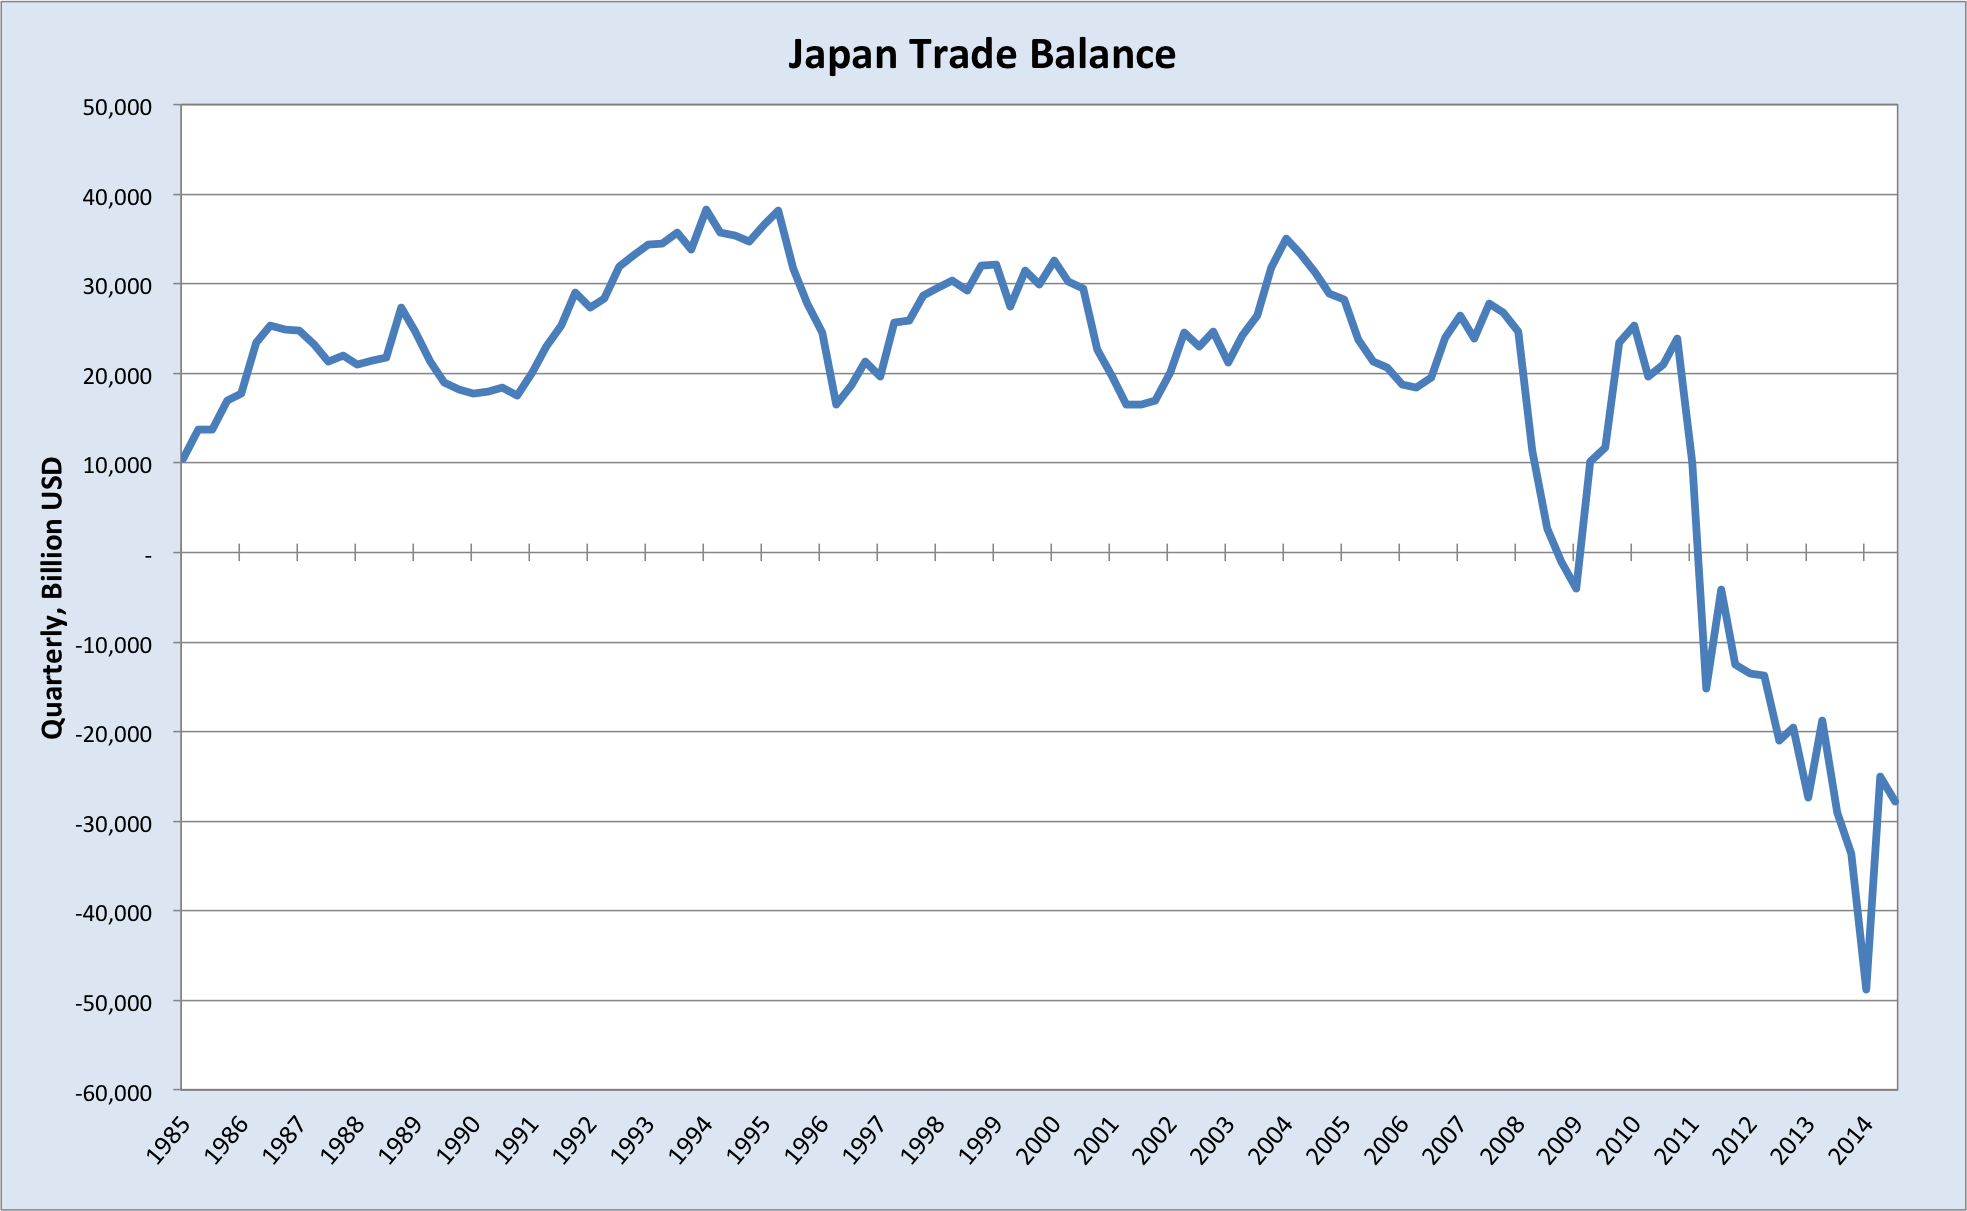
One reason why this has happened by been the inelastic nature of Japan’s demand for energy. With few available alternatives, Japan has needed to import the same amount of oil, gas and coal to meet its domestic needs, and all this imported fuel has become more expensive following the yen depreciation. There was already concern within certain segments of corporate Japan that the costs of higher energy were offsetting the competitiveness improvements from the lower currency.
If the USDJPY is indeed on its way to 120 and beyond, I find it hard to see Japan weathering this depreciation in the yen without turning the nuclear reactors back on. It is true that there is strong community opposition to this, but the more expensive energy becomes, the less sway this sentiment will hold. There have already been moves to restart some reactors lately. Should this occur on a large scale, it will pile pressure on to Australia’s gold-plated LNG industry, which is already facing challenges from US and Russian gas, and the slump in crude oil prices to which LNG contract prices are linked.
Further reading
For a more detailed discussion of the mechanics of international trade and capital flows, and the issue of global imbalances generally, see Michael Pettis’ book, The Great Rebalancing, and/or his blog, China Financial Markets.
There was a spirited debate last decade, prior to the financial crisis, concerning the sustainability global imbalances, dealing especially with the question of the US current account deficit. One influential school of thought argued that the US current account deficit was a natural and healthy feature of the international economic system, largely explained by the inability of immature financial markets in developing countries to fully allocate their savings domestically, which entailed no painful adjustment. This view was exemplified by Dooley, Folkerts-Landau & Garber (2003) and (2004), but was evident also in Chinn & Ito (2005), Bordo (2005), and Backus, Henriksen, Lambert & Telmer (2009).
On the other hand, some authors did recognize the risks building up due to ballooning global imbalances, and sounded warnings accordingly. Examples include, Obstfeld & Rogoff (2005), Edwards (2005), and Roubini & Setser (2004).
It should come as little surprise that I side wholeheartedly with the latter camp.
