Let’s start with a quick refresher on where we’re at.
There have been strong countervailing forces exerting themselves on Australia’s economy this year, and this is why the cash rate has gone through an unusual period of stability. The cyclical boost from the last easing cycle has not been sufficient to overcome the structural drag of the softening resource sector, and so the RBA has been unable to seriously countenance higher rates. At the same time, house prices, especially in Sydney and Melbourne, have appreciated excessively, and this has left the RBA reluctant to cut further.
As I’ve hopefully argued with clarity thenceforth, my view at the time of this blog’s establishment was that the structural headwinds battering the Australian economy were too potent for the traditional interest rate-exposed sectors (housing and consumption) to overcome, and so interest rates would fall further before they rose. I have strived to present all possible circumstances that would invalidate this view, but for me none of the arguments against further cuts has been satisfactory.
Developments over the past month have mostly favoured a dovish view on rates. The most important has been the rout in iron ore prices, which has challenged widely-held expectations, my own included, that the final quarter of this year would deliver respite for iron ore producers. Economic policy in China is shifting to a more stimulatory footing, which many hope will presage an improvement in the fortunes of bulk commodities. However, there seems scant chance of the resumption in credit growth and investment being substantial enough to achieve this. Domestic capital expenditure held up better than expected in the third quarter, though was still down 8% from a year earlier.
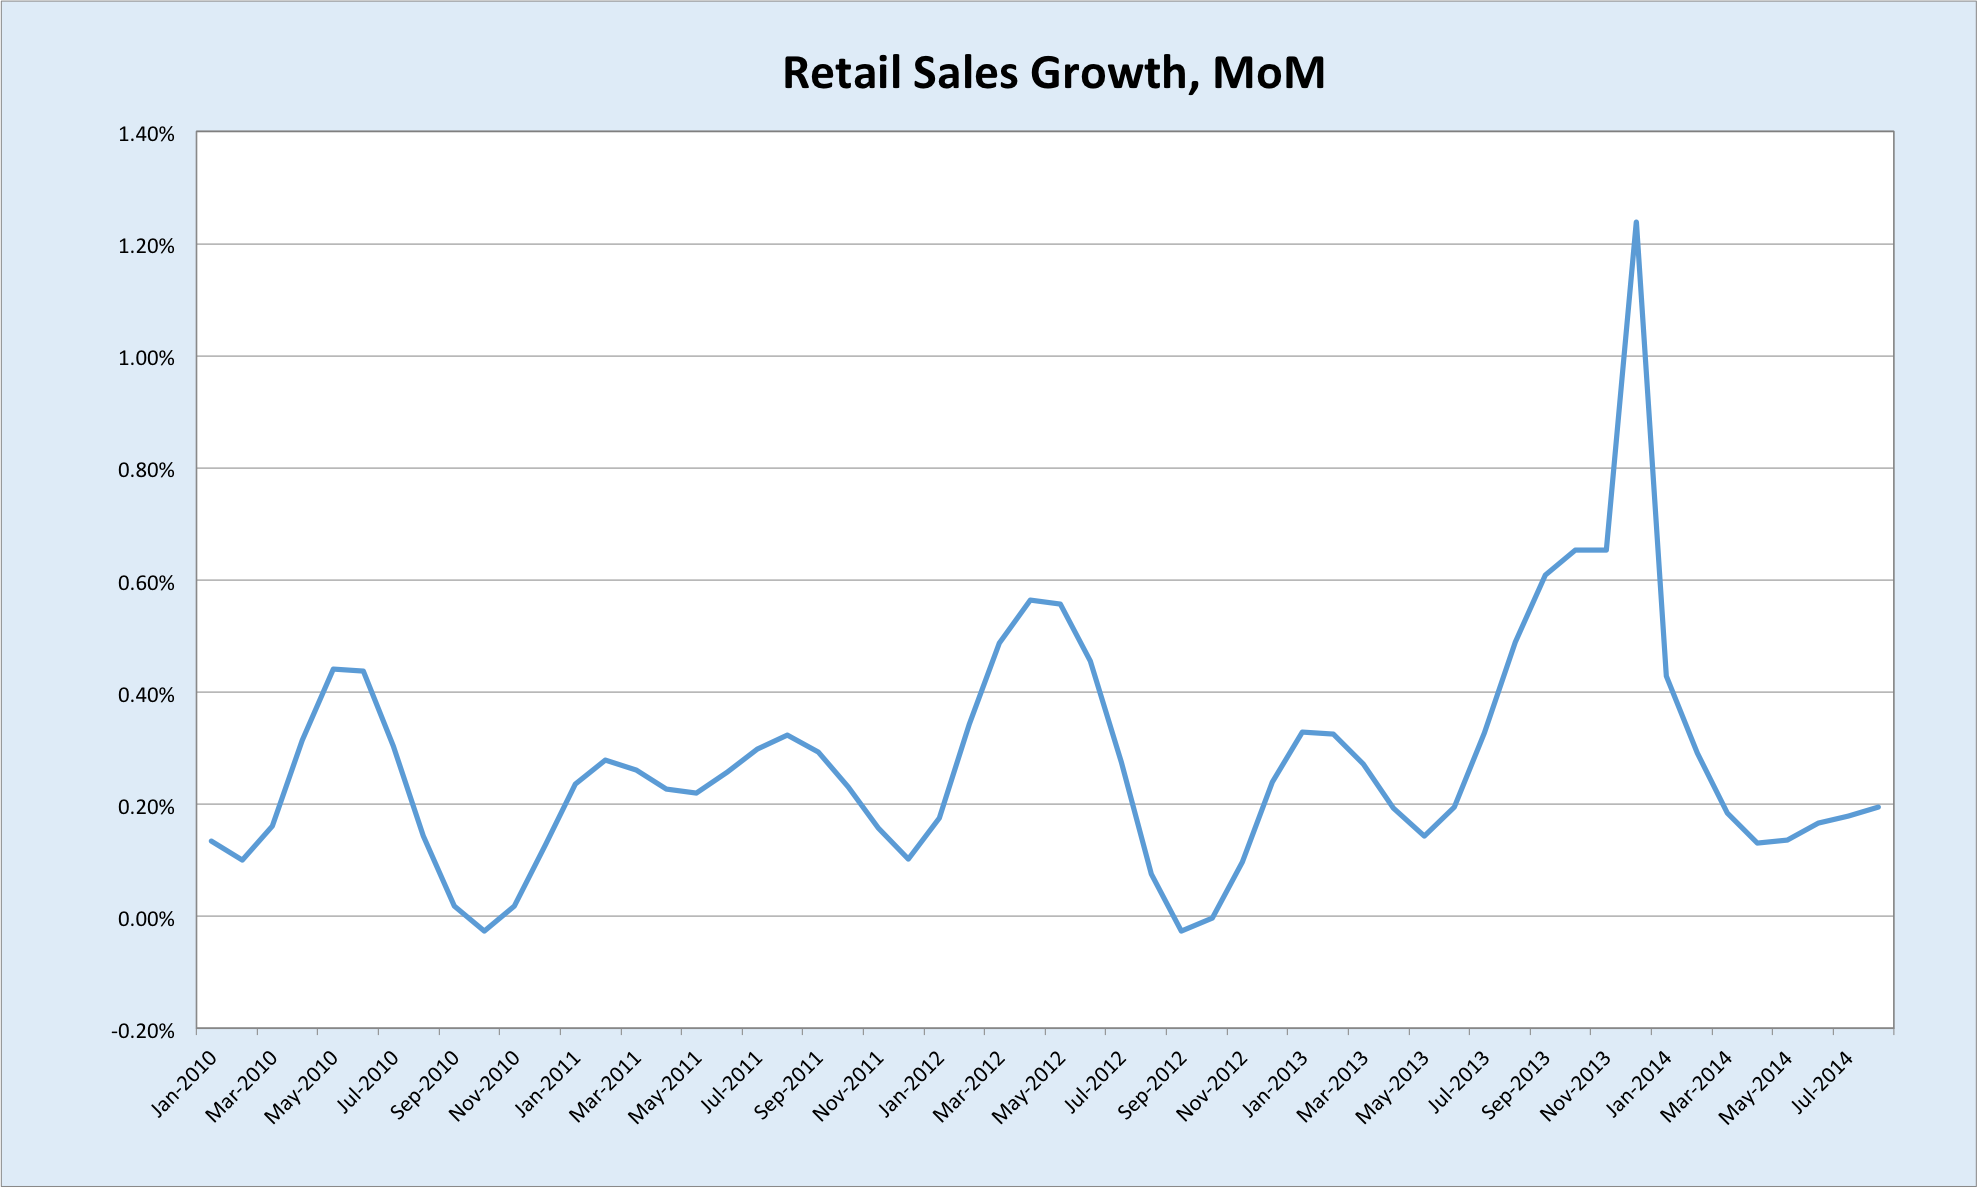
On the cyclical side, the housing prices were flat in November, with building approvals down sharply and credit growth accelerating slightly. Retail sales were healthy enough, though households appear disinclined to eat into savings. There hasn’t been a material slowing of activity on the cyclical side to warrant cuts just yet, but neither is there much sign of sufficient pressure to raise them.
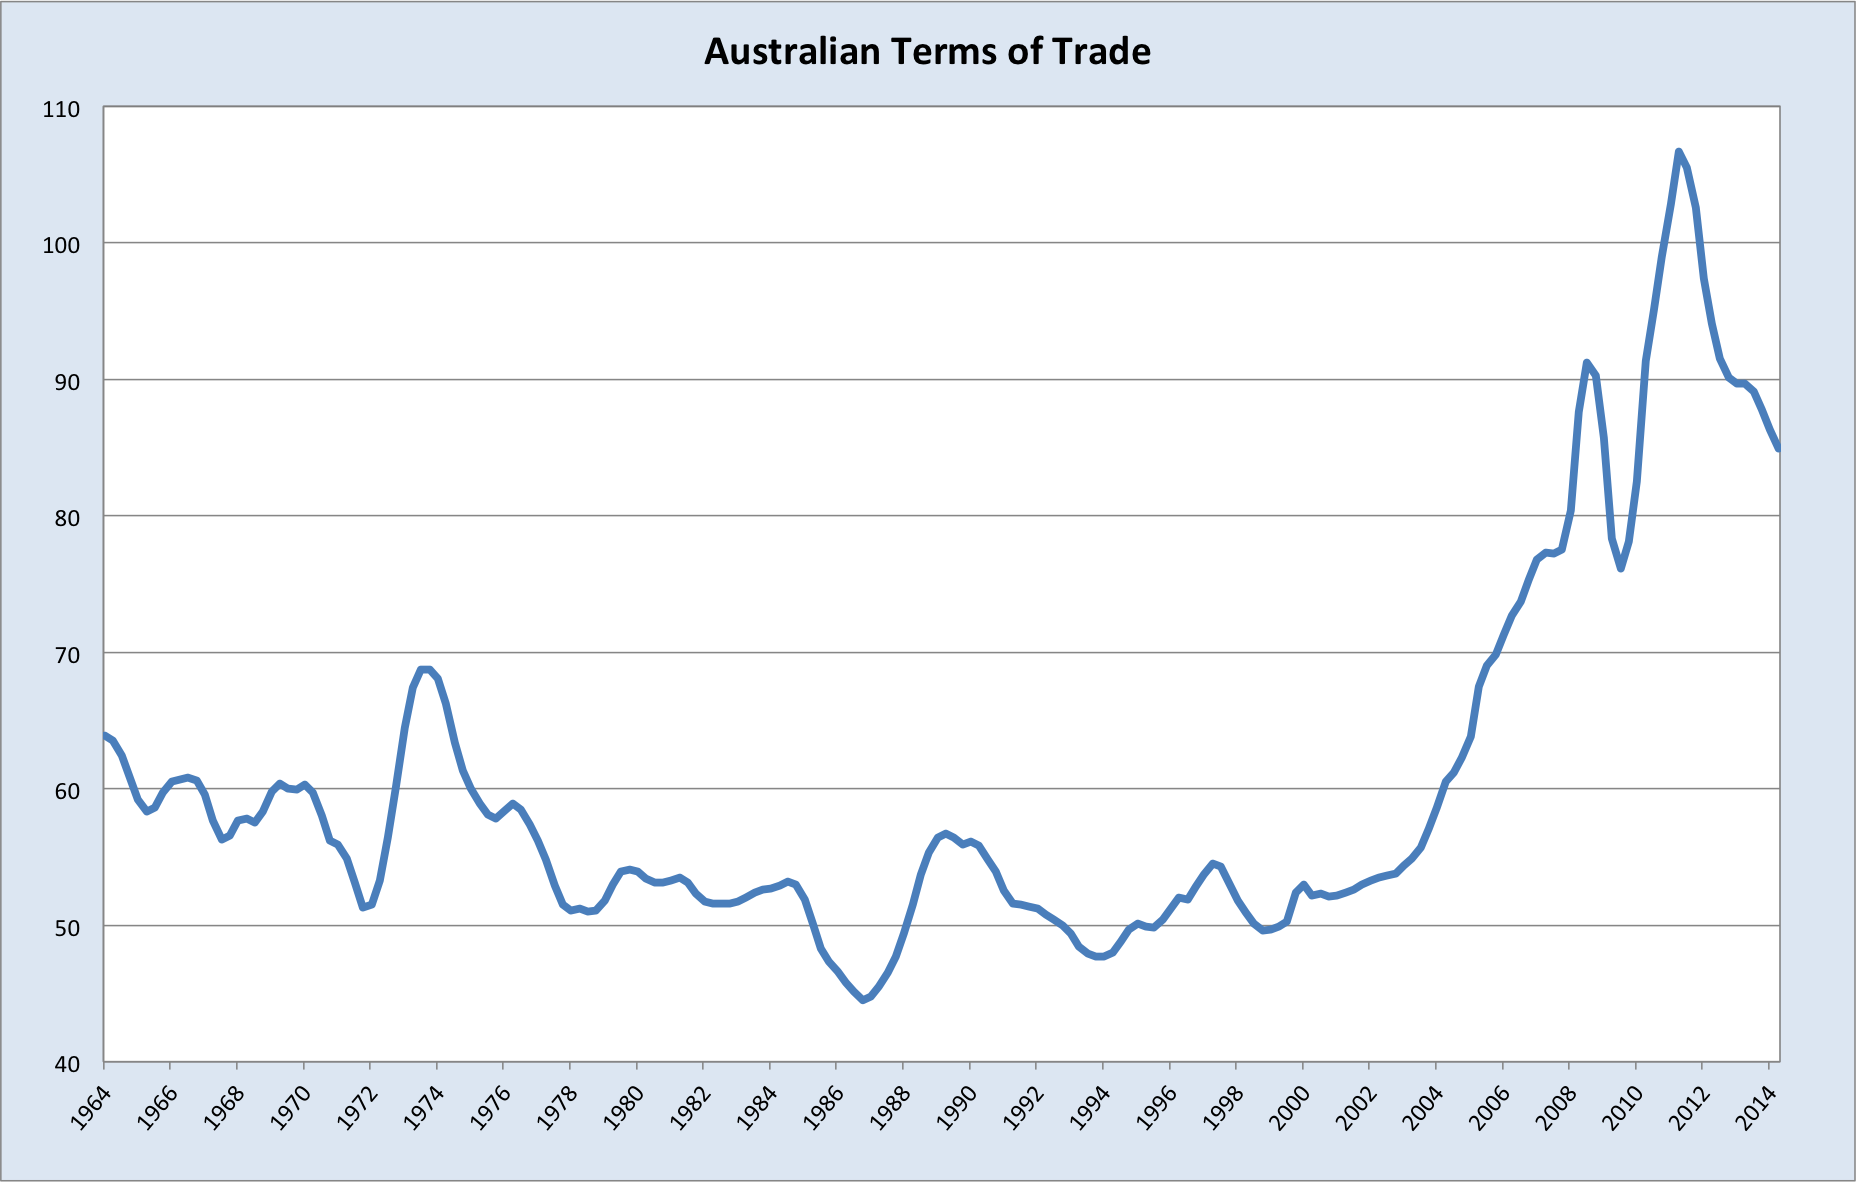
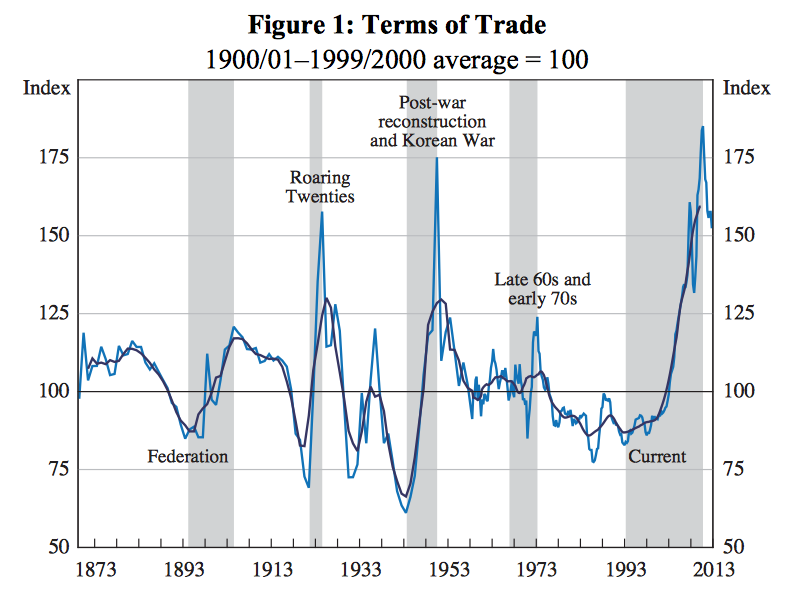
Terms of Trade
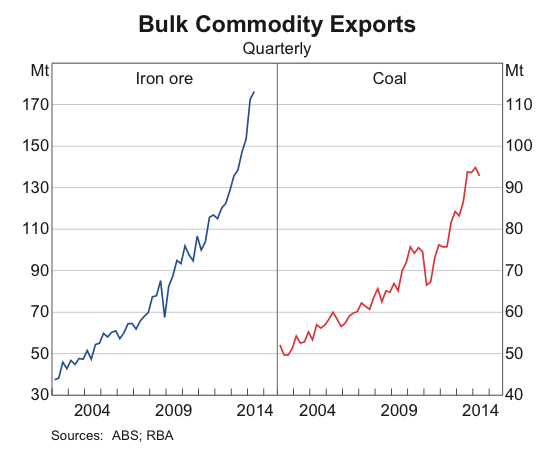
The news this month for Australia’s key commodities has been dour. Iron ore has suffered grievously, a few months ahead of my expectations. There’s increasing agitation globally for reduced dependence on coal, and LNG is facing its own ‘iron ore moment’ due to lacklustre demand and crashing oil prices.
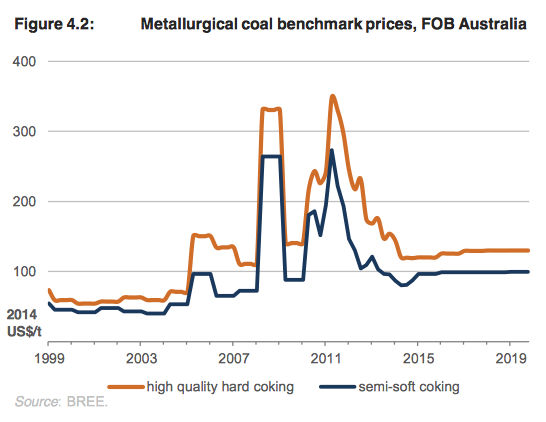
Coal’s days of boosting Australia’s export earnings are well and truly over. Last month I wrote:
Despite tougher times, coal isn’t going anywhere. Aggressive expansion plans are being tempered, but the industry will continue to make a significant contribution to Australia’s economic output and export earnings. Nevertheless, the days of coal serving up windfall profits and tax revenues are past.
This was a bit lazy, I will admit. Coal is Australia’s second largest export and so in that sense it will ‘continue to make a significant contribution’ to its export earnings. But what we’re concerned with here are rates of change. Will coal support additional gains in Australian living standards in the future? Very likely it will not.
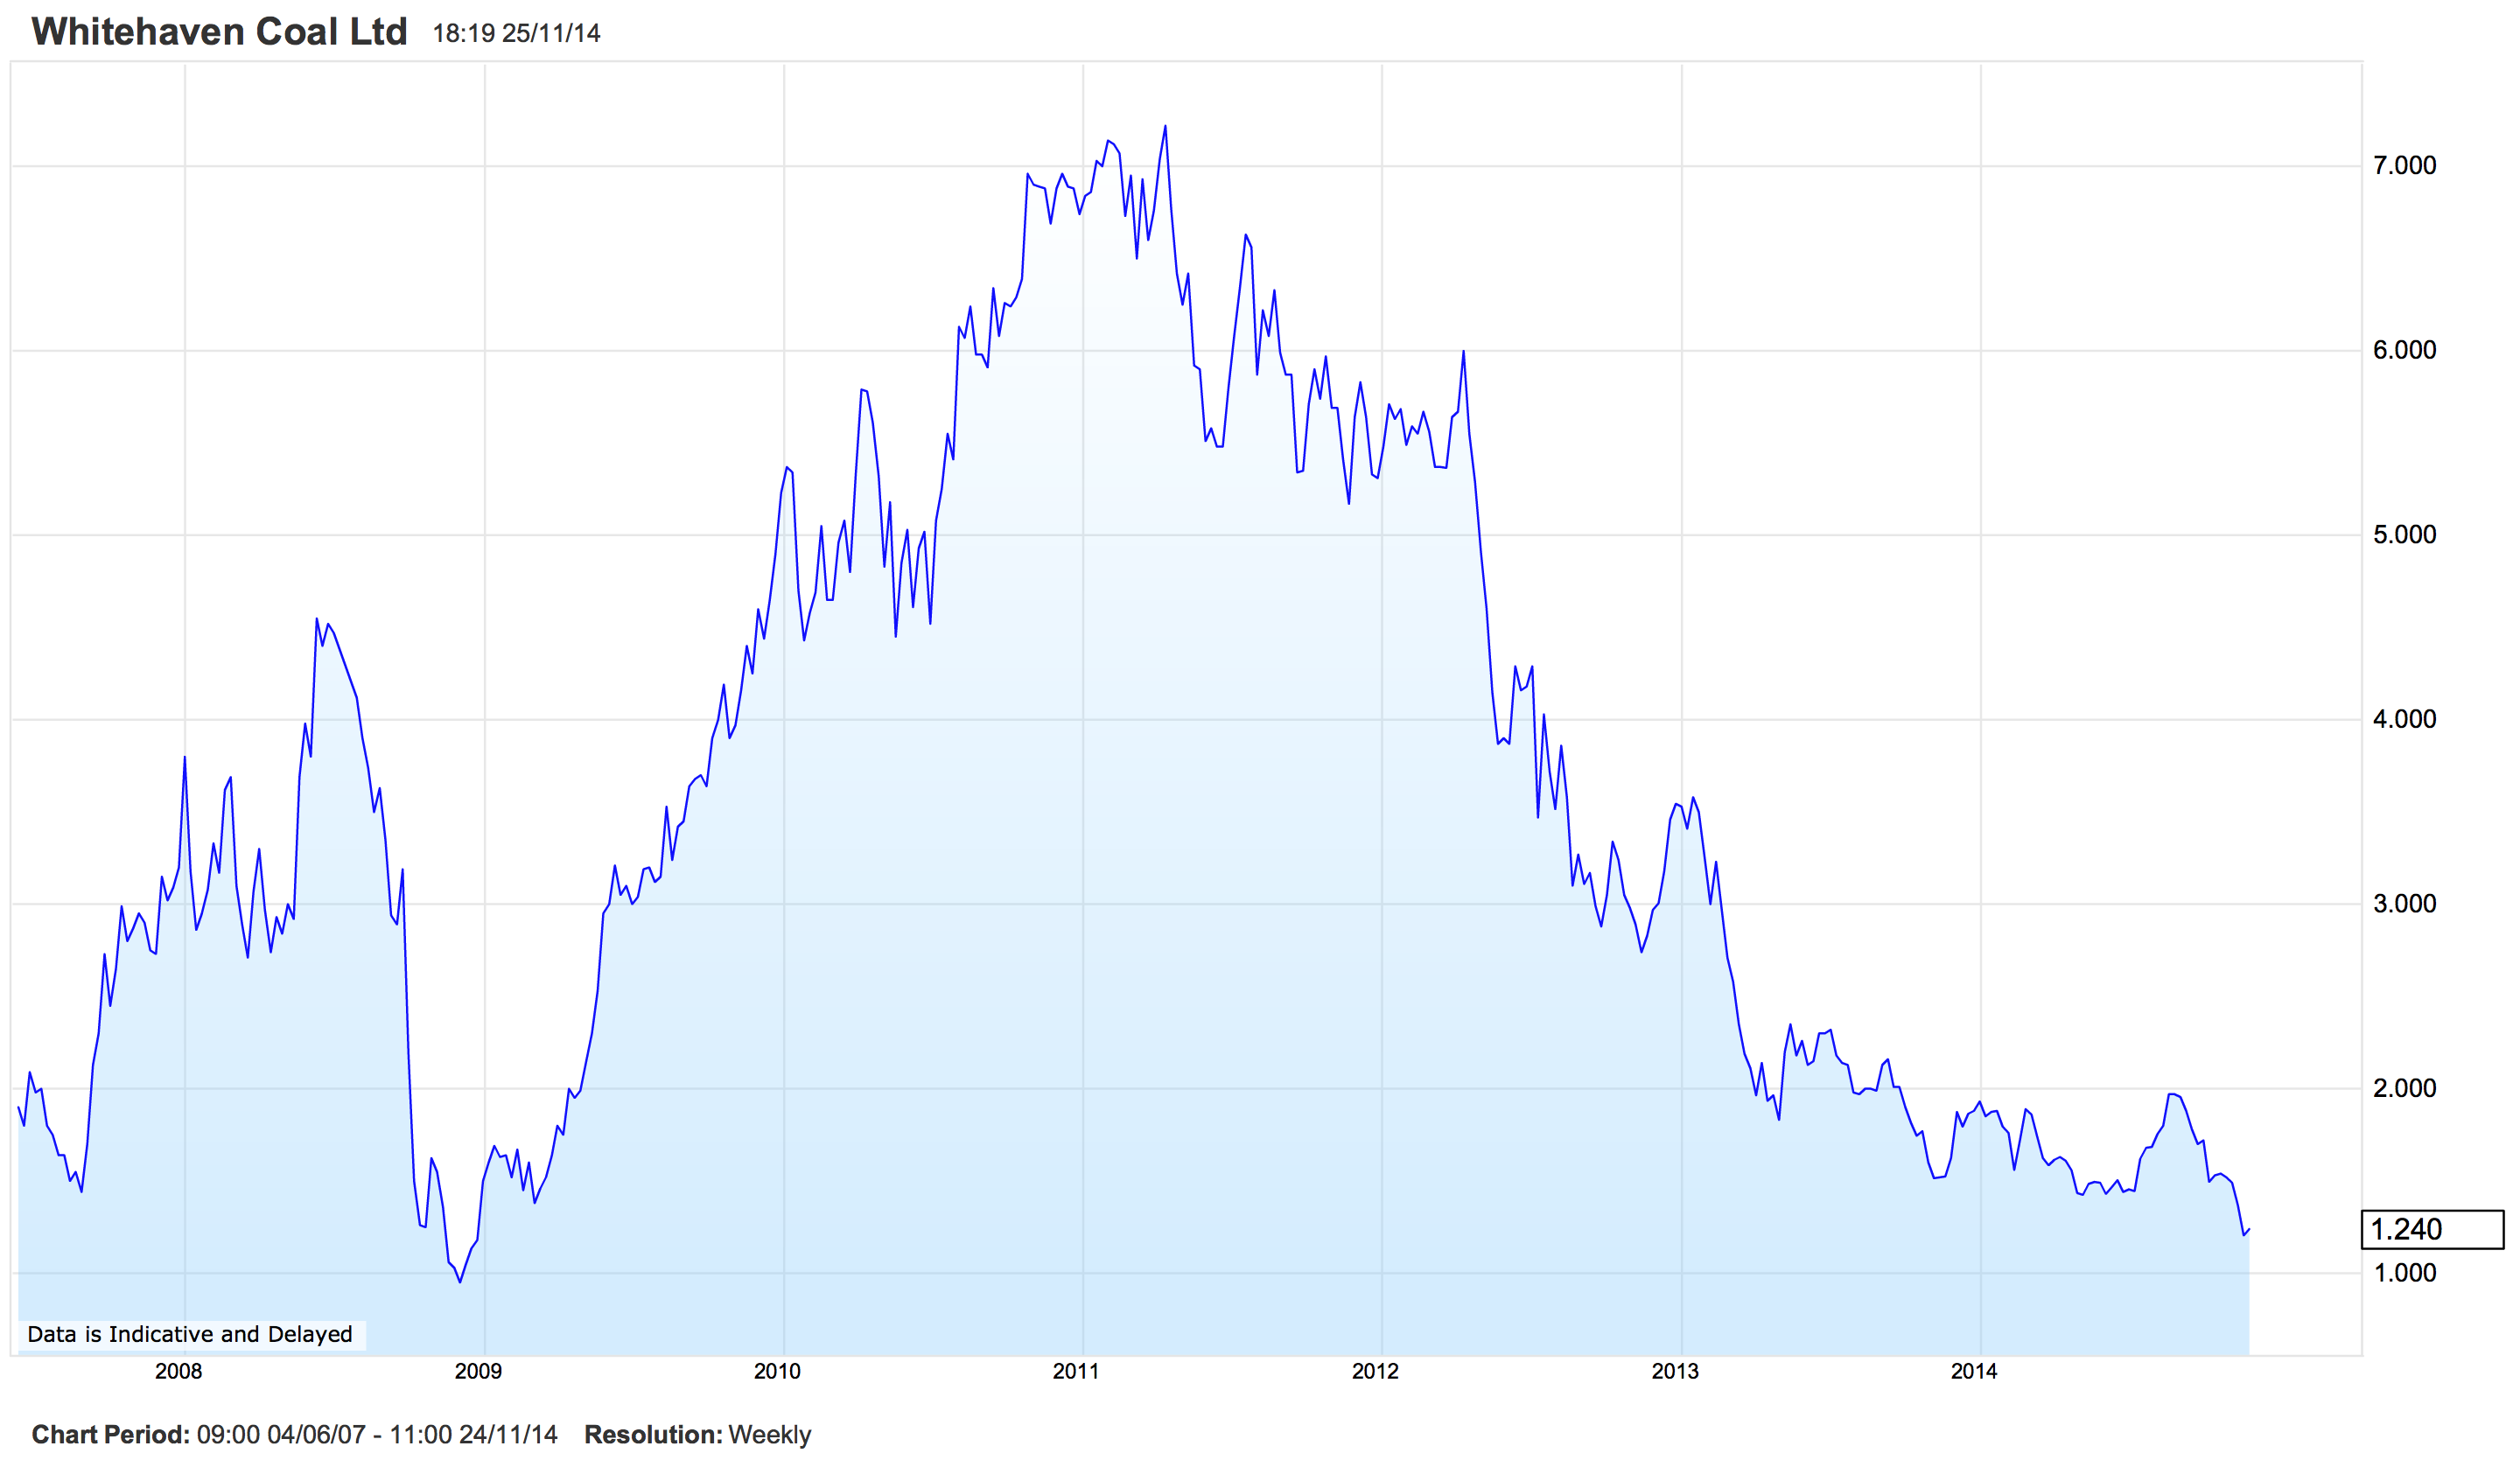
China’s demand for coal has underpinned the windfall in that sector over the last decade. Now that it’s facing severe environmental degradation and hazardous air quality, the government has announced a planned cap on coal consumption. Australia will need to look elsewhere if it wants to expand its export markets, and the only viable candidate really is India. India possess plenty of coal, but its inept state mining company has historically under-delivered. It is intent on changing this, with Power and Coal Minster Piyush Goyal recently declaring, “Possibly in the next two or three years we should be able to stop imports of thermal coal.” Whether this is achieved remains to be seen, scepticism is reasonable, but with China moving against it and oil and gas plentiful, it’s hard to get excited about the prospects for coal.
Whitehaven’s shareholders agree.

In any case, whether or not coal will enjoy an unlikely renaissance in a warming world isn’t of much relevance to my purposes here; there’s effectively zero chance of a short-term rebound in coal that will alter Australia’s interest rate outlook. As such, I won’t bother discussing coal in subsequent interest rate updates unless there’s some news of note.
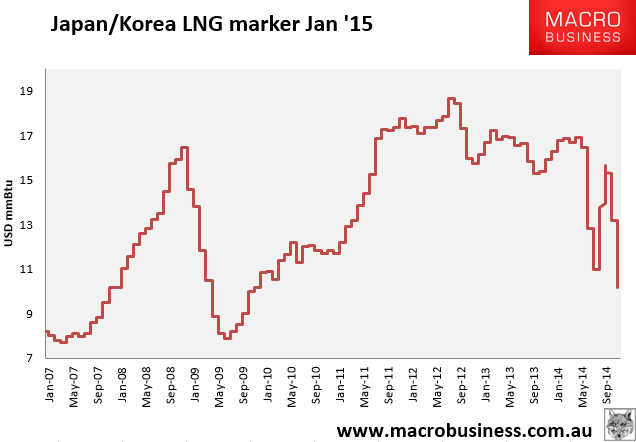
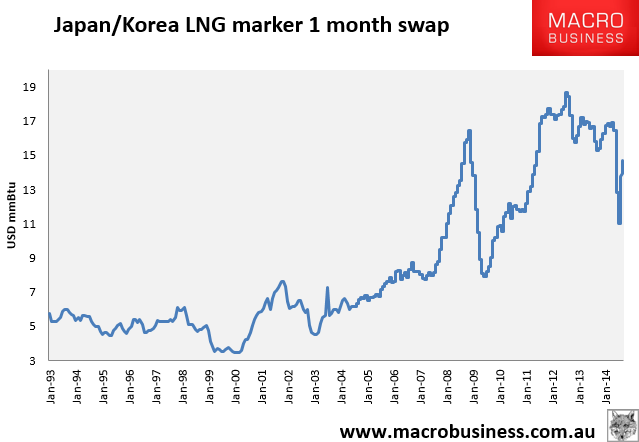
LNG is starting to get interesting. I haven’t got much in the way of LNG data unfortunately but this chart from David Llewellyn-Smith at Macrobusiness paints the picture.

LNG is mostly sold on long-term contracts linked to the price of crude oil. The above chart shows the Japan Korea Marker, a benchmark constructed by Platts and a proxy for the emerging spot market:
The Japan Korea Marker (JKM™) is the Platts LNG (Liquefied Natural Gas) benchmark price assessment for spot physical cargoes delivered ex-ship into Japan and South Korea. As these two countries take the largest share of LNG imports in the world, the JKM™ is thus a key reference in marking product value/market price from supply source to the destination market.
In the LNG market space, traditional patterns of trade are evolving fast; where cargoes once changed hands only through opaque bilateral deals, the market now exhibits open sell and buy tenders for multiple and single cargoes, brokered trades, cargoes sold in longer chains and speculative trading positions taken up by non-traditional players, adding to liquidity on the spot market.
The recent collapse in spot prices is all the more concerning coming as it has in the lead up to the northern winter. As you can see on the chart above, we’ve seen prices rise in previous years ahead of stronger winter demand.
Weak domestic demand has seen Kogas, South Korea’s monopoly gas supplier, pare back on purchases recently. From Platts:
Kogas, which has a monopoly on domestic natural gas sales, sold 27.6 million mt of LNG over January-October, down 9.6% year on year.
The state utility attributed the decline in domestic LNG sales to the restart of some nuclear power plants, higher coal demand for power due to its relatively lower prices than LNG and weaker power demand due to unseasonably mild temperatures.
And the following is of particular importance:
Kogas plans to work with other Asian LNG buyers to phase out the “Asian premium” that has plagued the region in the past due to the lack of bargaining power and rigid pricing practices, he said.
LNG importers in South Korea, Japan and Taiwan have traditionally paid more for LNG cargoes due to oil-linked contracts and a lack of alternative energy sources.
“Kogas will push for joint purchase of LNG with Asian importers as part of efforts to ease the Asian premium,” the executive said. “Importers in South Korea and Japan would have the same voices.”
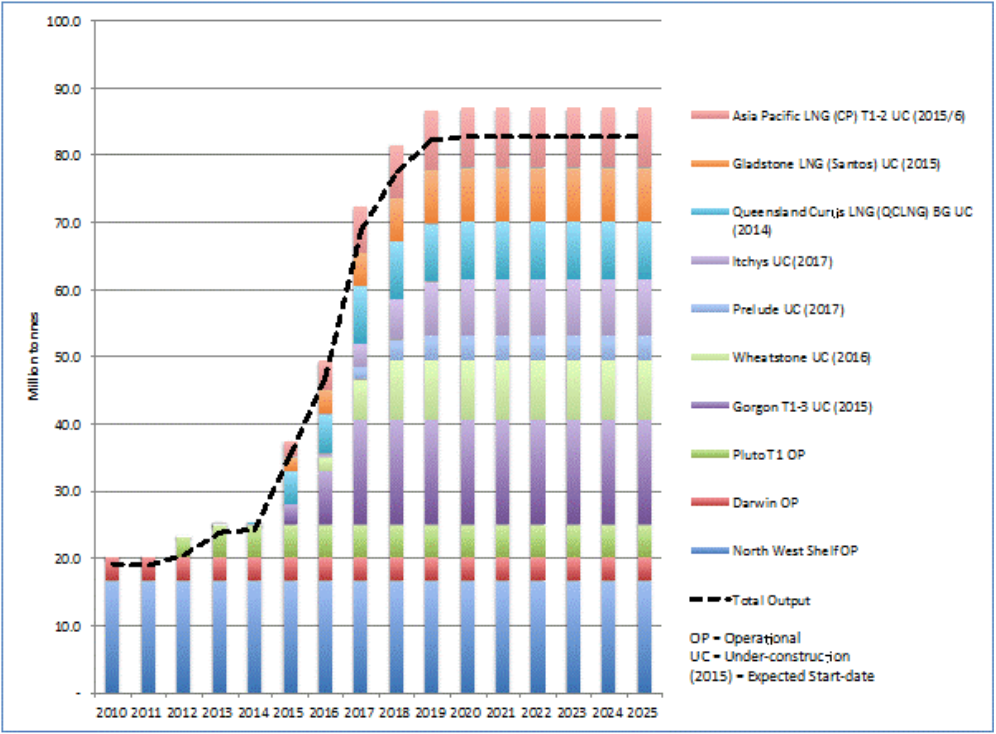
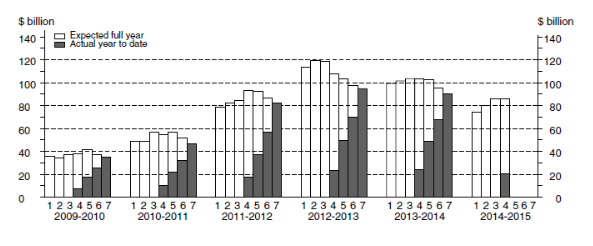
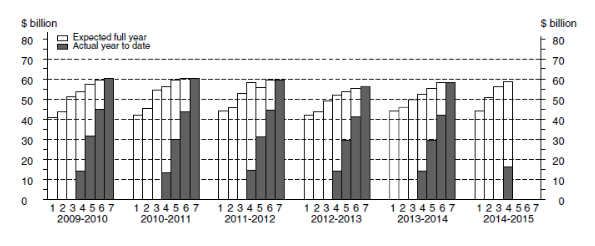
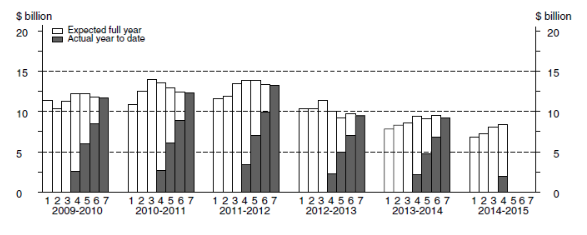
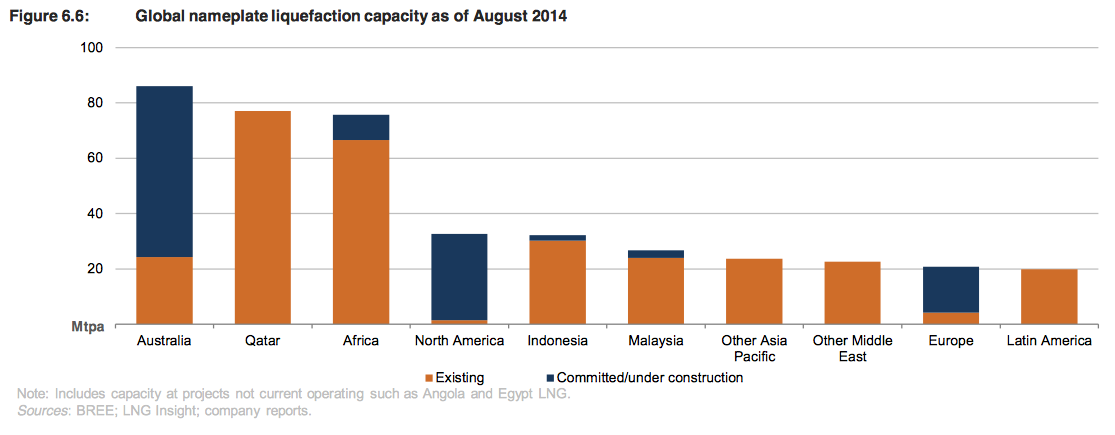
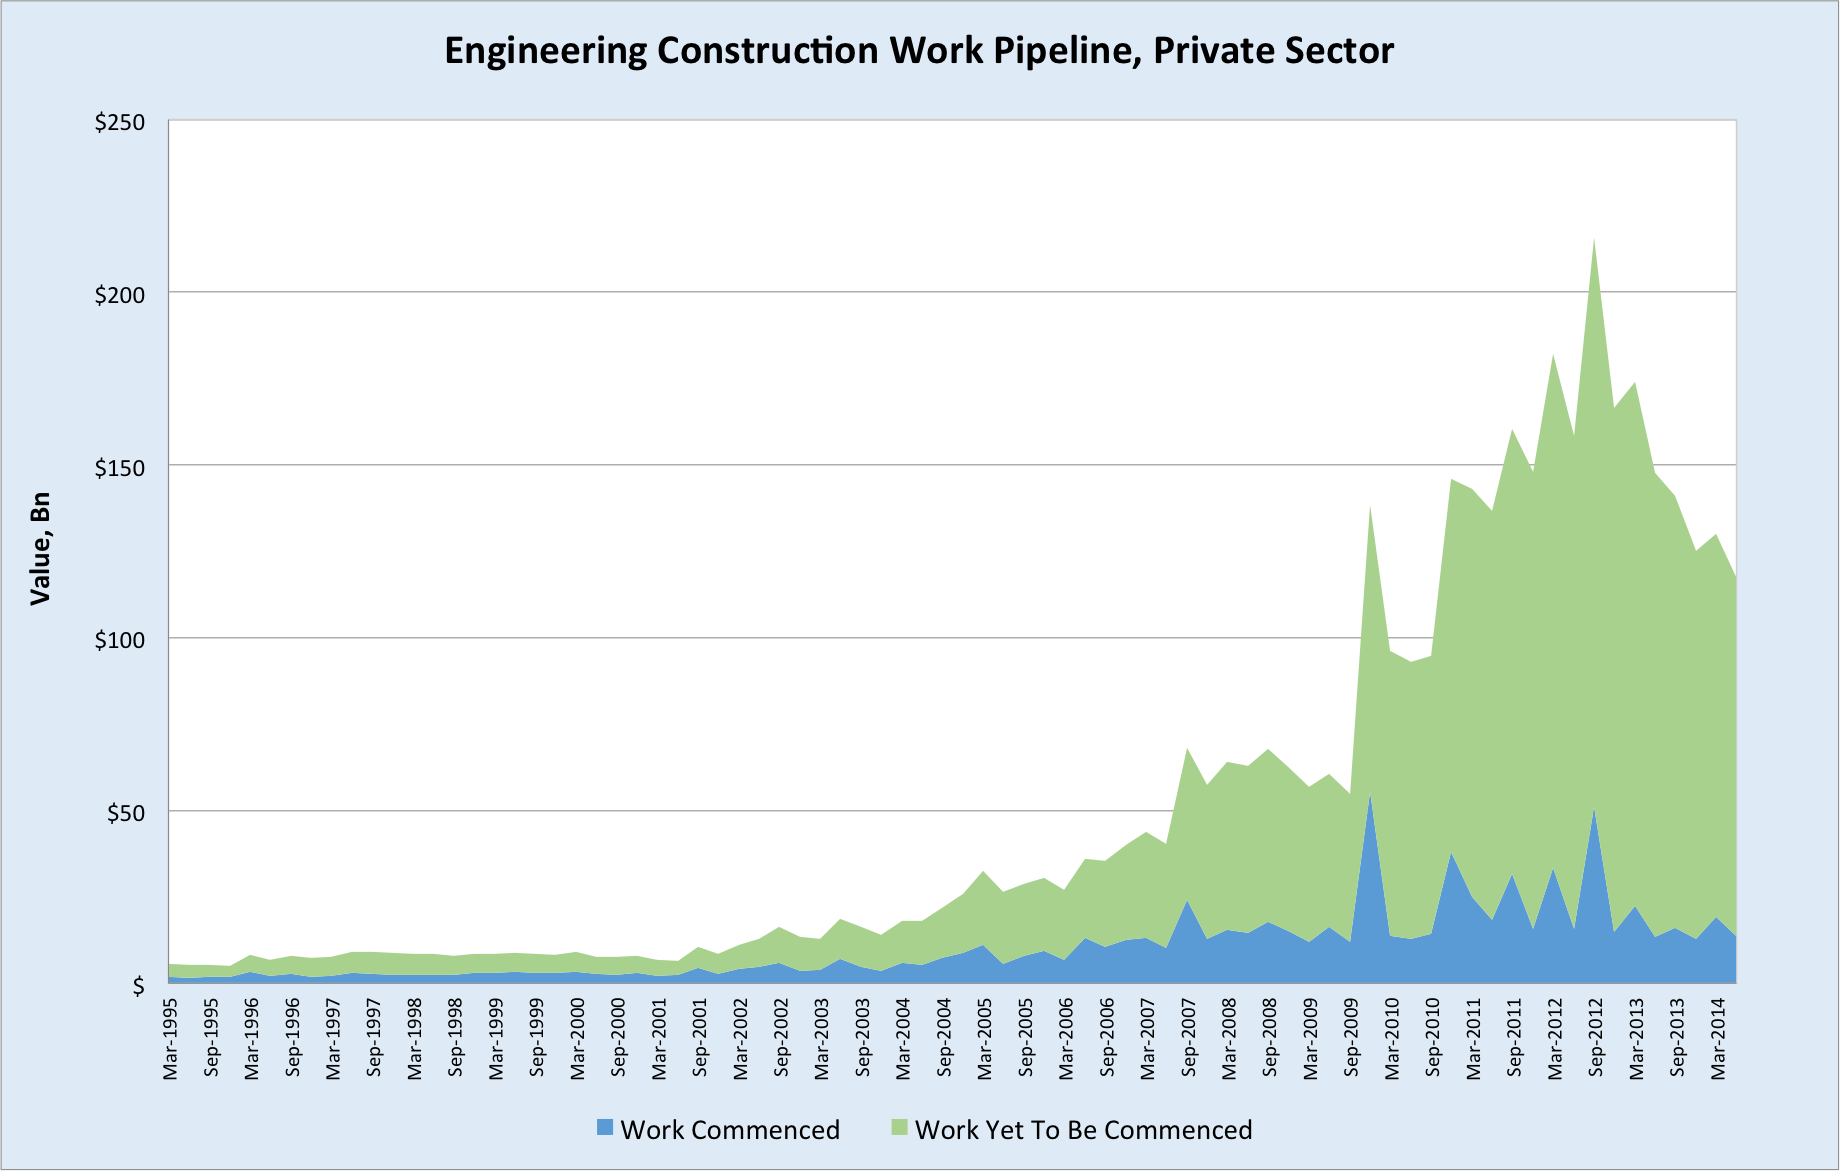
Asian demand is reasonably well satisfied at present, yet LNG deliveries to East Asia are set to explode over the next 5 years. Here is the volume expansion from Australia alone (taken from The Future of Australian LNG Exports):

Add in significant expansions to North American LNG capacity, which will arrive a little later than Australian LNG, along with Russian pipelines to East Asia, and you have an emerging gas glut in the Asia-Pacific region. (Though admittedly many of the mooted North American projects will be looking doubtful after the oil price crash.) Thus it’s fair to say an ‘iron ore moment’ is looming over LNG from next year onwards.
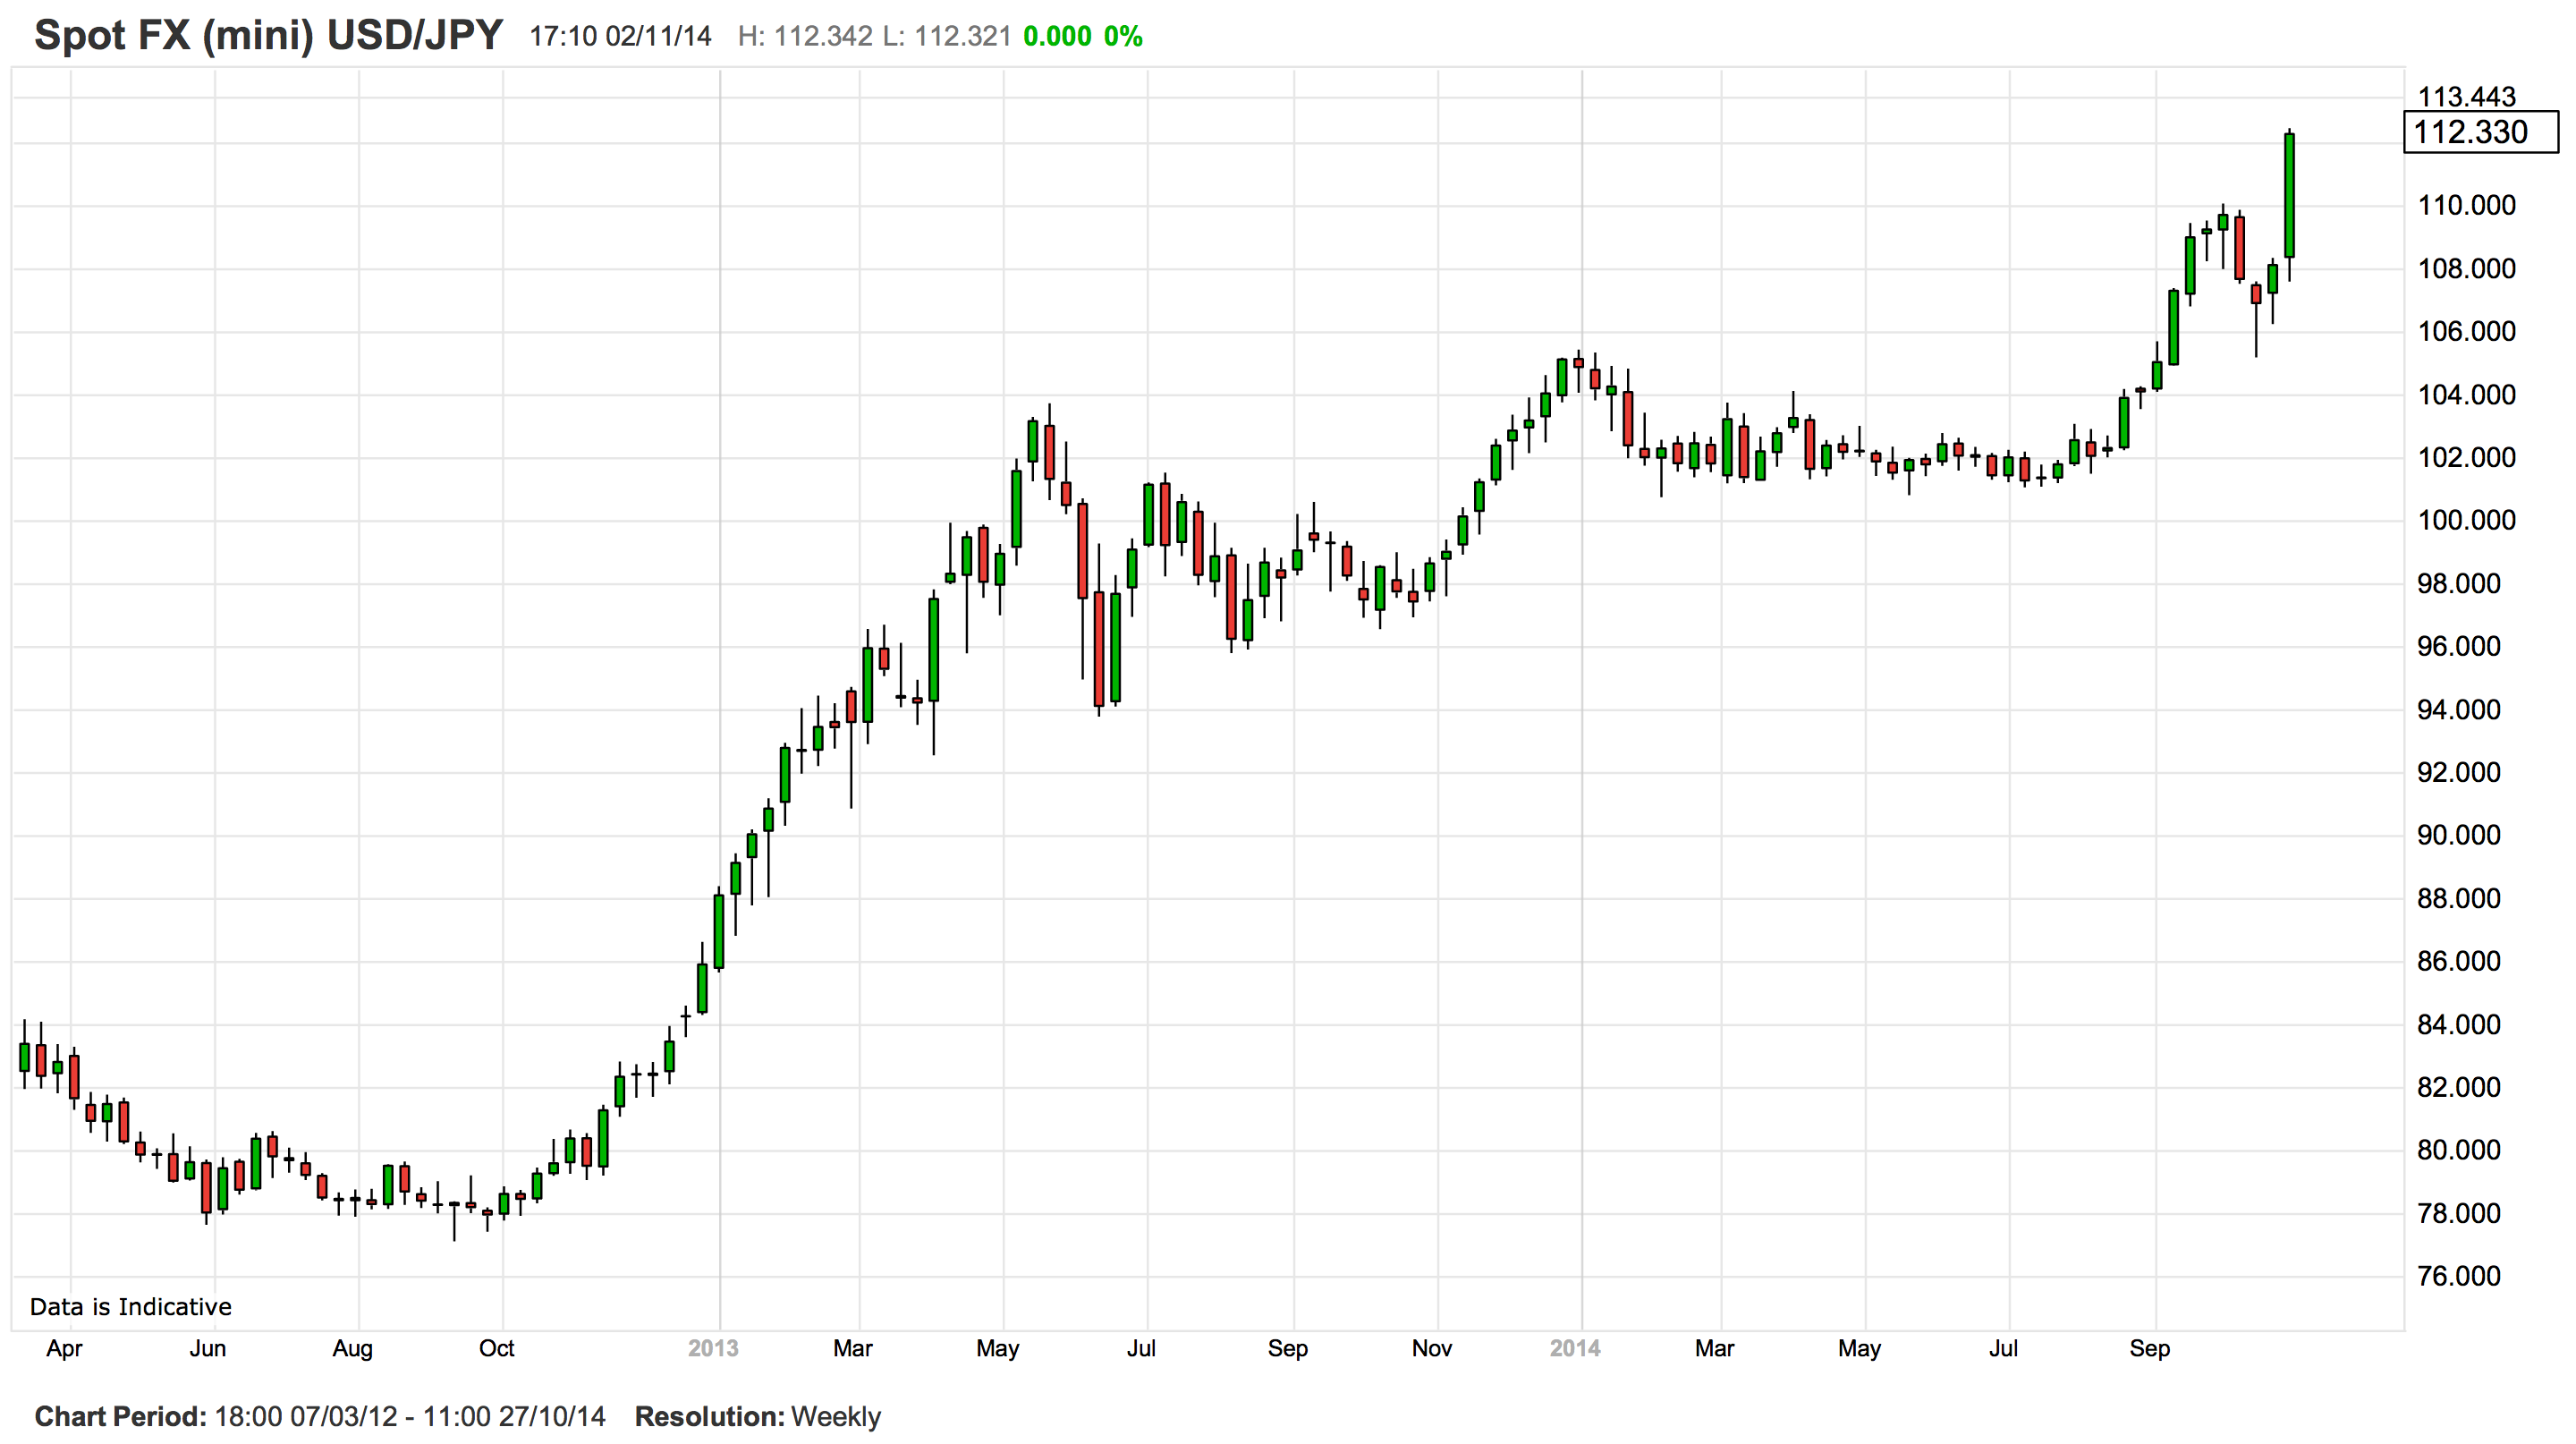
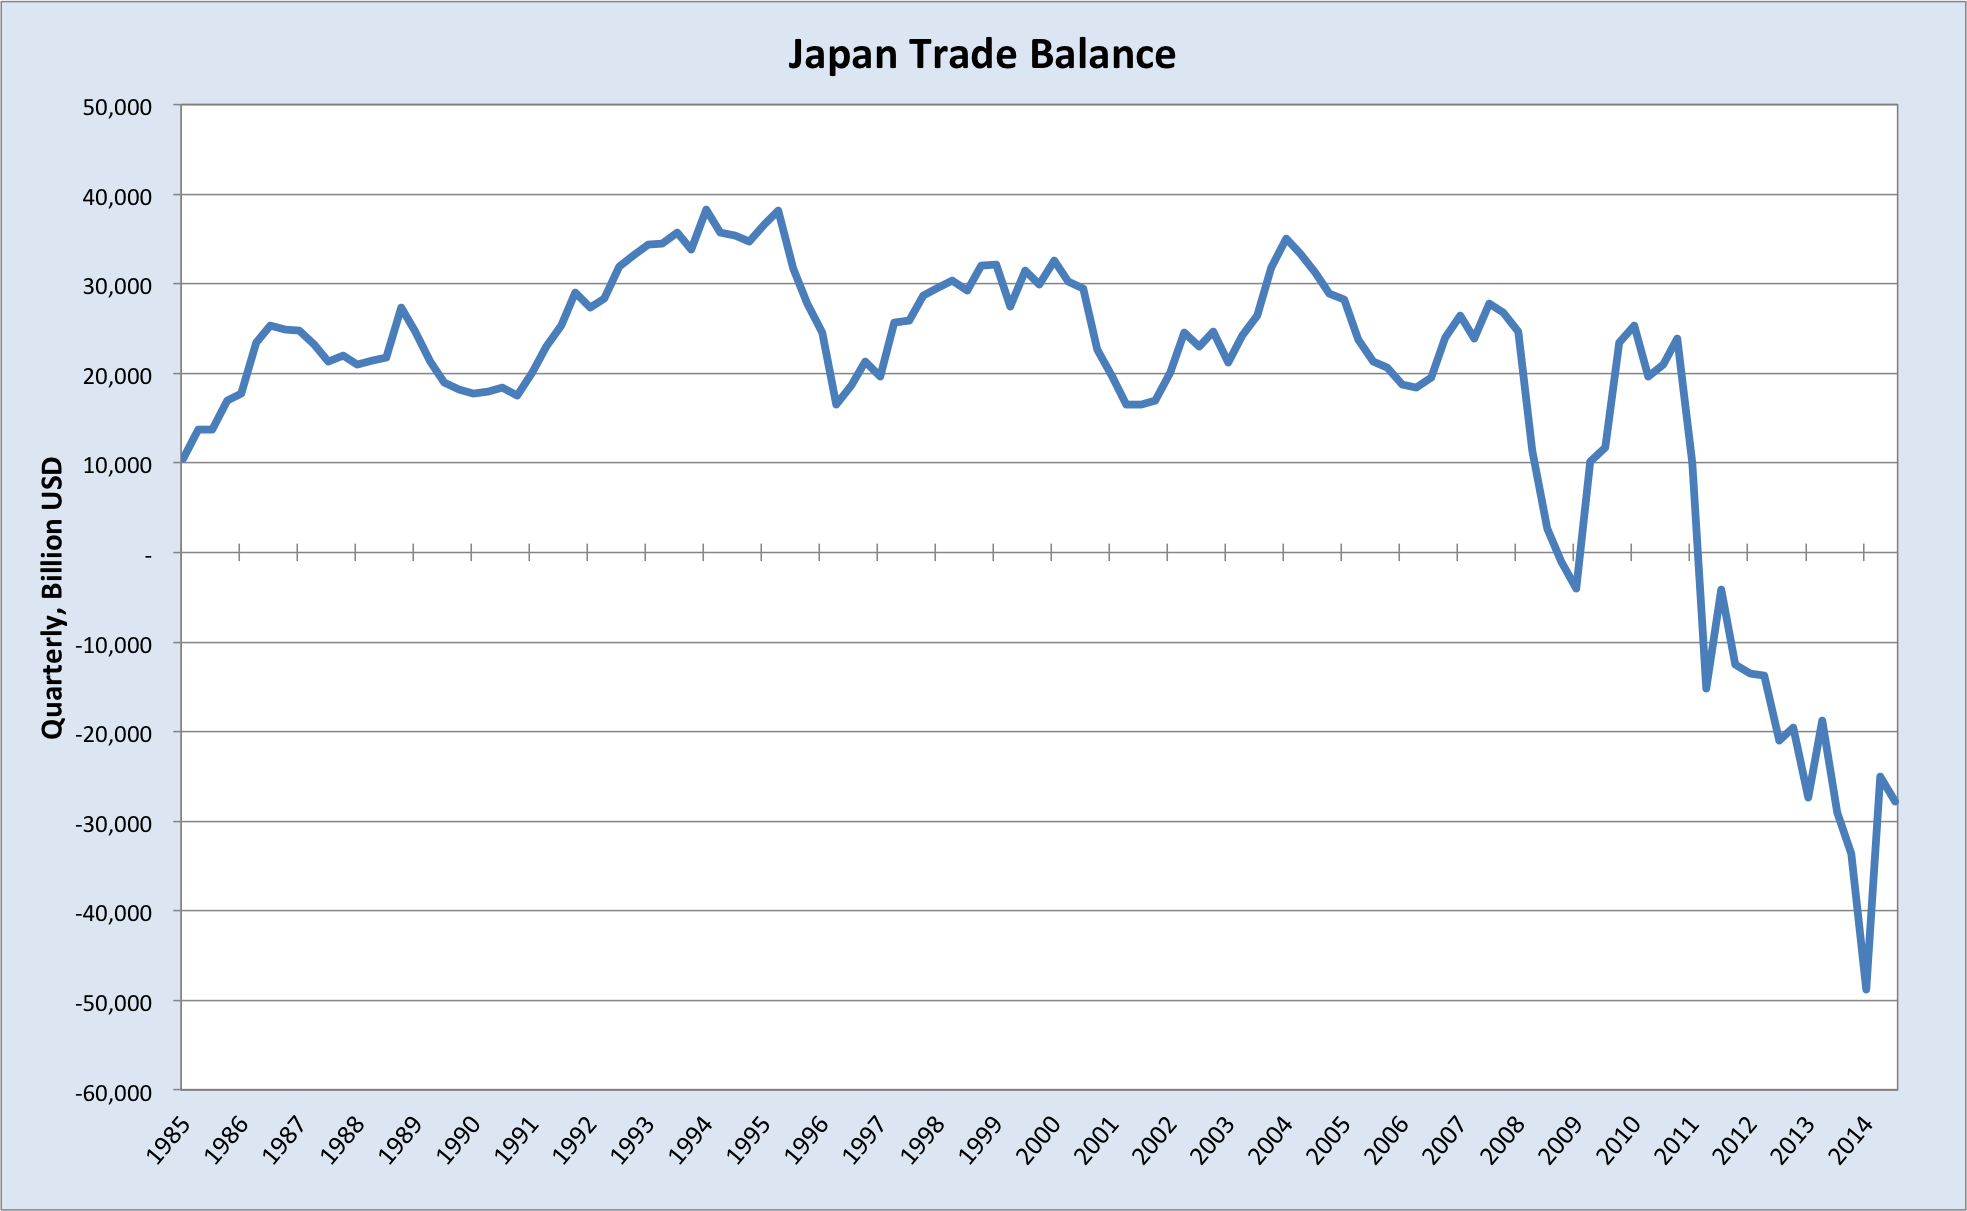
As I have argued in the past, Japan’s currency devaluation raises risks of a large-scale shift back to nuclear power, since the economics of importing energy is very poor when they have so much capital invested in a cheaper alternative. Prime Minister Shinzo Abe favours restarting the reactors, but public opinion remains largely hostile to this, given the Fukushima disaster. Japan’s snap election on December 14 could therefore turn out to be of considerable importance to the fortunes of Australian LNG; a strong mandate for Abe would likely see him press ahead with reactor restarts, adding more pressure to LNG spot prices.
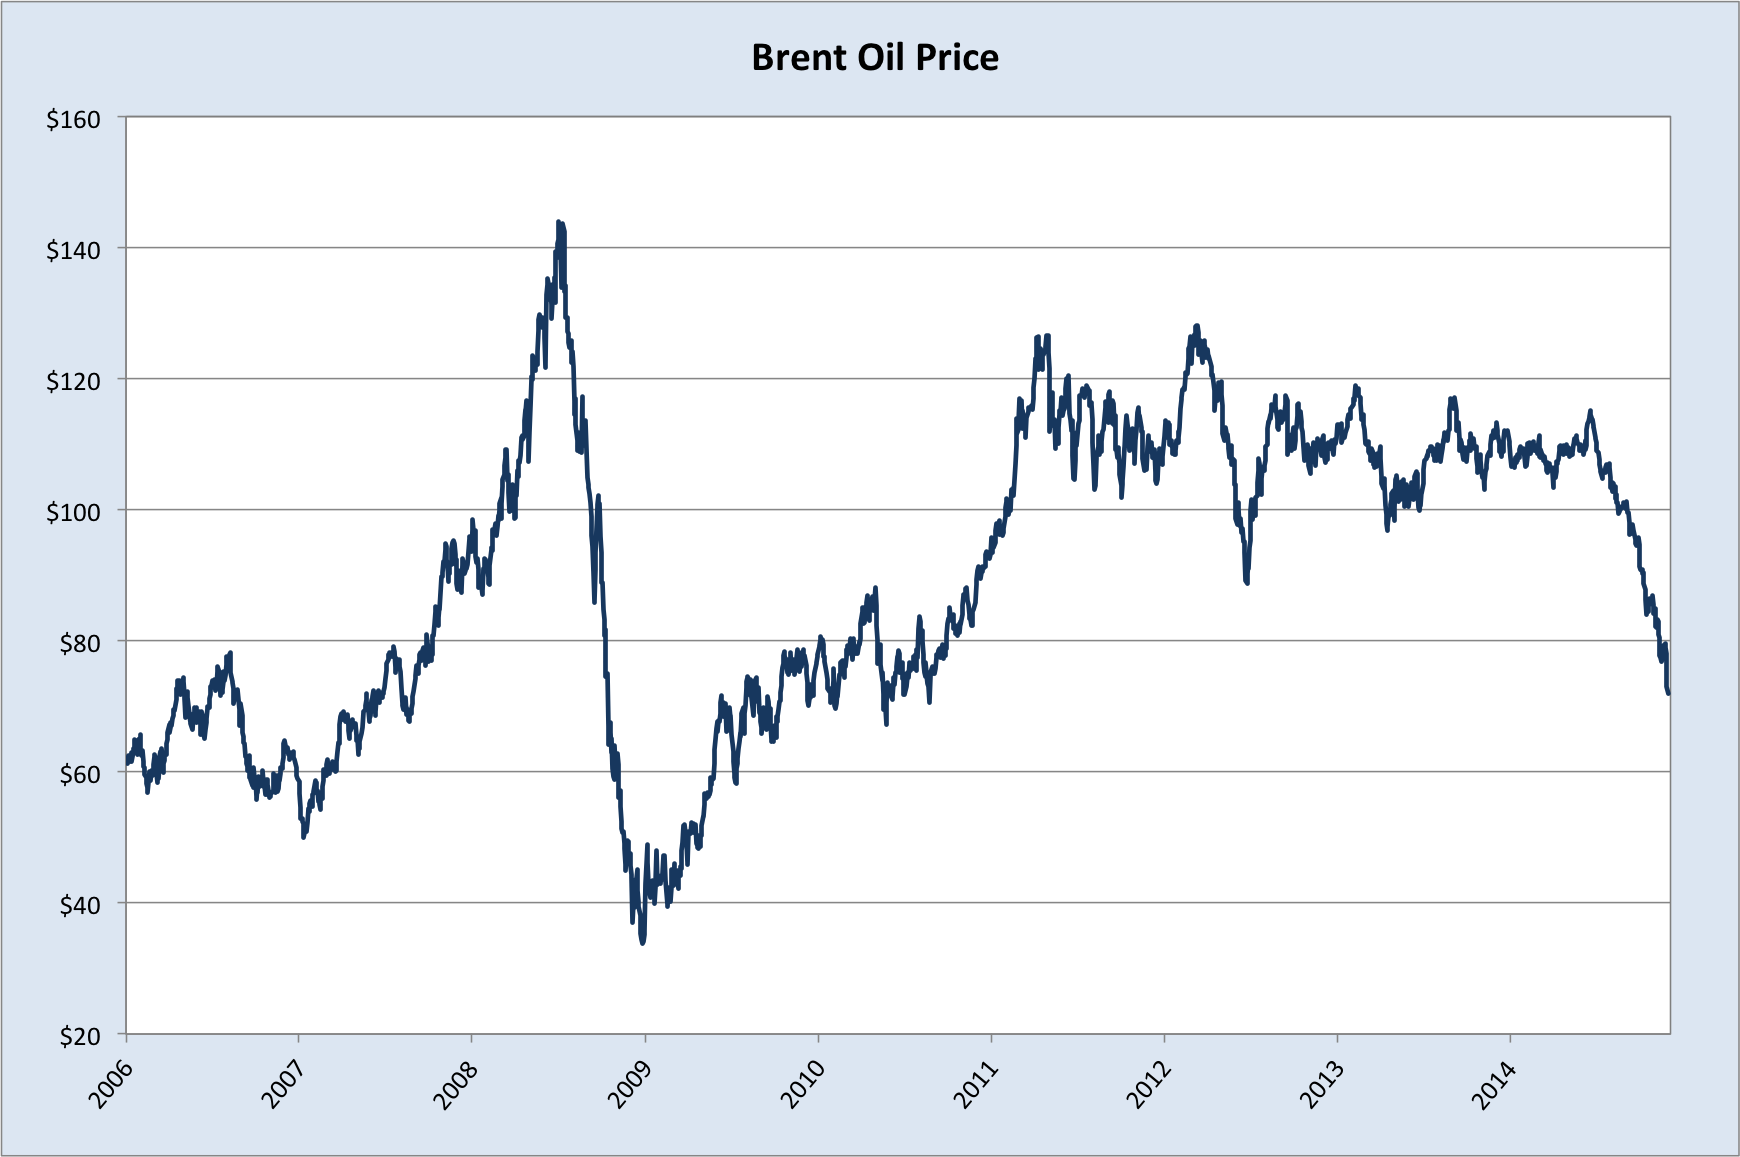
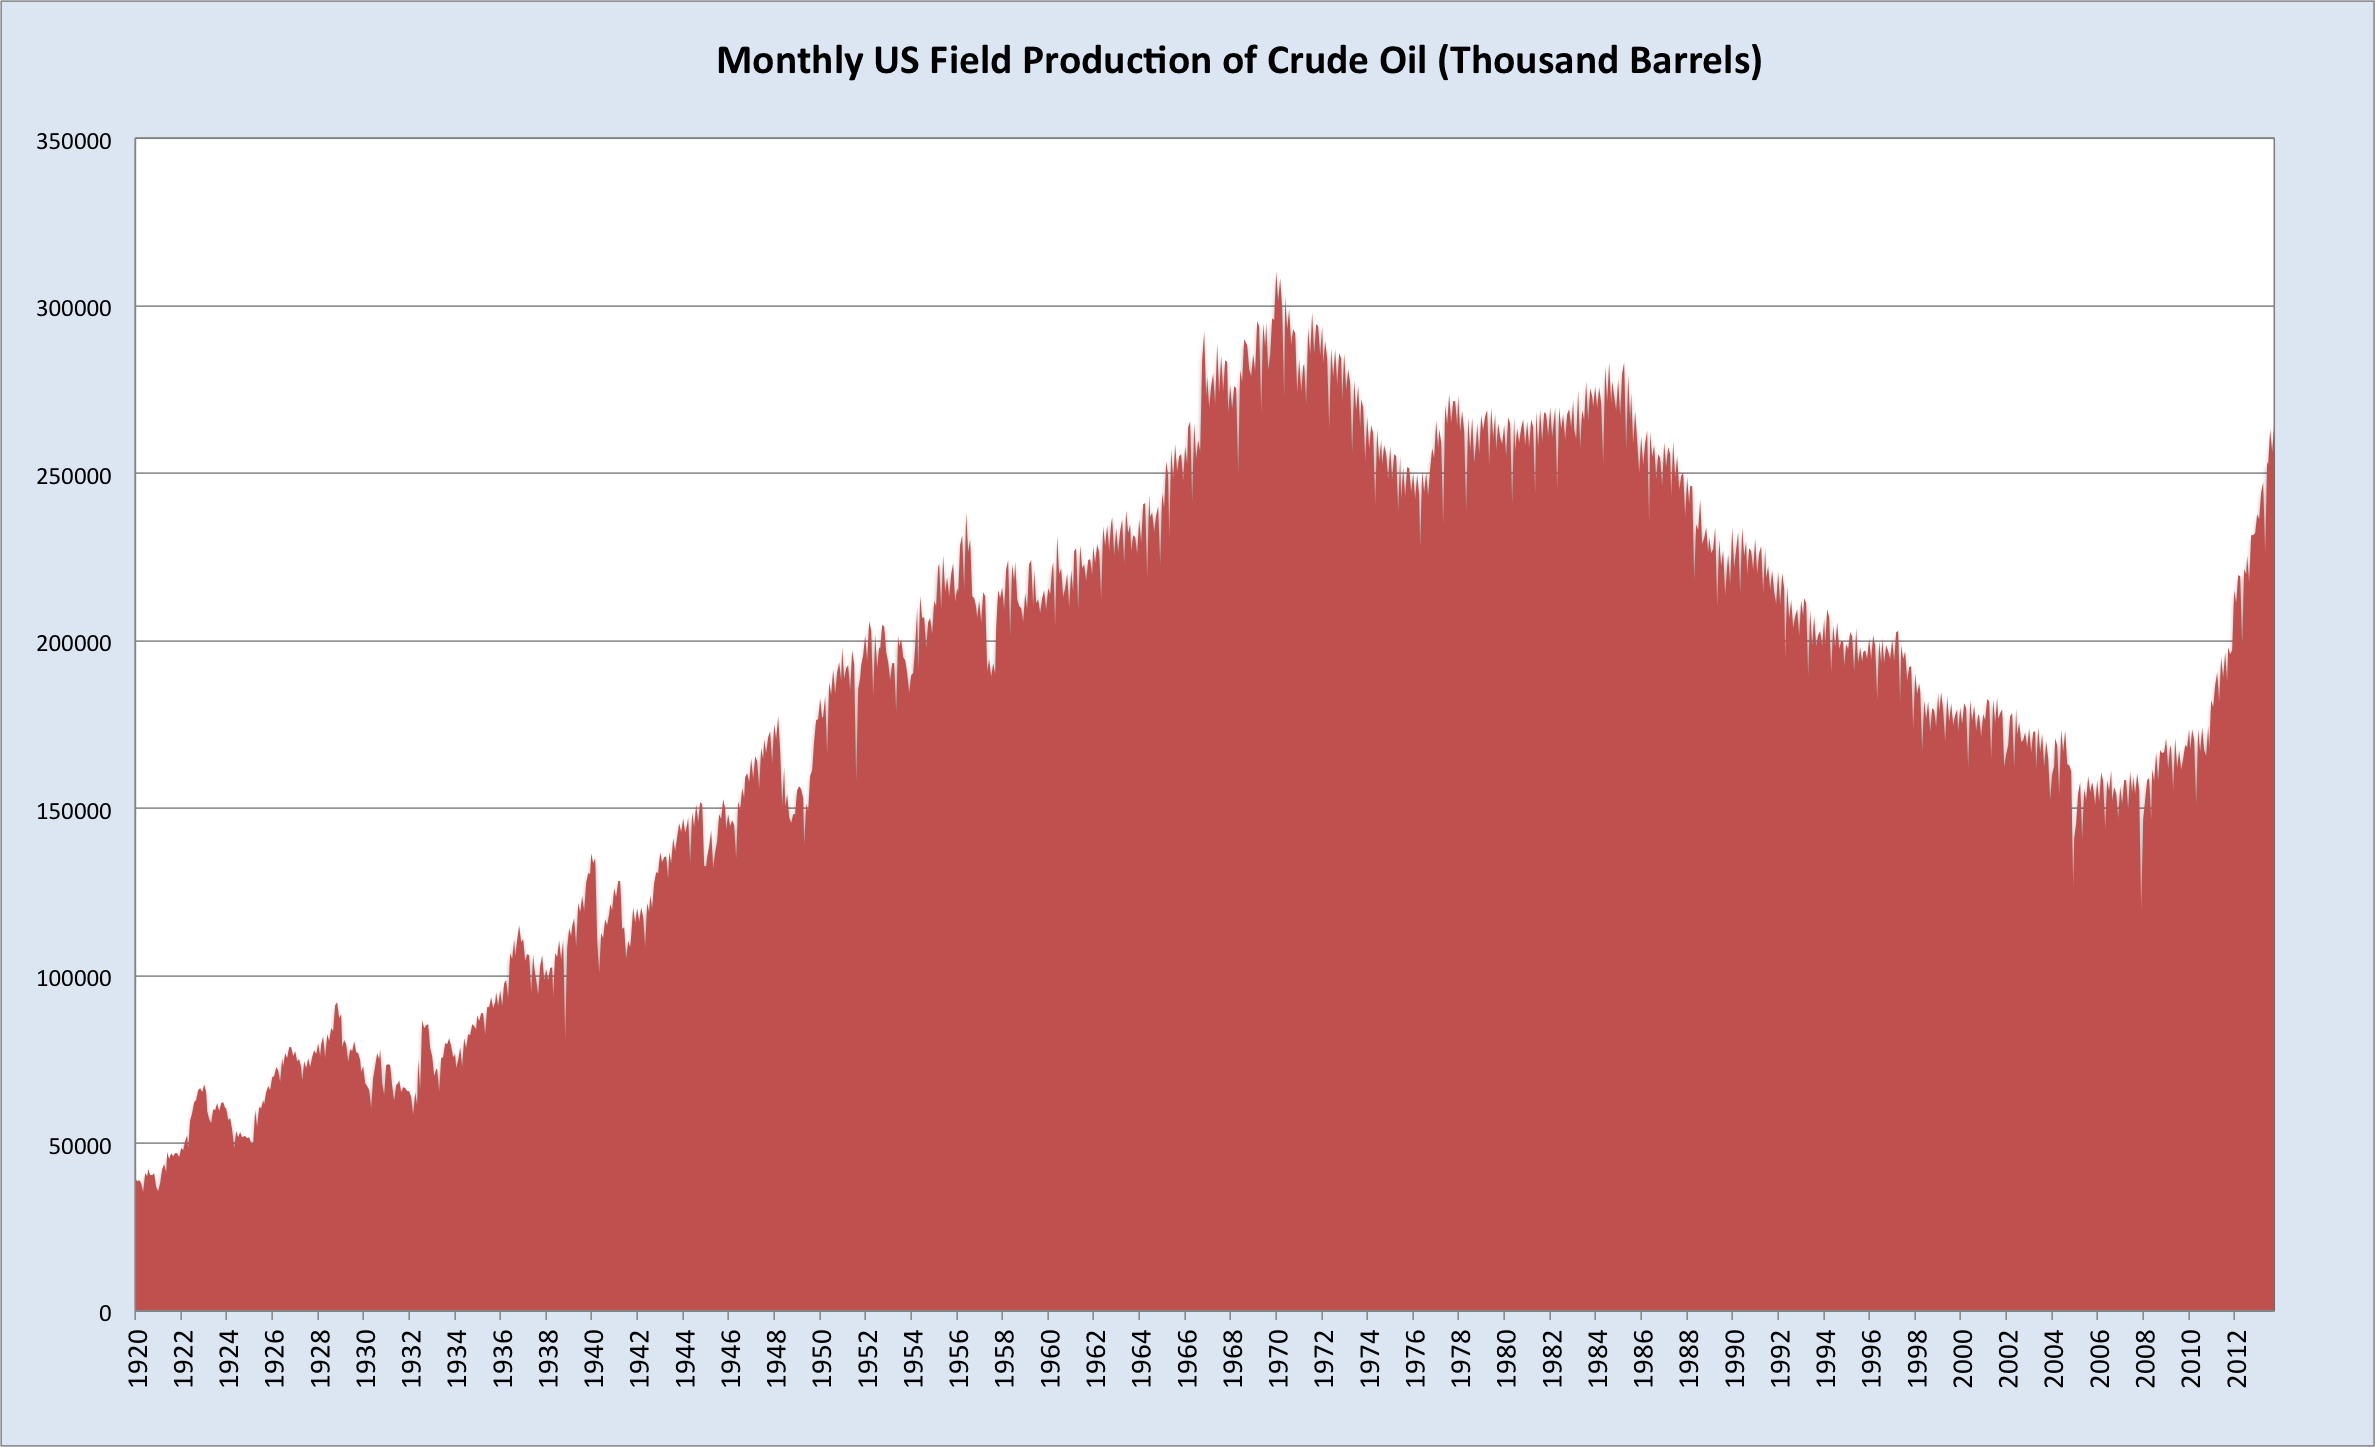
Of course, Australian LNG is mostly sold on long-term contracts linked to the oil price, so concerns around an emerging LNG surplus are academic right now, what with the collapse in oil.

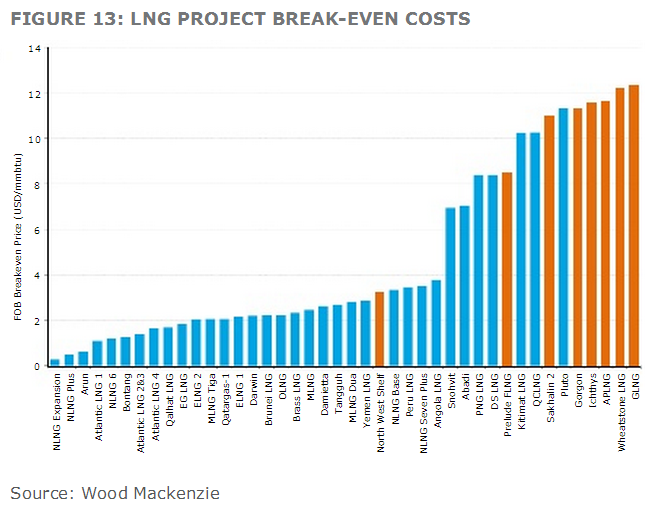
The latest hit came last night after OPEC conceded it has no plans to cut production in the face of lower prices. This represents a momentous shift in the dynamics of the oil market, with volatility appearing to be the new normal. In the short-term, many analysts believe $60 is in play, meaning utter carnage for Australia’s gold-plated LNG projects, which are all among the most expensive in the world.
In any case, LNG is not going to provide much of a boost to the economy once it starts leaving our shores in record volumes, even if the oil price does rebound next year. Employment will be much lower in the operational stage than during the construction phase, and the squeeze on east coast gas supplies will hurt local industry. The only real positive effect will come via higher tax receipts, and obviously these are looking fairly lean now.
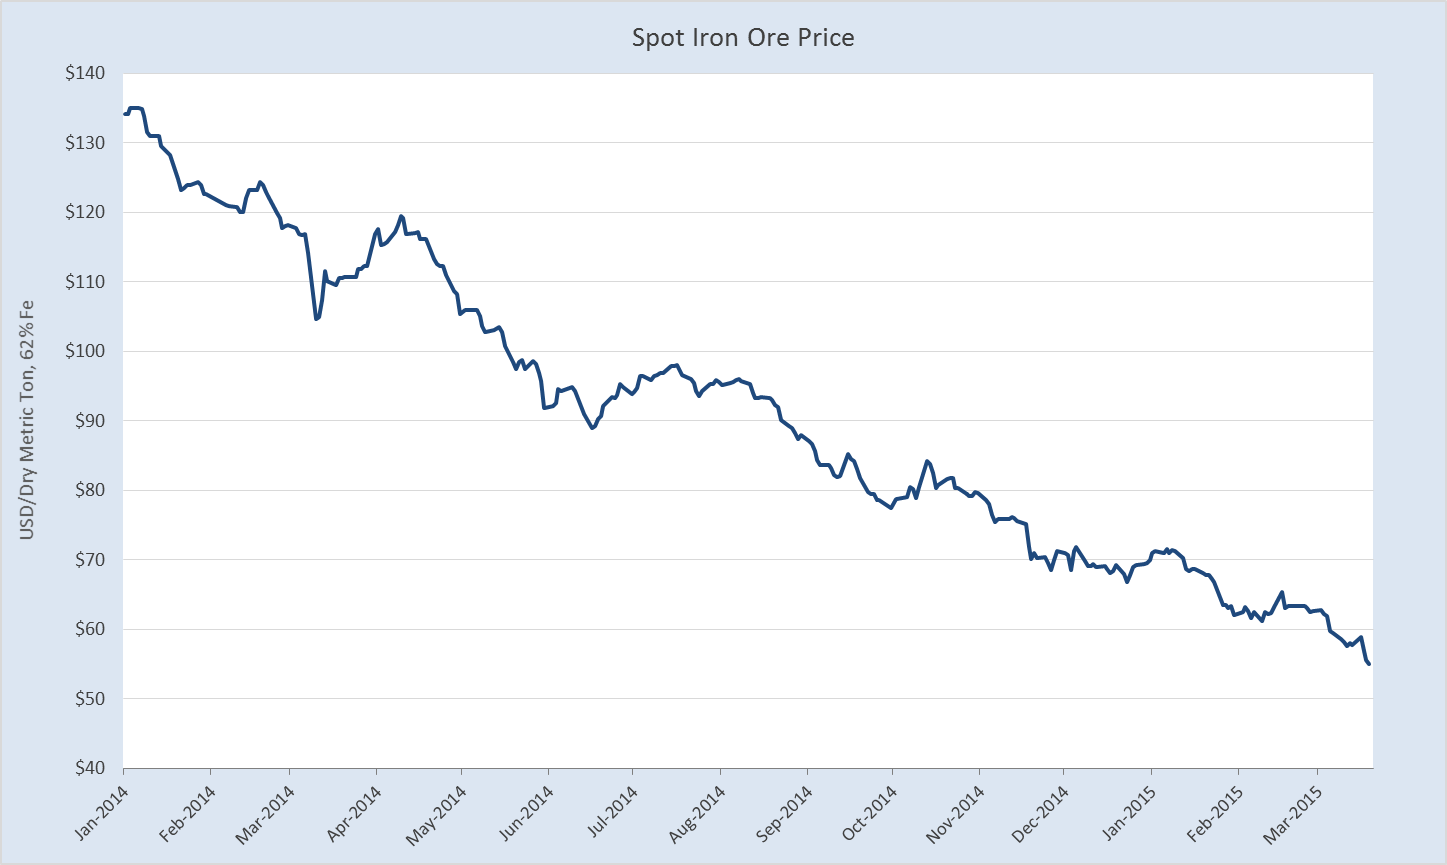
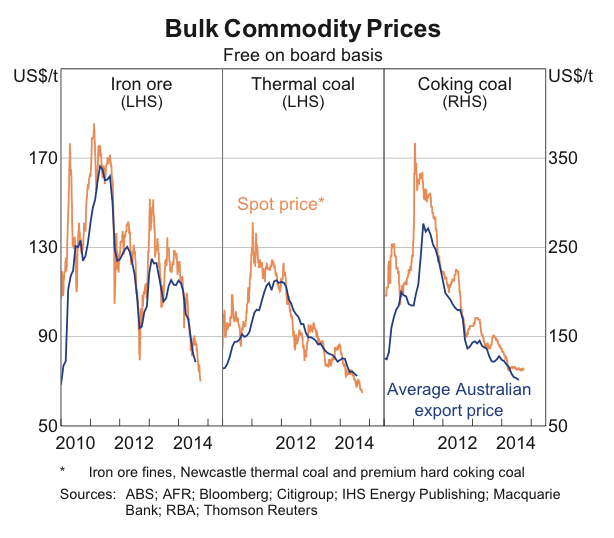
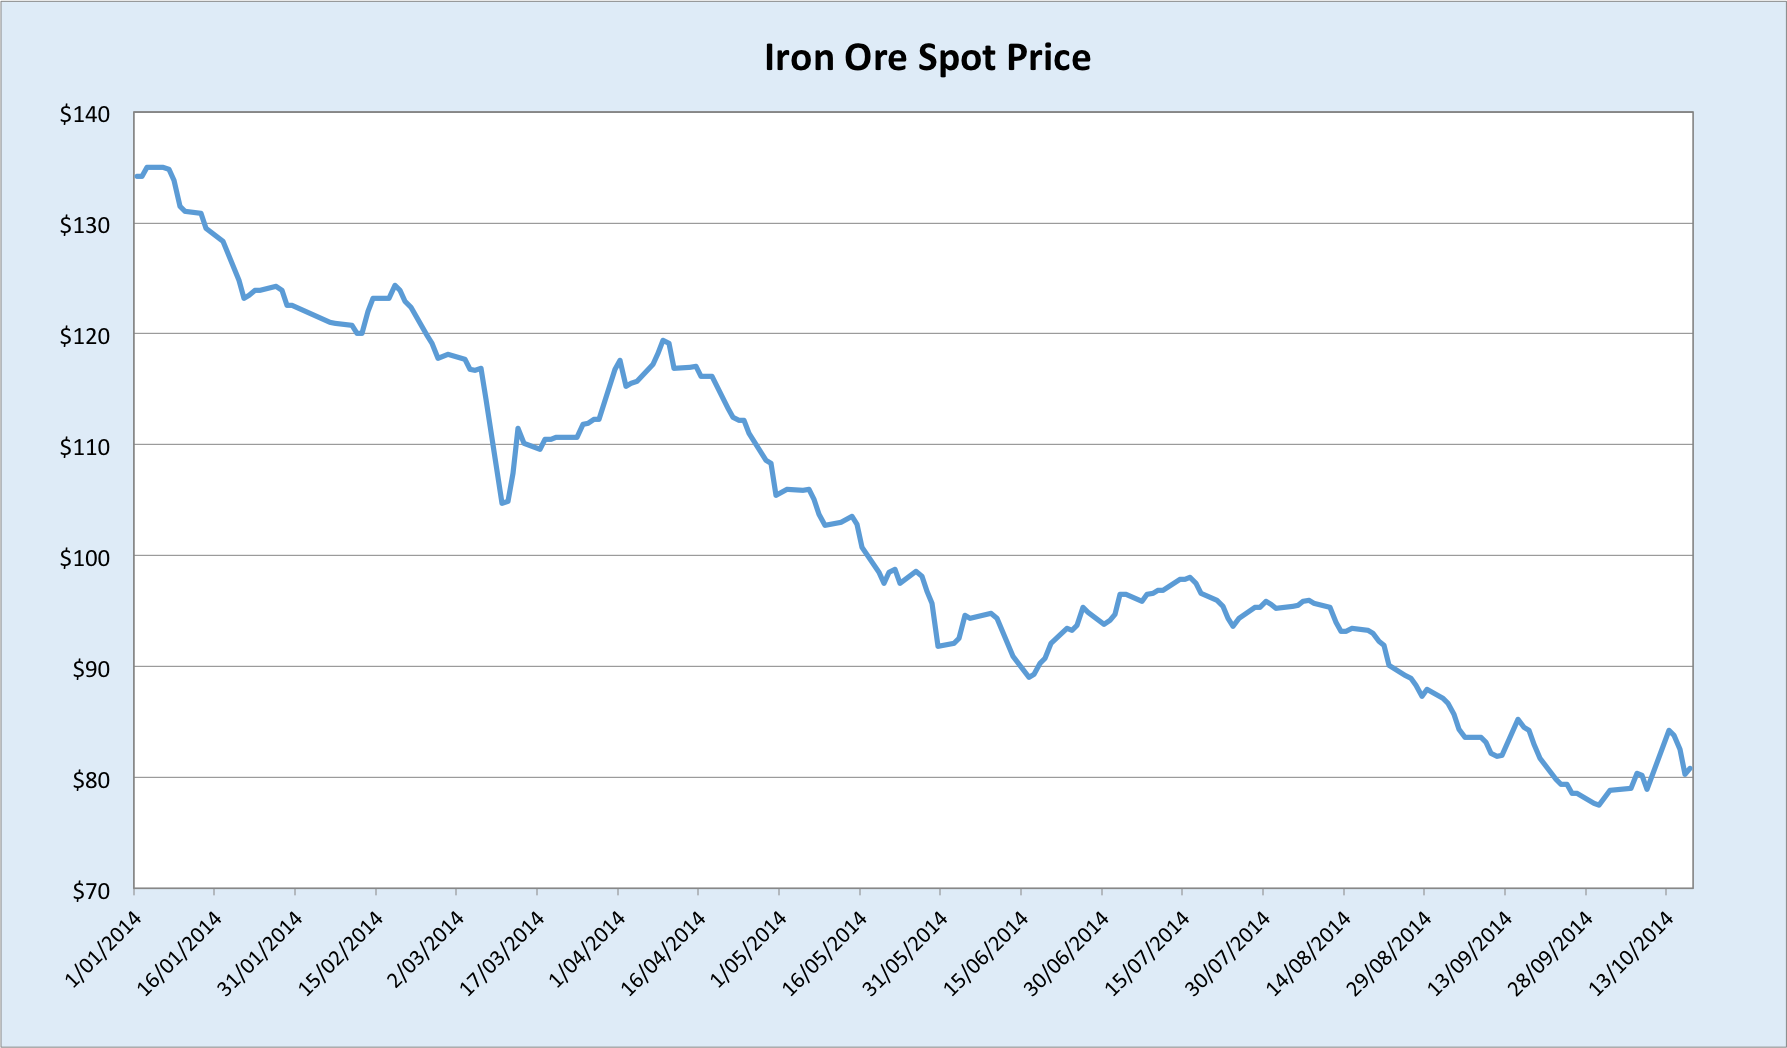
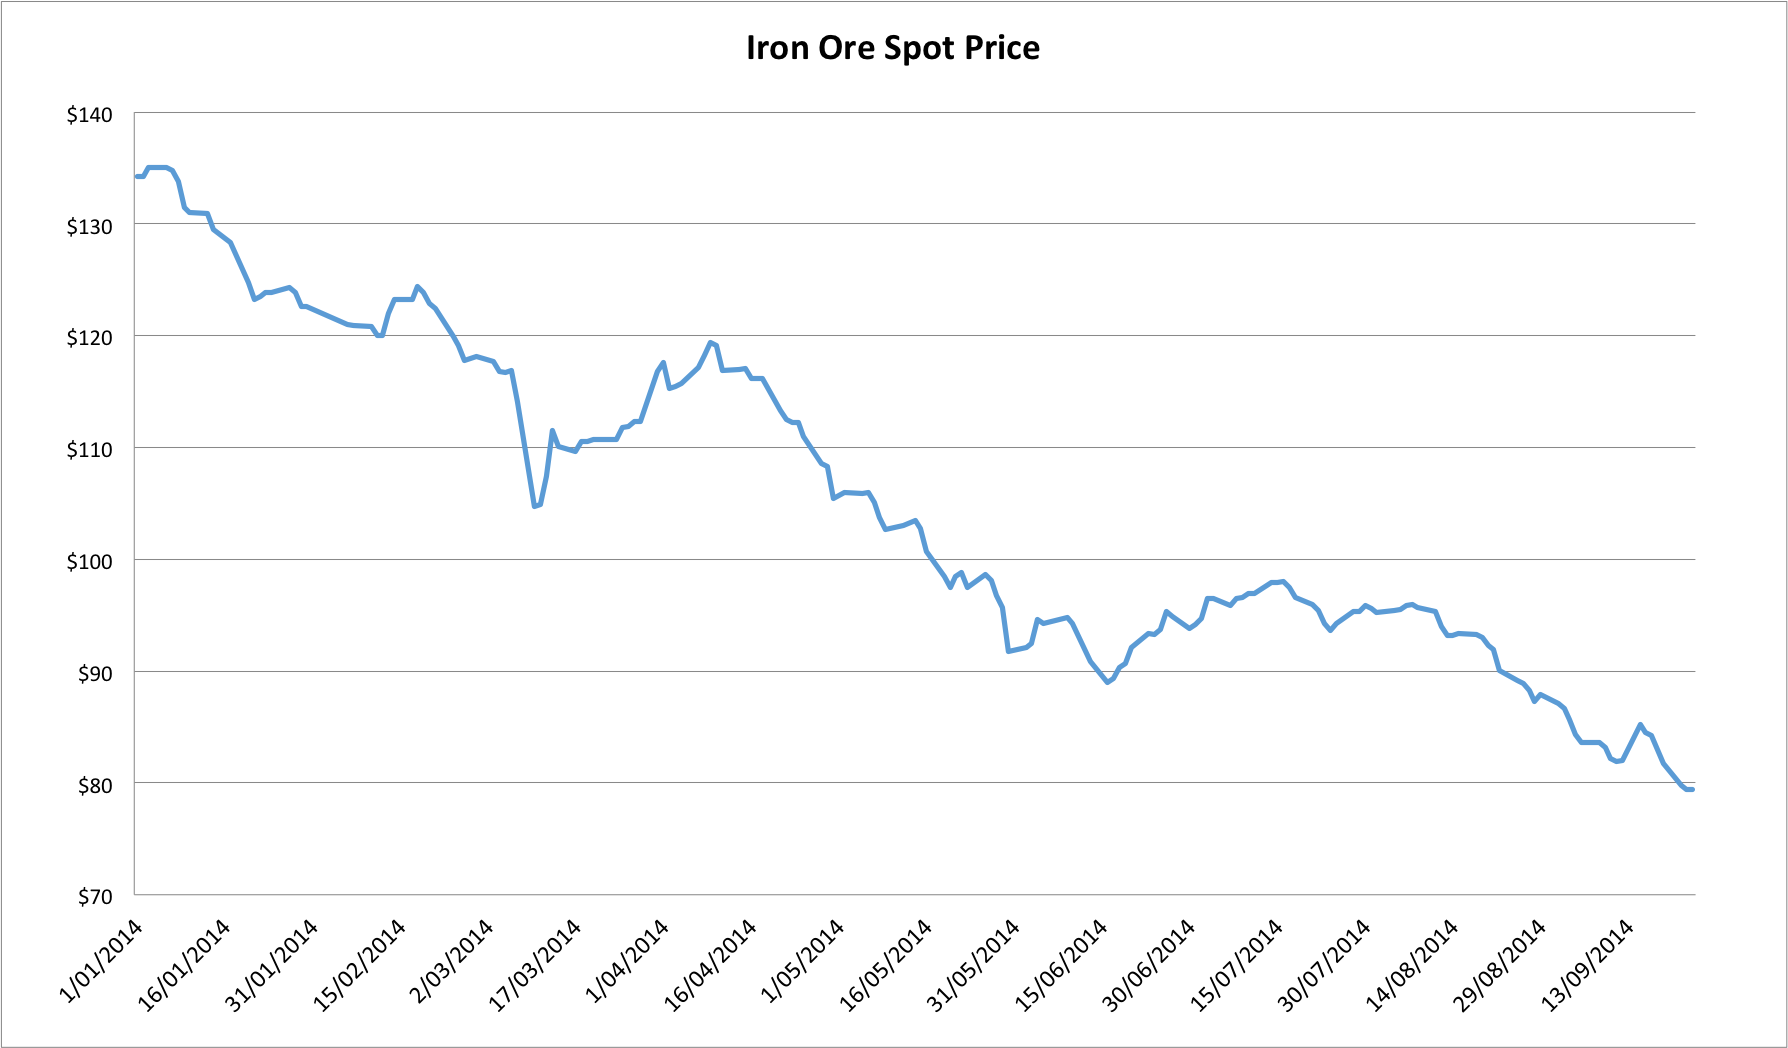
Iron ore has been bludgeoned over the last month, notwithstanding more positive price action over the past couple of sessions.

Here was my assessment of things in the October update:
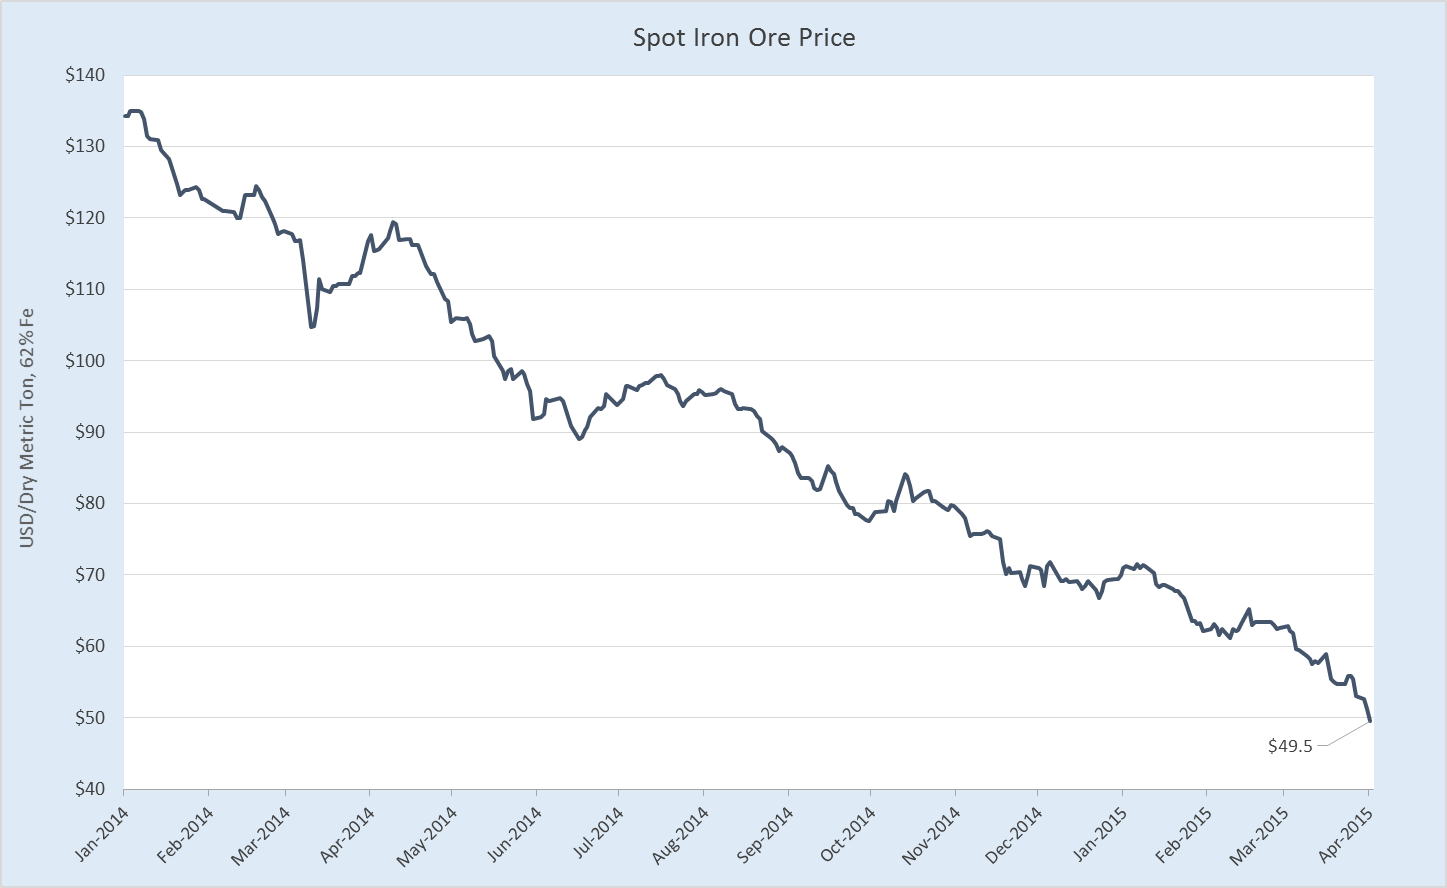
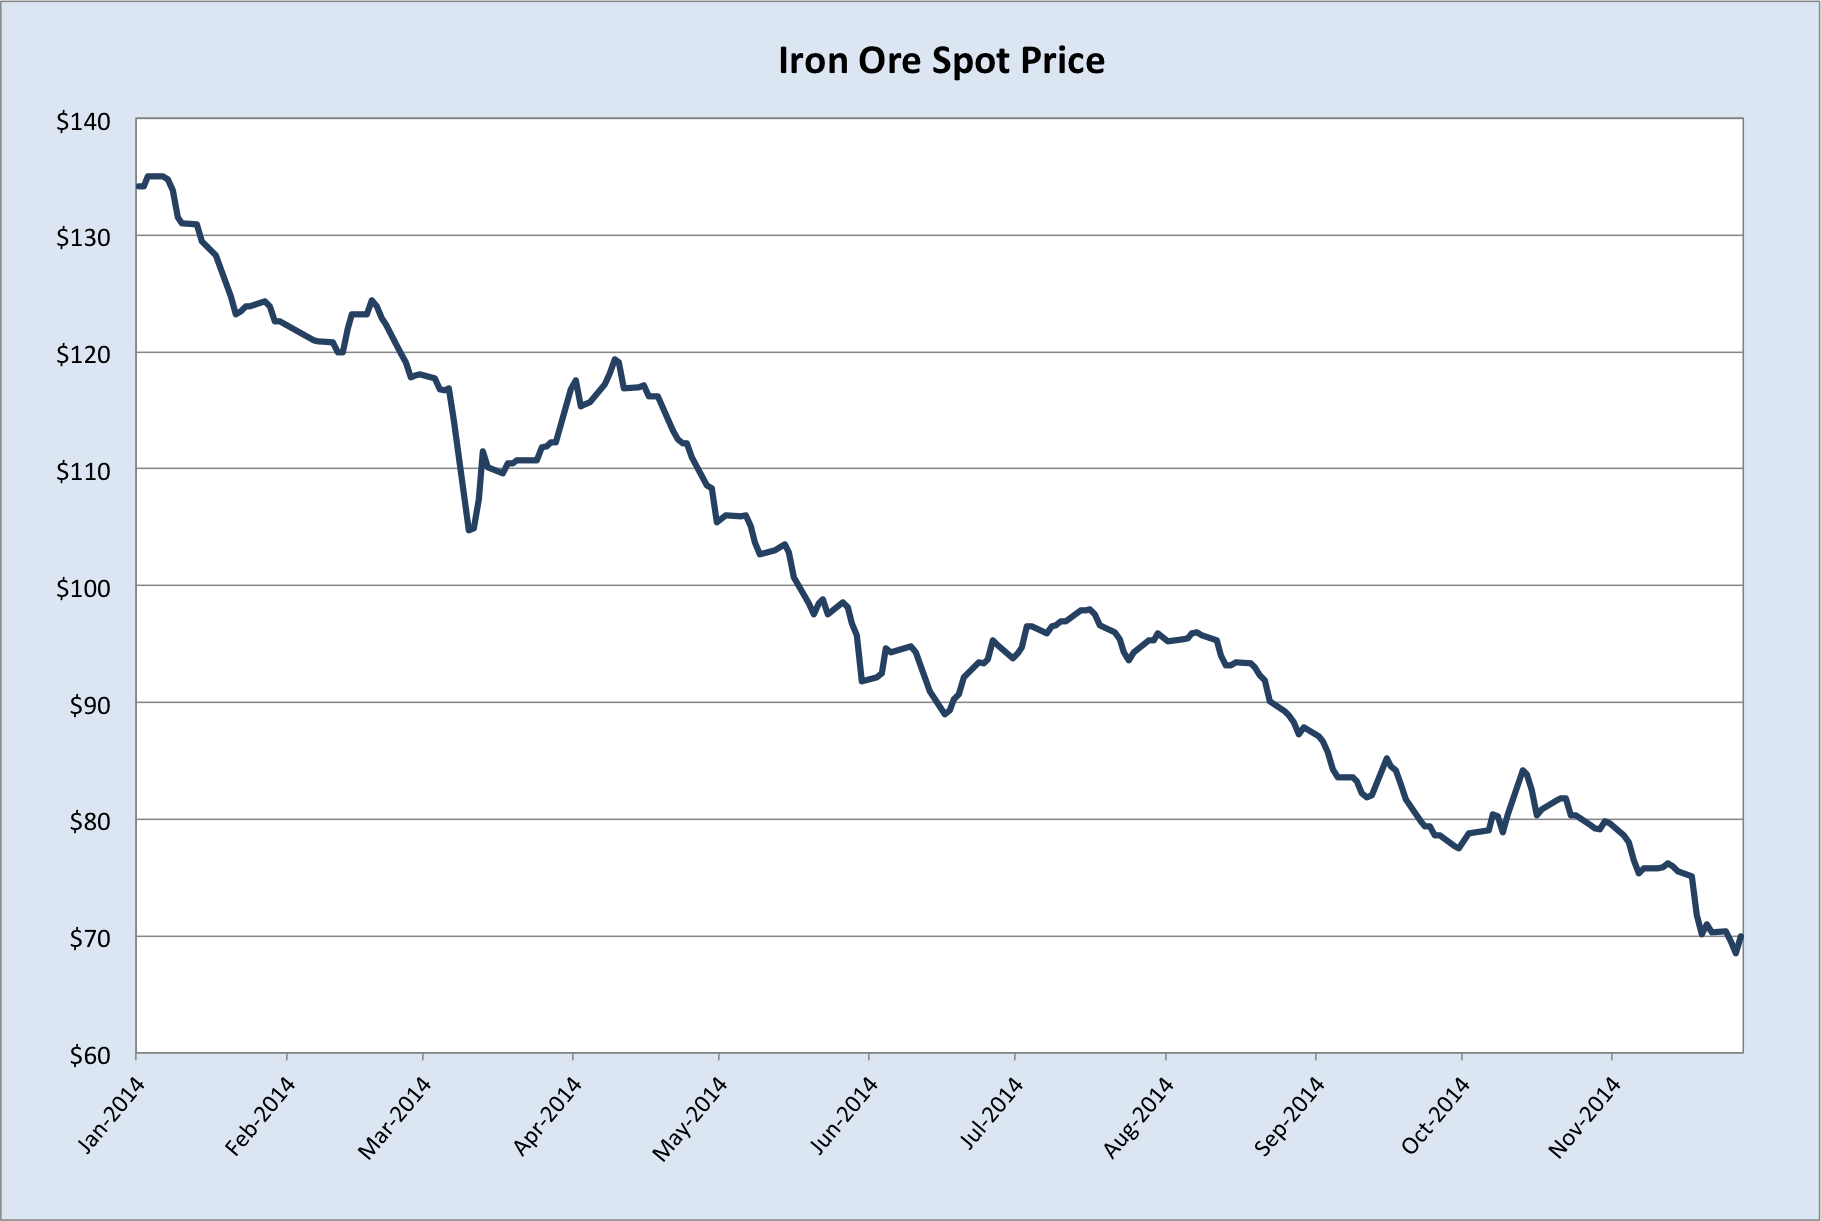
Recently I noted that the worst may well have passed for the iron ore miners in 2014. Spot found legs for a solid bounce after that, however as you can see it didn’t manage to hold its gains. Still, buying returned at the end of last week around the $80 level, and it looks unlikely we’ll see falls much below this for the remainder of the year, owing to much improved profitability amongst Chinese steel mills, a thawing of credit conditions in China and some degree of seasonal inventory restock into the year’s end. However, without a fundamental shift in Chinese policy settings, the bounce will be short and soft relative to past years. And with no sign of a let up in the pace of supply expansions from the majors, further declines in iron ore next year are virtually baked in.
$80/t has since crumbled and we’re presently sitting at $70/t (Qingdao port price). The ‘further declines’ I expected to arrive early next year came ahead of time, the reason being an absence of seasonal restocking activity, which I discussed here. The market got briefly excited about an interest rate cut from China’s central bank last week, but that’s faded quickly. The last couple of sessions in China have seen strong buying both steel and iron ore, which could extend a bit further, but the fundamentals for both remain so poor that it’s hard to see a pronounced rebound into the year’s end.
Iron ore is the main drag on the Australian economy today. Over the next year declining mining investment will probably assume that primacy, but what Australia is going through right now is quite simply a monstrous terms of trade bust, one of the biggest and baddest in our history. Without large reductions in supply, it’s likely we’ll see spot iron ore near $50/t by the end of next year. Thus, unless we get a full-blown resumption of the Chinese credit and property booms, and soon, the situation with iron ore makes it very hard to see the RBA hiking rates with the next move.
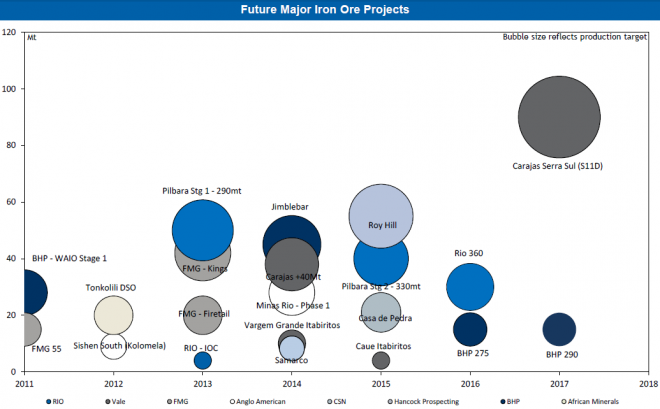
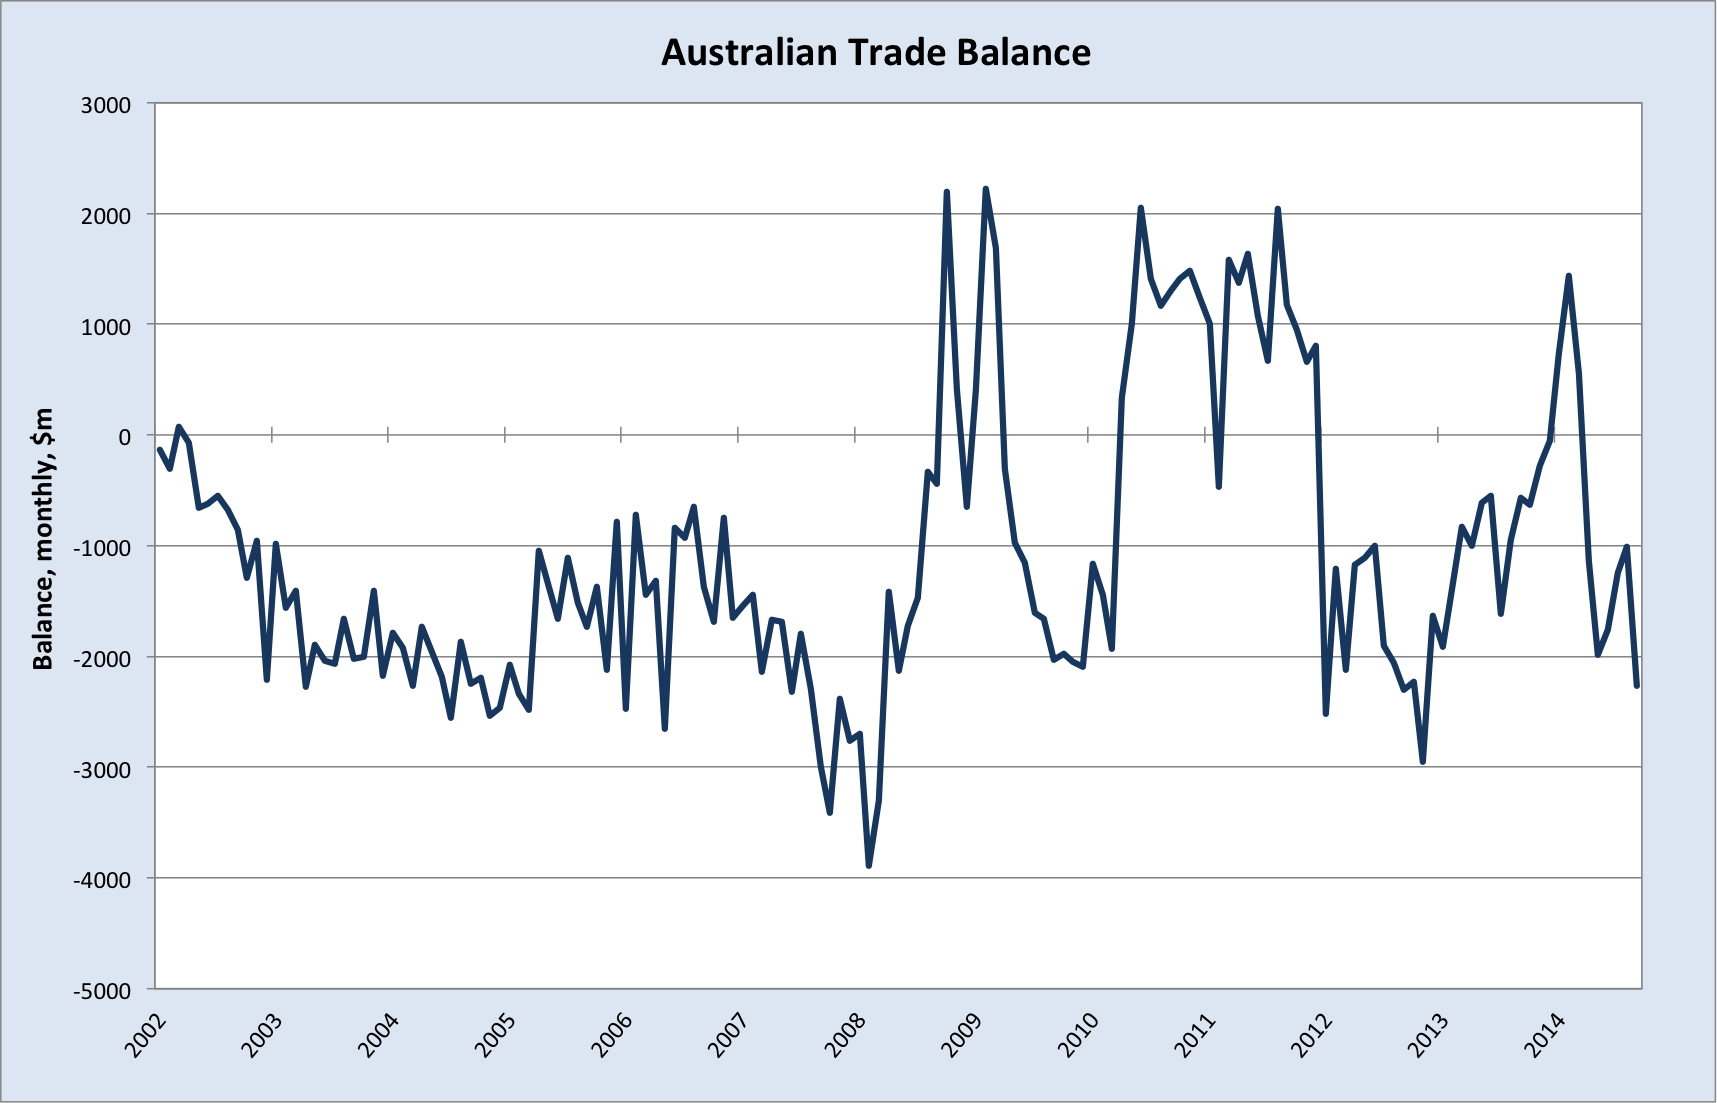
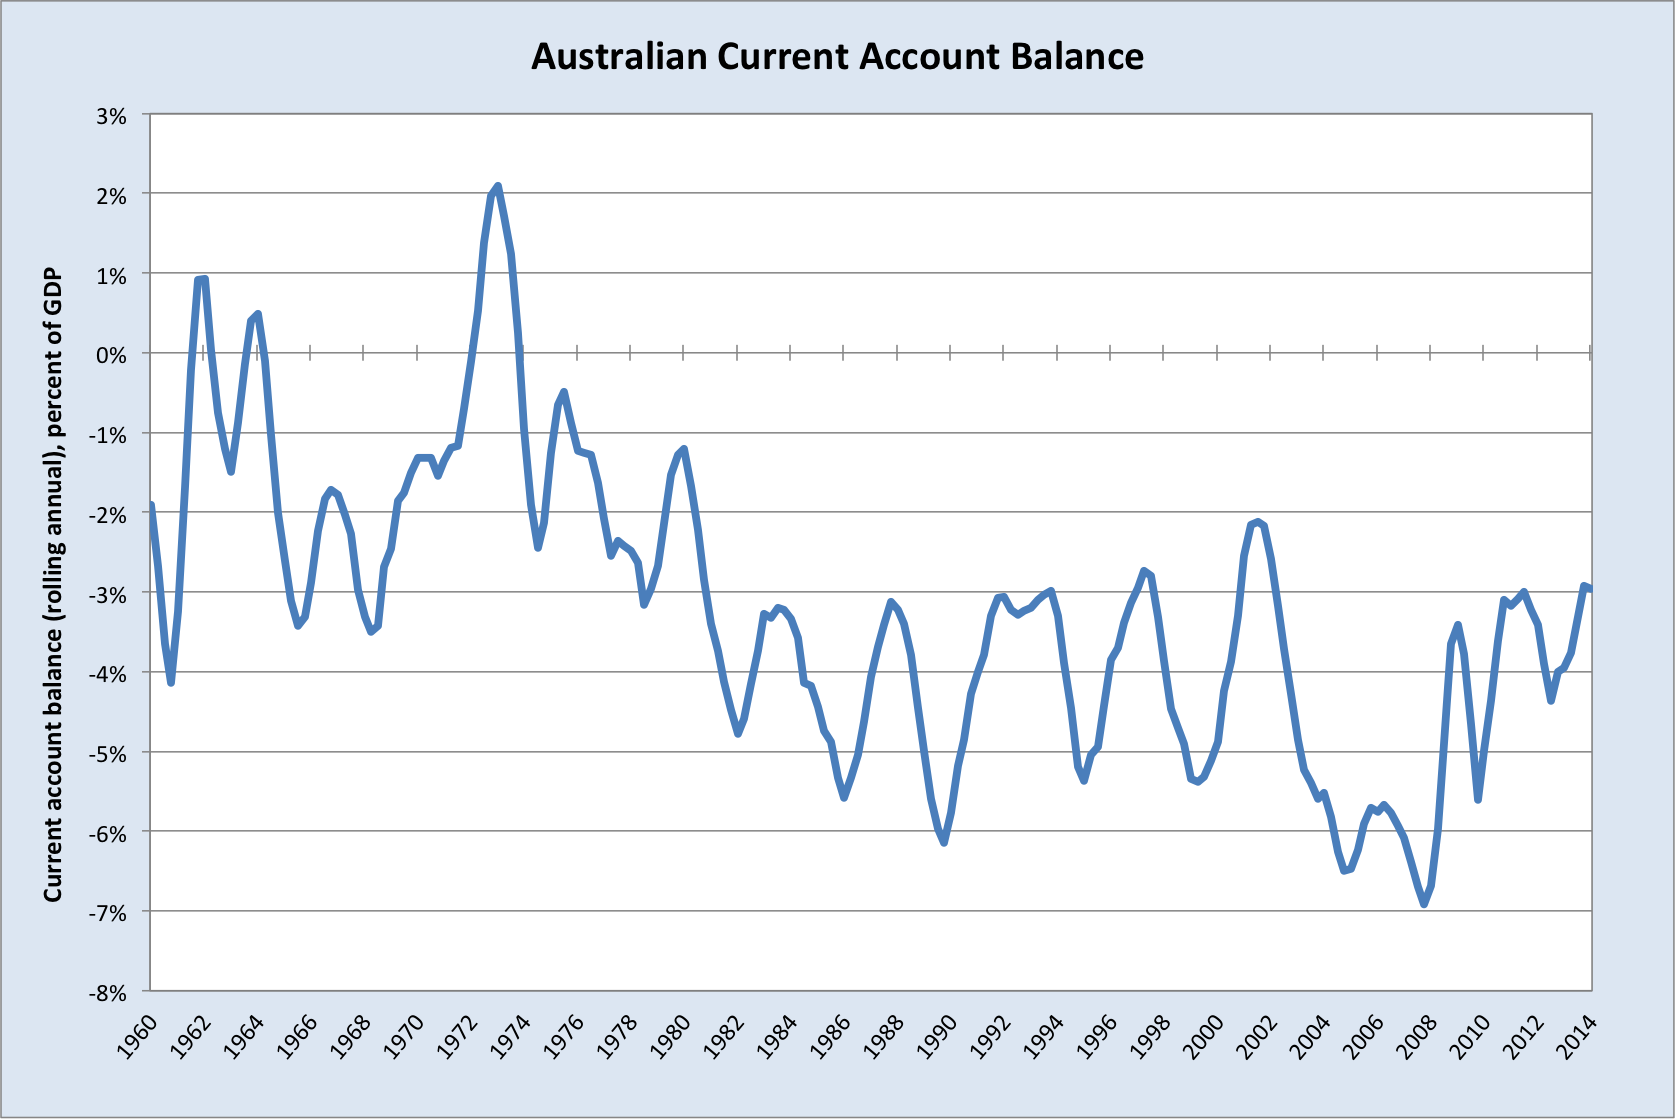
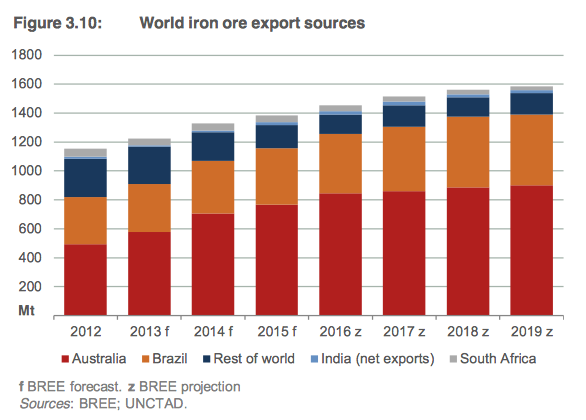
The iron ore slump (-47% this year), has mostly been about the huge expansion in supply and the endurance of existing high-cost production, especially in China (the failure of Chinese steel demand to continue rising inexorably is the other important aspect). Much of this new supply has come out of Australia, hence our trade balance has not deteriorated too severely thus far.

There will likely be further pressure on the trade balance over the next year, although I don’t expect the headline figure to be all that bad, owing to even more iron ore out of the Pilbara and the ramp up in LNG exports. This will be of little comfort, mind you, since higher volumes are of secondary importance when set against corporate profits, which are taking a beating in both sectors.
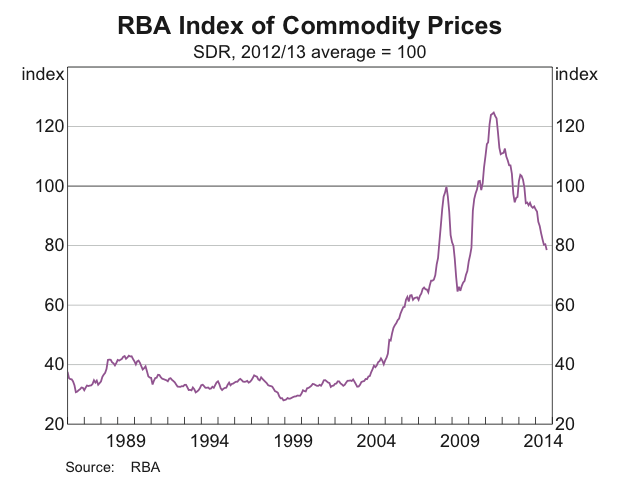
Here’s the most recent terms of trade chart (Q3 national accounts arrive next week). Once recent falls in spot prices flow through to contracts, the terms of trade will be approaching the nadir of 2009.

It will be a brave or desperate RBA that hikes interest rates in the midst of a terms of trade bust such as the one we are in the grip of.
China
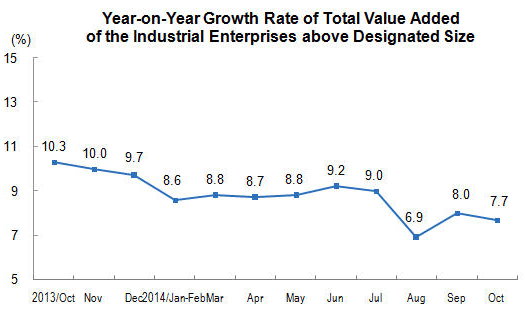
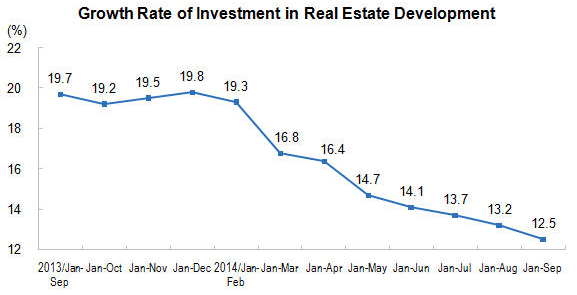
The Chinese economy continued to slow in October, emphasising why the government has lately shifted policy towards a more stimulatory footing.
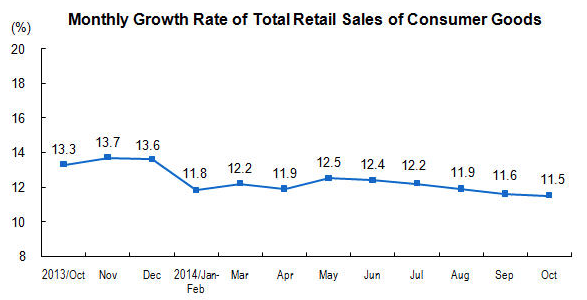
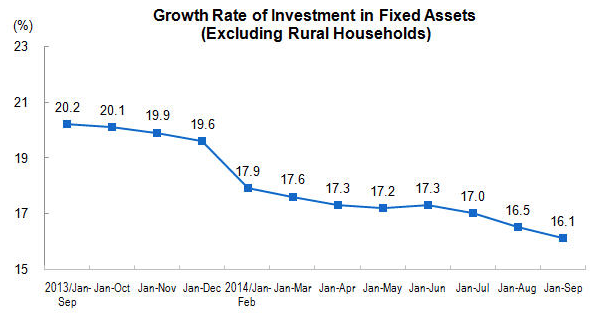
Industrial production, fixed asset investment and retail sales growth rates all registered falls from the previous month (charts from China’s National Bureau of Statistics).
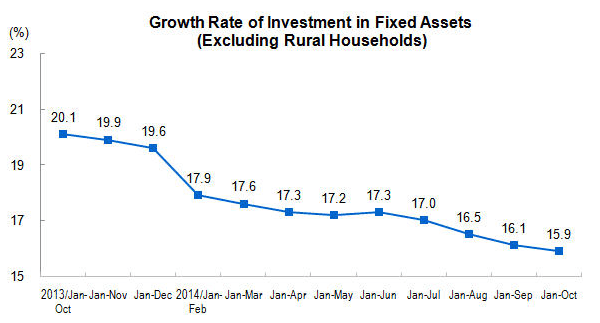
As I outlined in a post on China a few months back, investment levels grew to account for an unsustainably high proportion of GDP following the financial crisis in 2008. Why are very high levels of investment a problem? Investment is intended to raise output of goods or services in the future. If too small a proportion of an economy consists of consumption, then it risks insufficient demand for the extra goods and services produced by all that investment, and therefore poor returns for investors. When high levels of investment have been been funded by a massive expansion in credit, this can be calamitous.
For this reason, the Chinese government has signalled its intention to rebalance its economy away from investment in ‘fixed assets’ (factories, infrastructure and apartment blocks) and towards domestic consumption. It is welcome then that retail sales have declined by less than fixed asset investment over the past year, and that the services sector has expanded more rapidly than manufacturing, but there is still a way to go. The challenge is immense; according to government researchers, $6.8 trillion of wasted investment has been undertaken since 2009. All this spending has of course contributed enormously to Chinese GDP growth, and I simply cannot see how growth rates aren’t going to slow markedly over the coming years as this uneconomical investment binge works its way through the system.
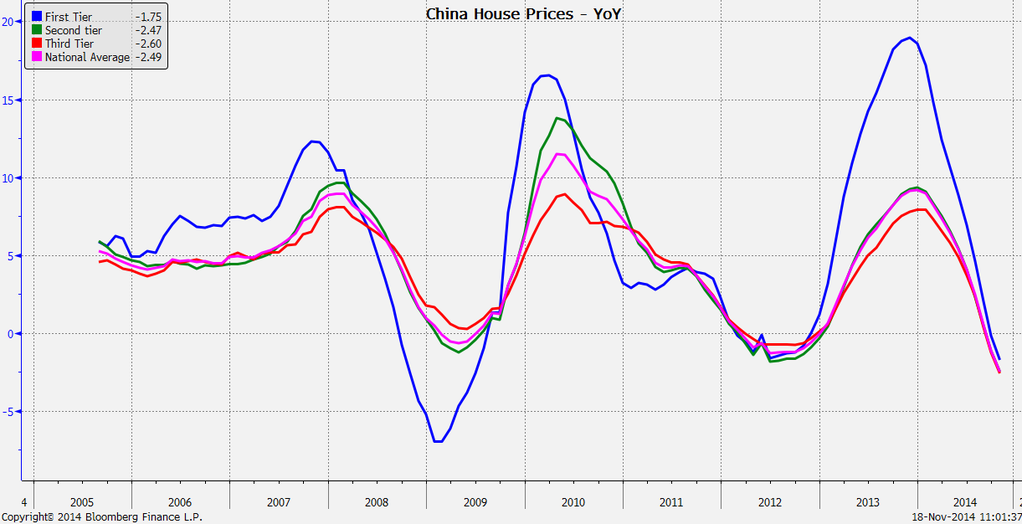
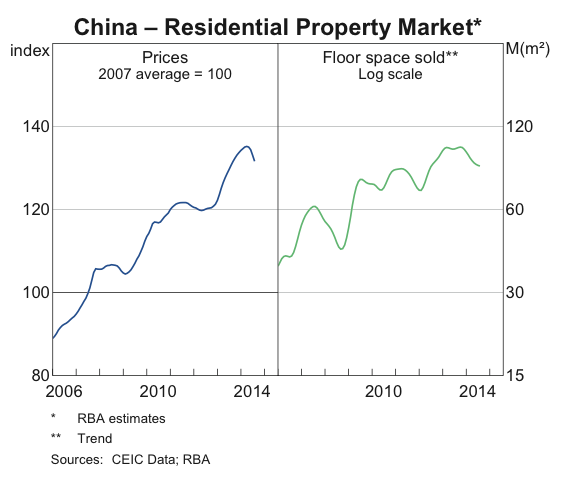
Indeed, without a continuous acceleration of credit, Chinese property prices are sinking. Property data released last week acted as the catalyst for the capitulation in iron ore. At the national level, year-on-year prices are falling at their fastest pace in at least a decade. (Chart from Tom Orlik):

In response to soft data and the bleeding in the property sector, which is itself an automatic consequence of the restraints placed on credit growth, the People’s Bank of China (PBoC) cut interest rates on Friday, adding to the easing of mortgage lending rules in September.
Although this move won’t turn the economy singlehandedly, if it is accompanied by a broader easing of credit conditions then some argue it could herald a lasting rebound in property and support demand for bulk commodities.
I remain highly sceptical that Chinese policymakers are seeking to reboot the credit boom. Debt-to-GDP has soared to 250% this year, from 147% in 2008. Although other nations have higher debt levels, such a rapid build-up of debt is a big concern, especially considering that China isn’t nearly as wealthy as other nations with comparable debt ratios. Moreover, much of the investment spending this credit has funded is are not going to provide a sufficient return, and so the quality of the debt is rather poor. China’s policymakers seem to understand this. I believe they’ll be looking to limit the stress on borrowers as much as possible, without reigniting credit growth. In particular, the shadow (nonbank) finance sector looks to be well and truly curtailed. This, at any rate, is how I am reading the interest rate cut: the government wishes to establish a floor under growth, as far as its feasible, rather than blow the roof off again.
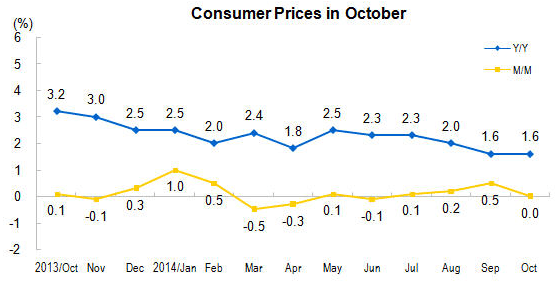
When we remember that inflation has been trending down over the past 12 months, especially in the second half of this year, its clear that the recent interest rate cut is as much about reversing passive monetary tightening as it is active monetary loosening.
With inflation low and falling, a cut was the correct decision. I am doubtful this move presages a return to the credit boom days, and in any case it would need to be truly enormous now to mop up the sheer scale of excessive capacity in iron ore. Chinese policymakers may yet ride to the rescue, but in spite of recent supportive measures, we have not seen policy shifts substantial enough to alter the bleak outlook for bulk commodities.
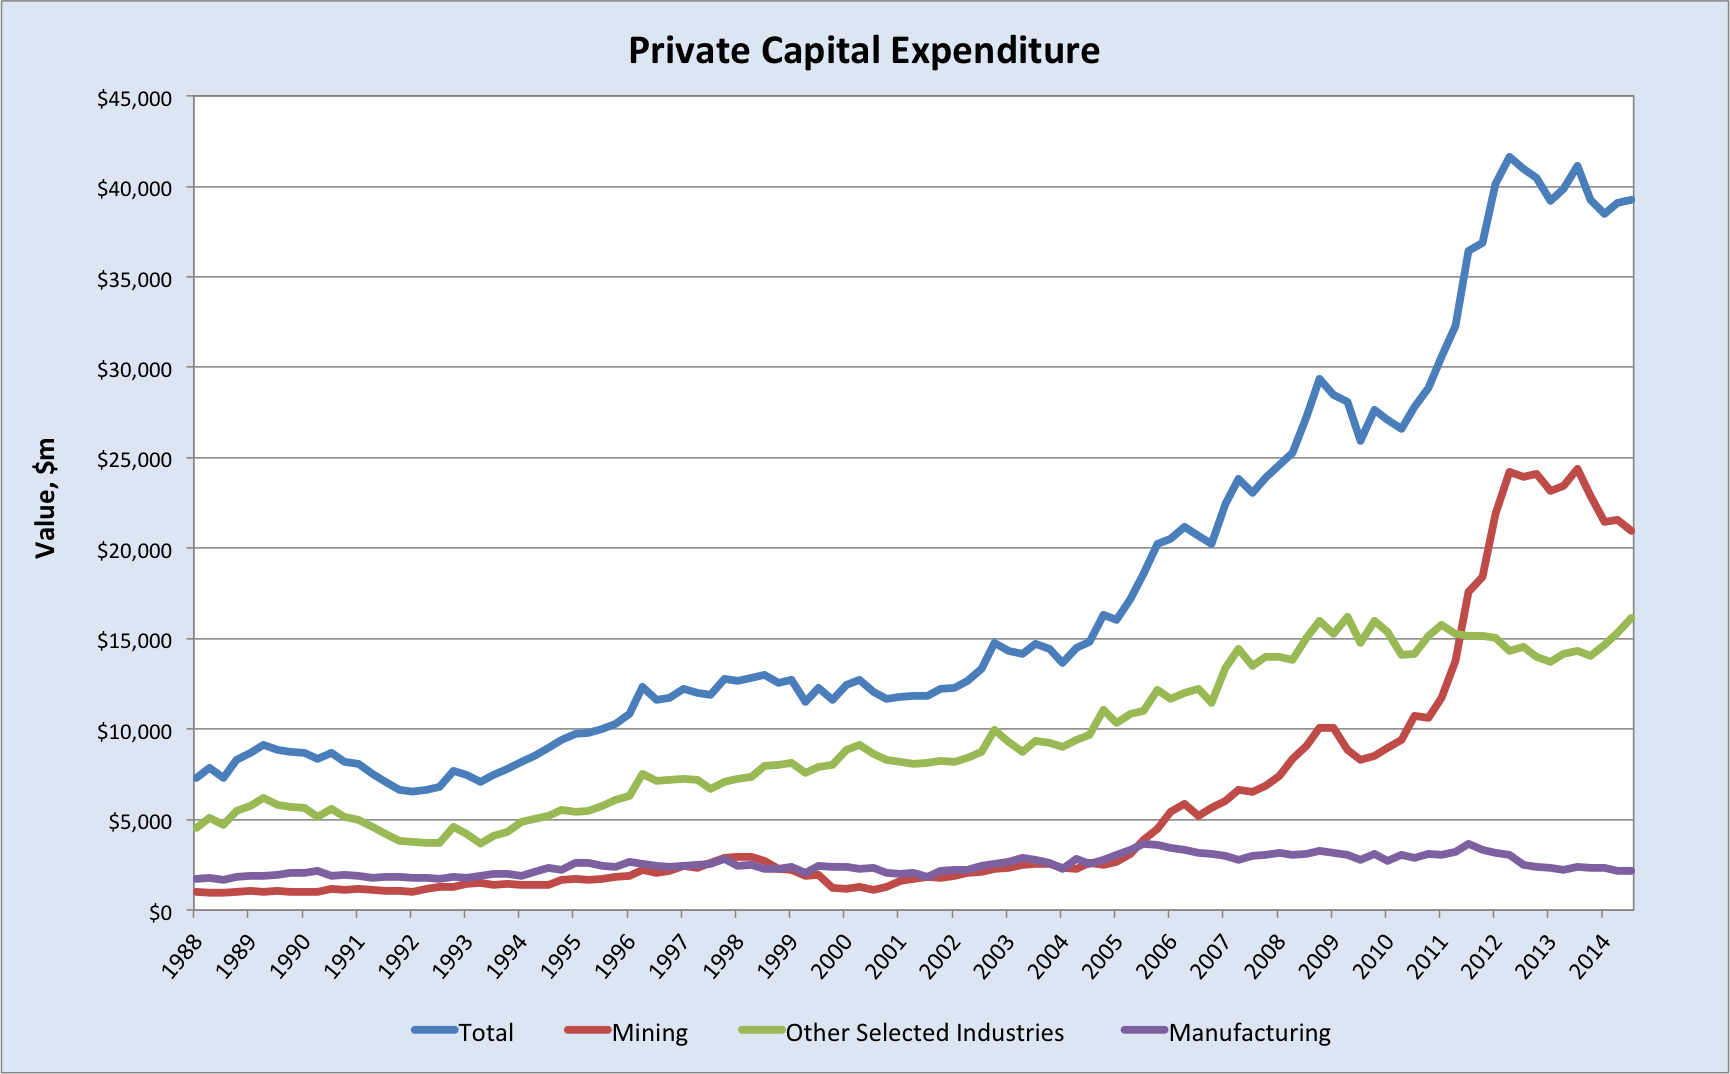
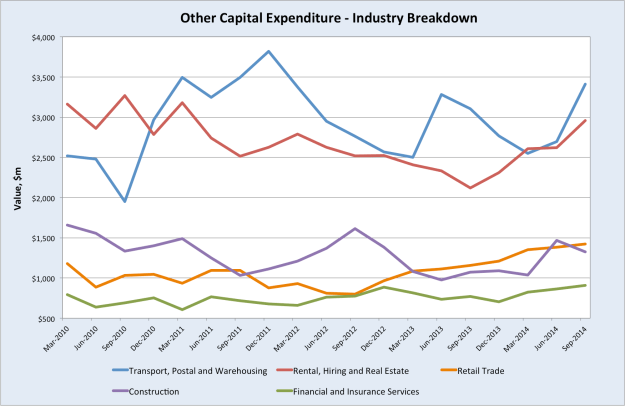
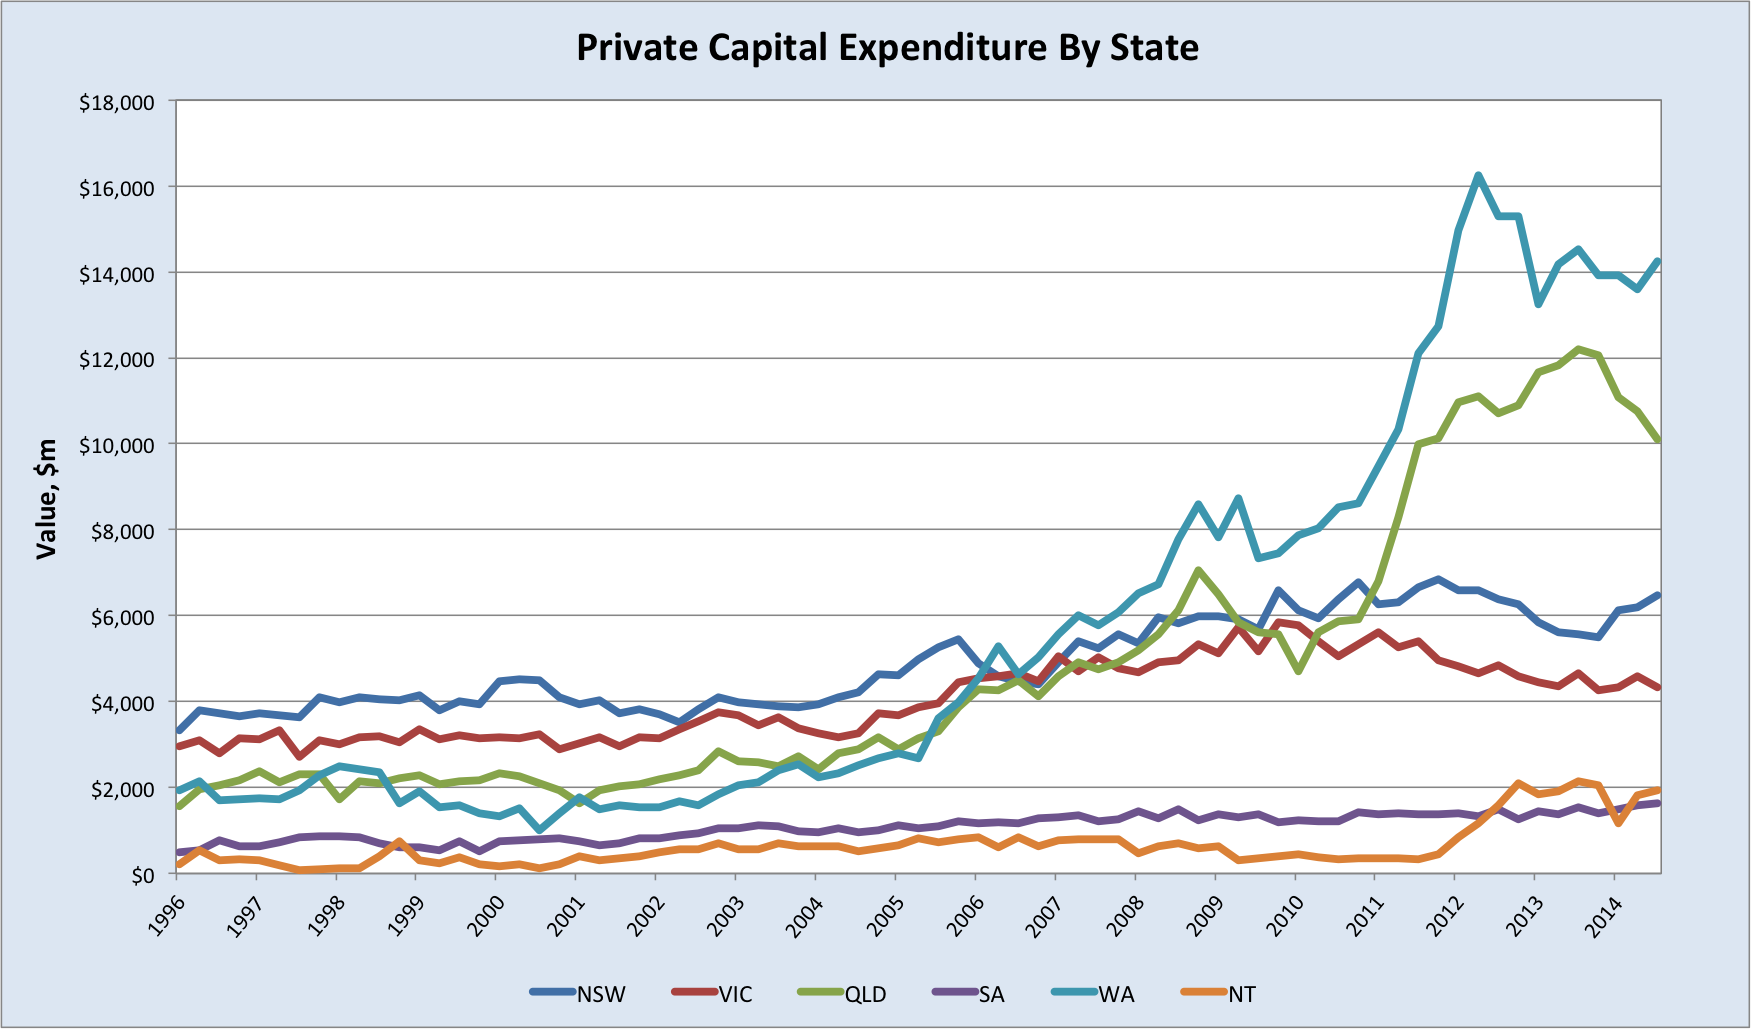
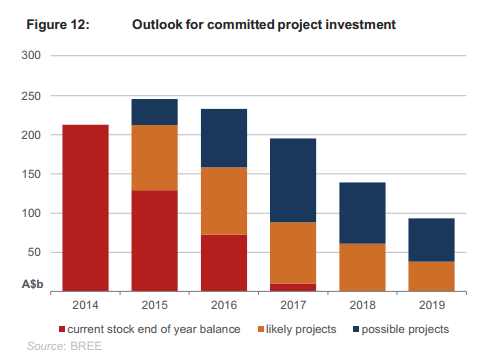
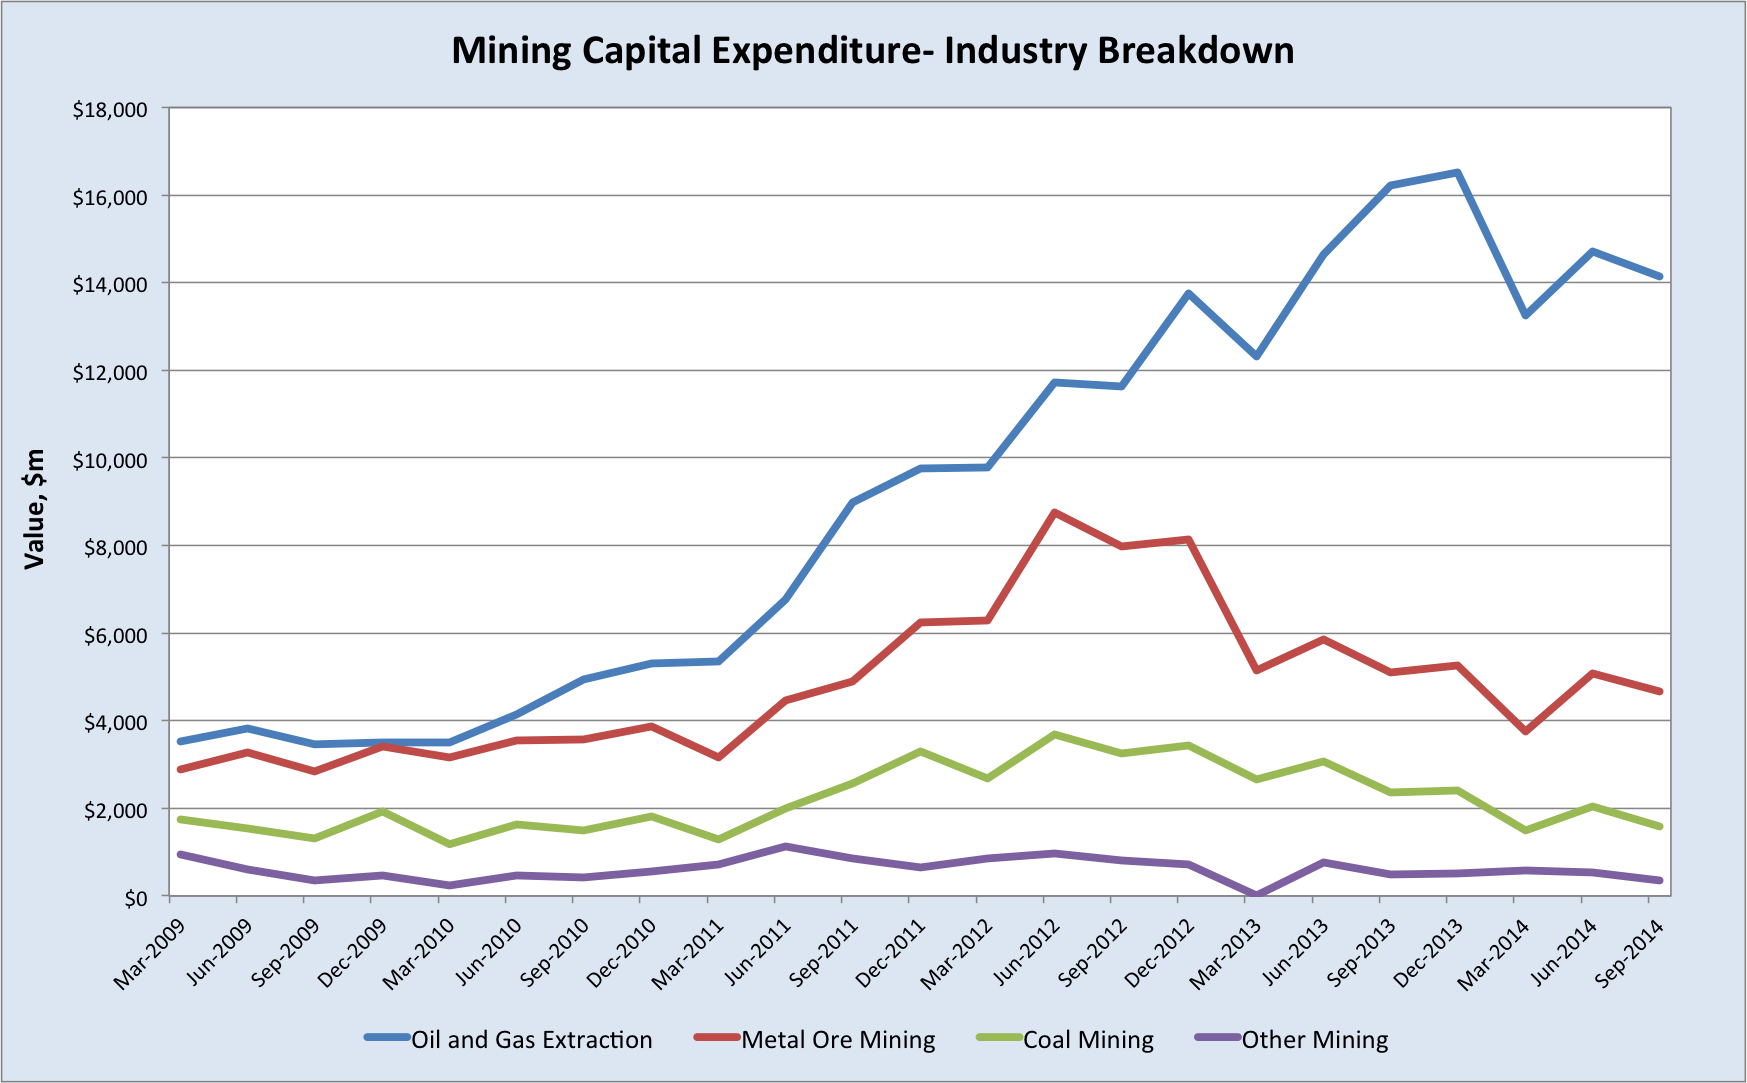
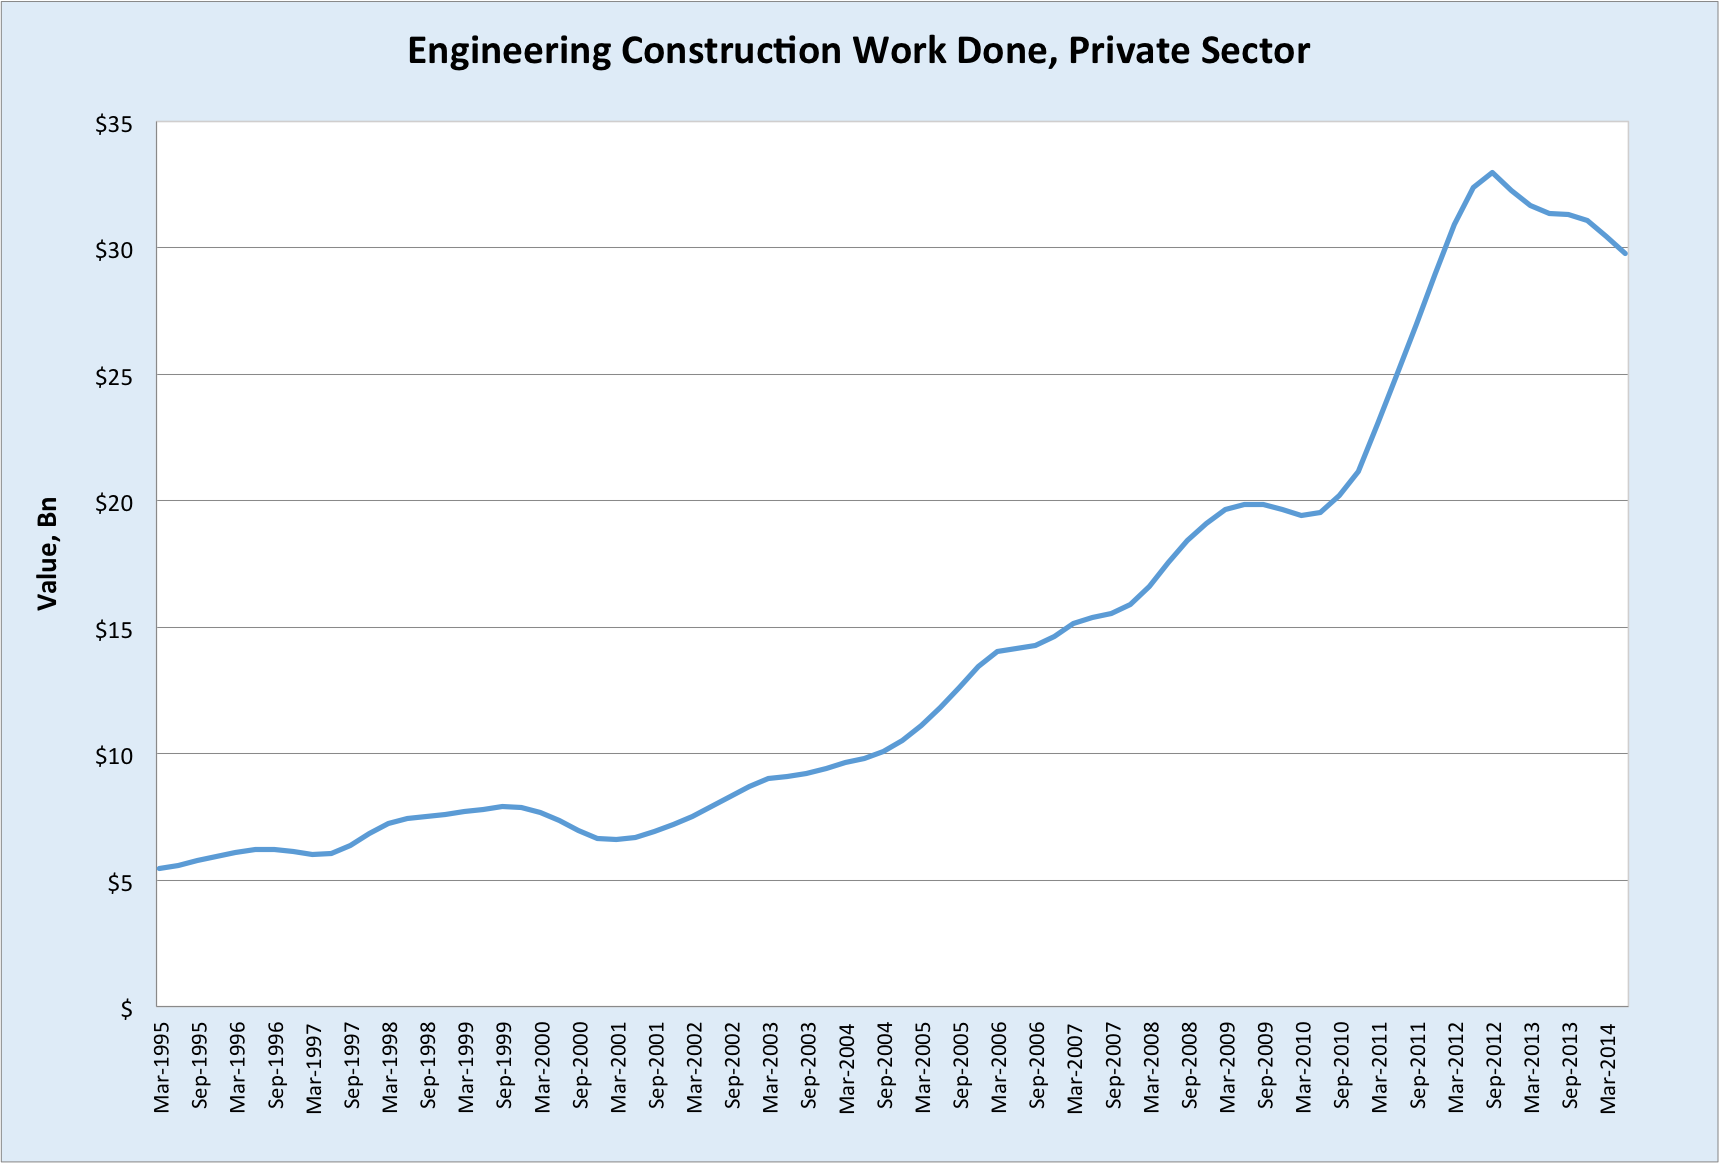
Investment
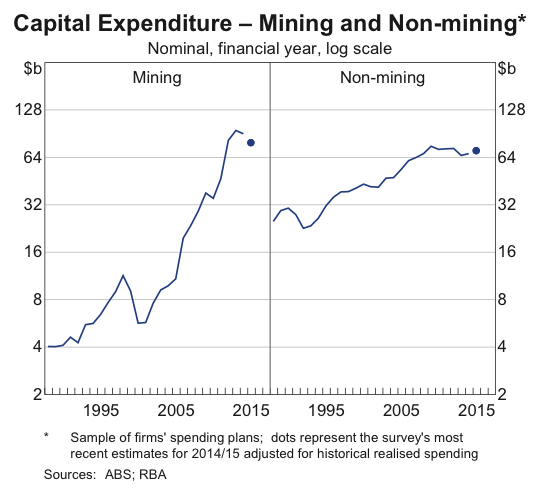
I covered yesterday’s capital expenditure data in detail here.
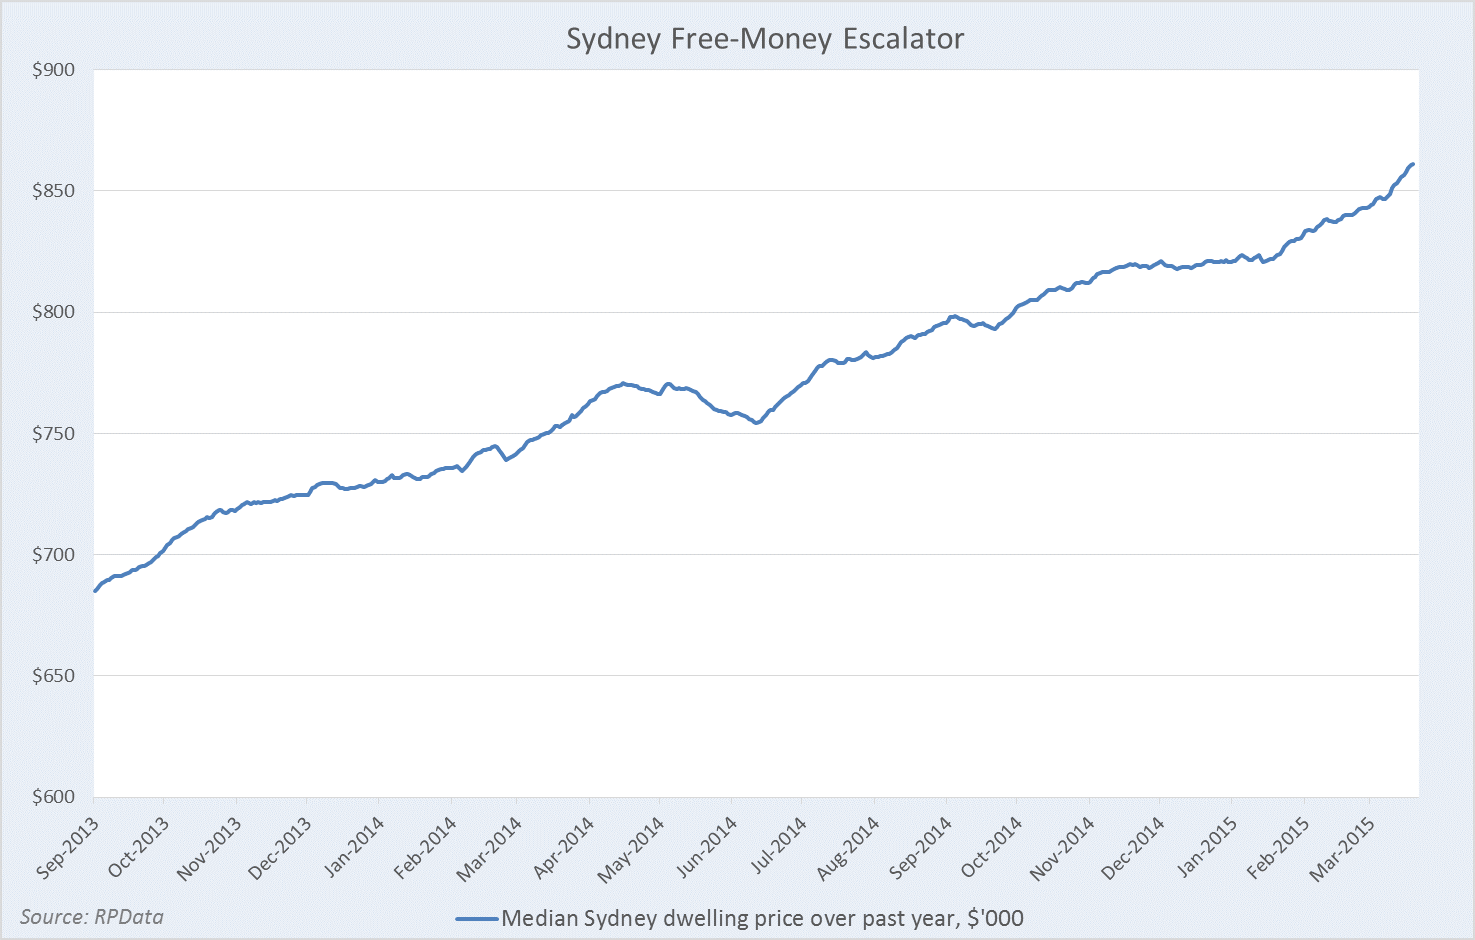
Capex has dodged steeper declines through resilient spending in WA and the Sydney property boom. Without further interest rate cuts, Sydney’s boom will start to cool within 6 months or so. And investment in WA is all about iron ore supply expansions, which hurt the terms of trade, and are likely to slow sharply next year as a result of the iron ore price crash (Fortescue’s announcement today is just the beginning). So although last quarter’s result was a positive, the future remains grim for capital spending.
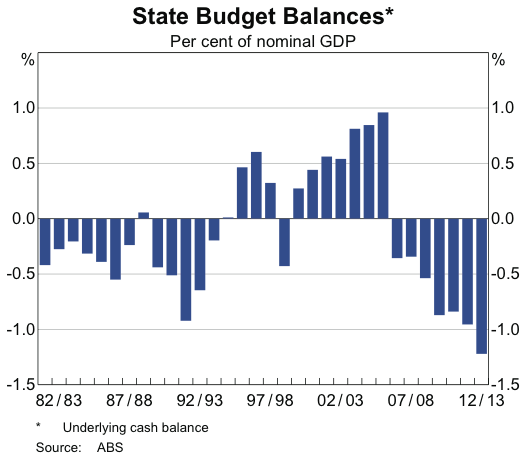
Public Finances
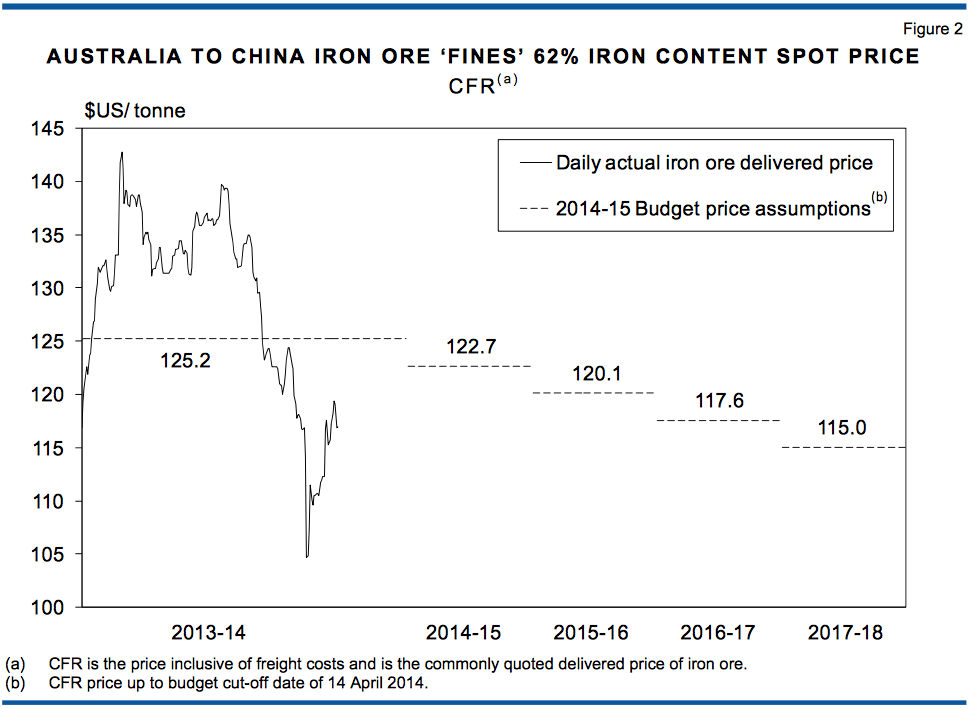
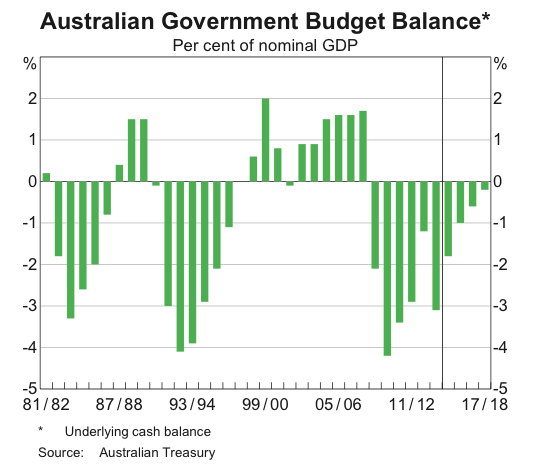
I have mentioned a number of times how damaging the iron ore rout would be to the West Australian government’s budgetary position, and here’s why:

Spot iron ore is sitting at $70 at the moment, over 40% below what the WA government forecast. Next year it could well average around $60, half of what’s been forecast. In the government’s own words, “General government revenue is also highly sensitive to the iron ore price, with iron ore royalties projected to account for 19.7% ($5.6 billion) of total revenue in 2014-15.” It estimates $49m in lost revenue for every dollar fall in spot iron ore.
The lower Australian dollar will provide some minor respite for the budget, but not nearly enough. Stay tuned for the Great Western Austerity Drive next year.
Although iron ore forecasts in the federal budget have not been anywhere near as aggressive as WA’s, the drop in prices has likely added around $10bn to the deficit this financial year, taking it to $40bn. Should the pain continue next year, it will obviously hit the budget even harder. The pressure will remain on the Treasurer to find savings that can pass the Senate, and these will no doubt be similarly popular to the ones announced in May. The ongoing fiscal retrenchment will likely dampen consumer sentiment in the coming months, making a consumer-led rebound a tougher ask.
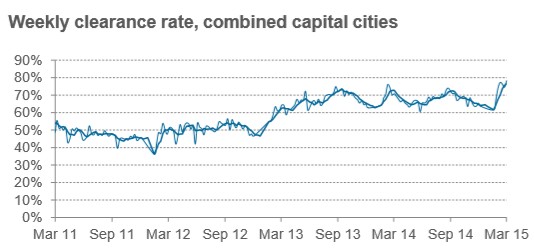
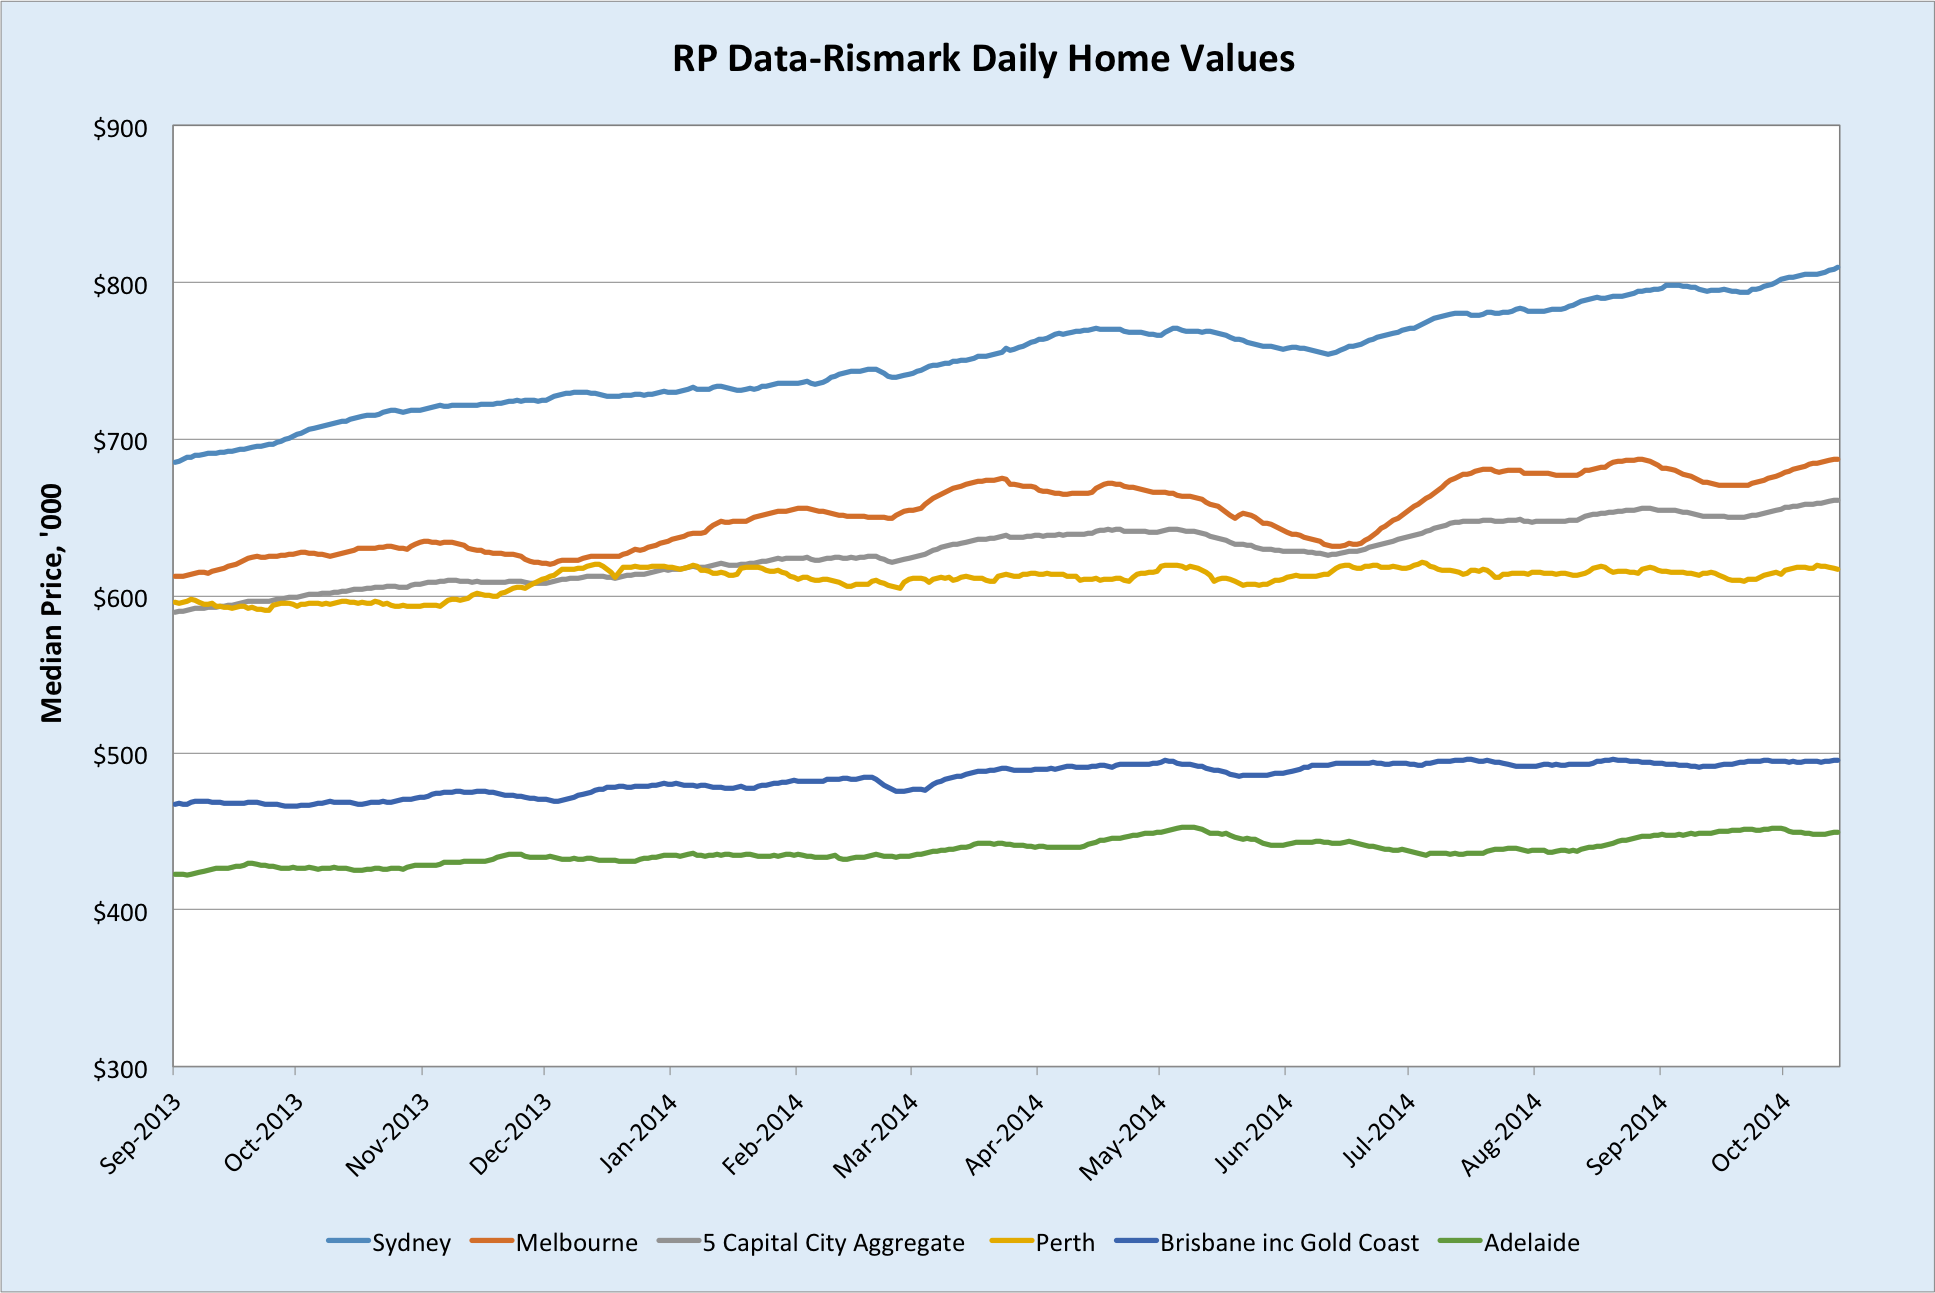
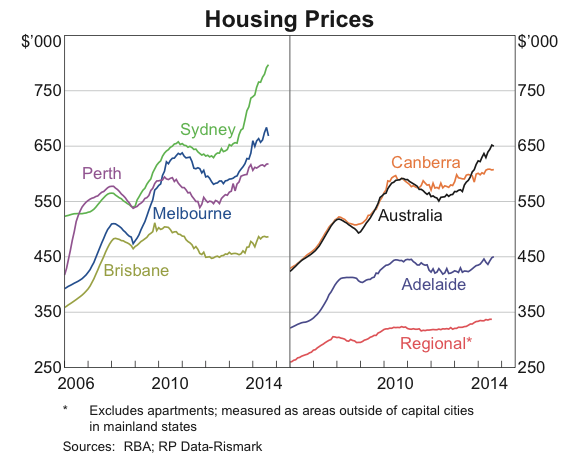
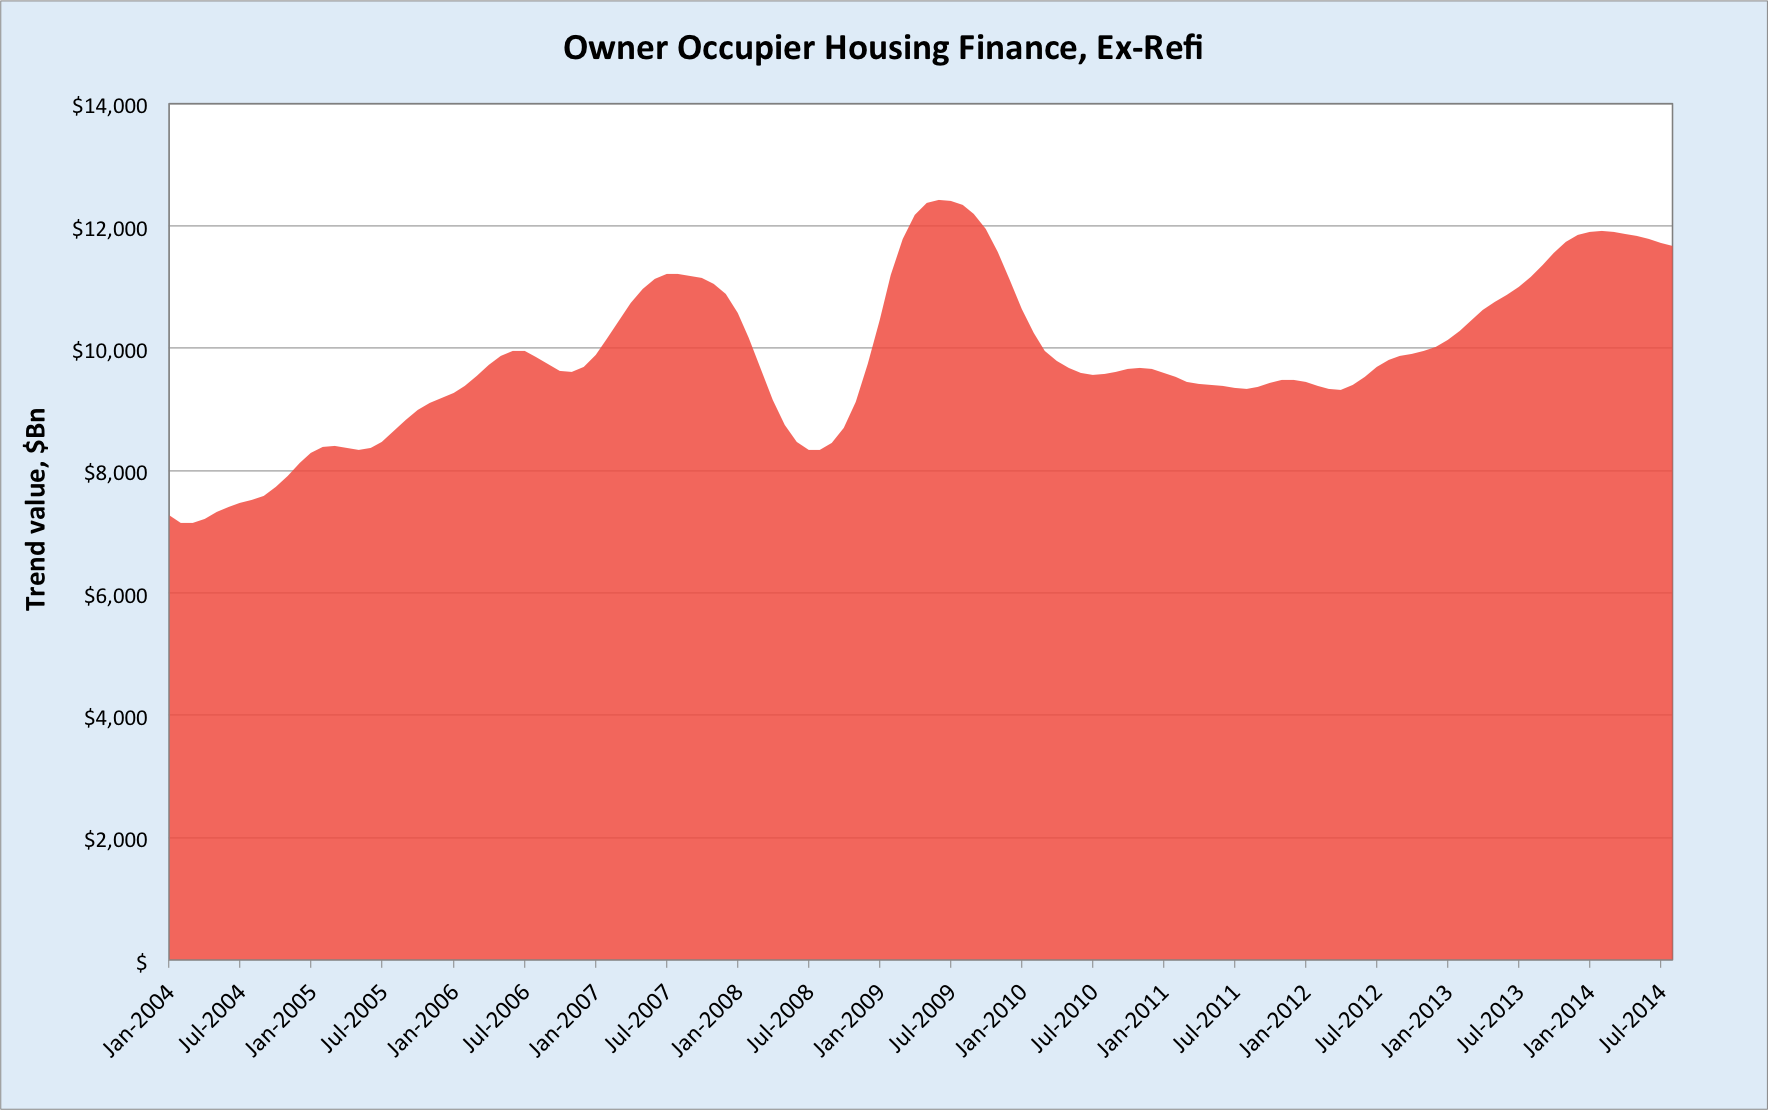
Housing
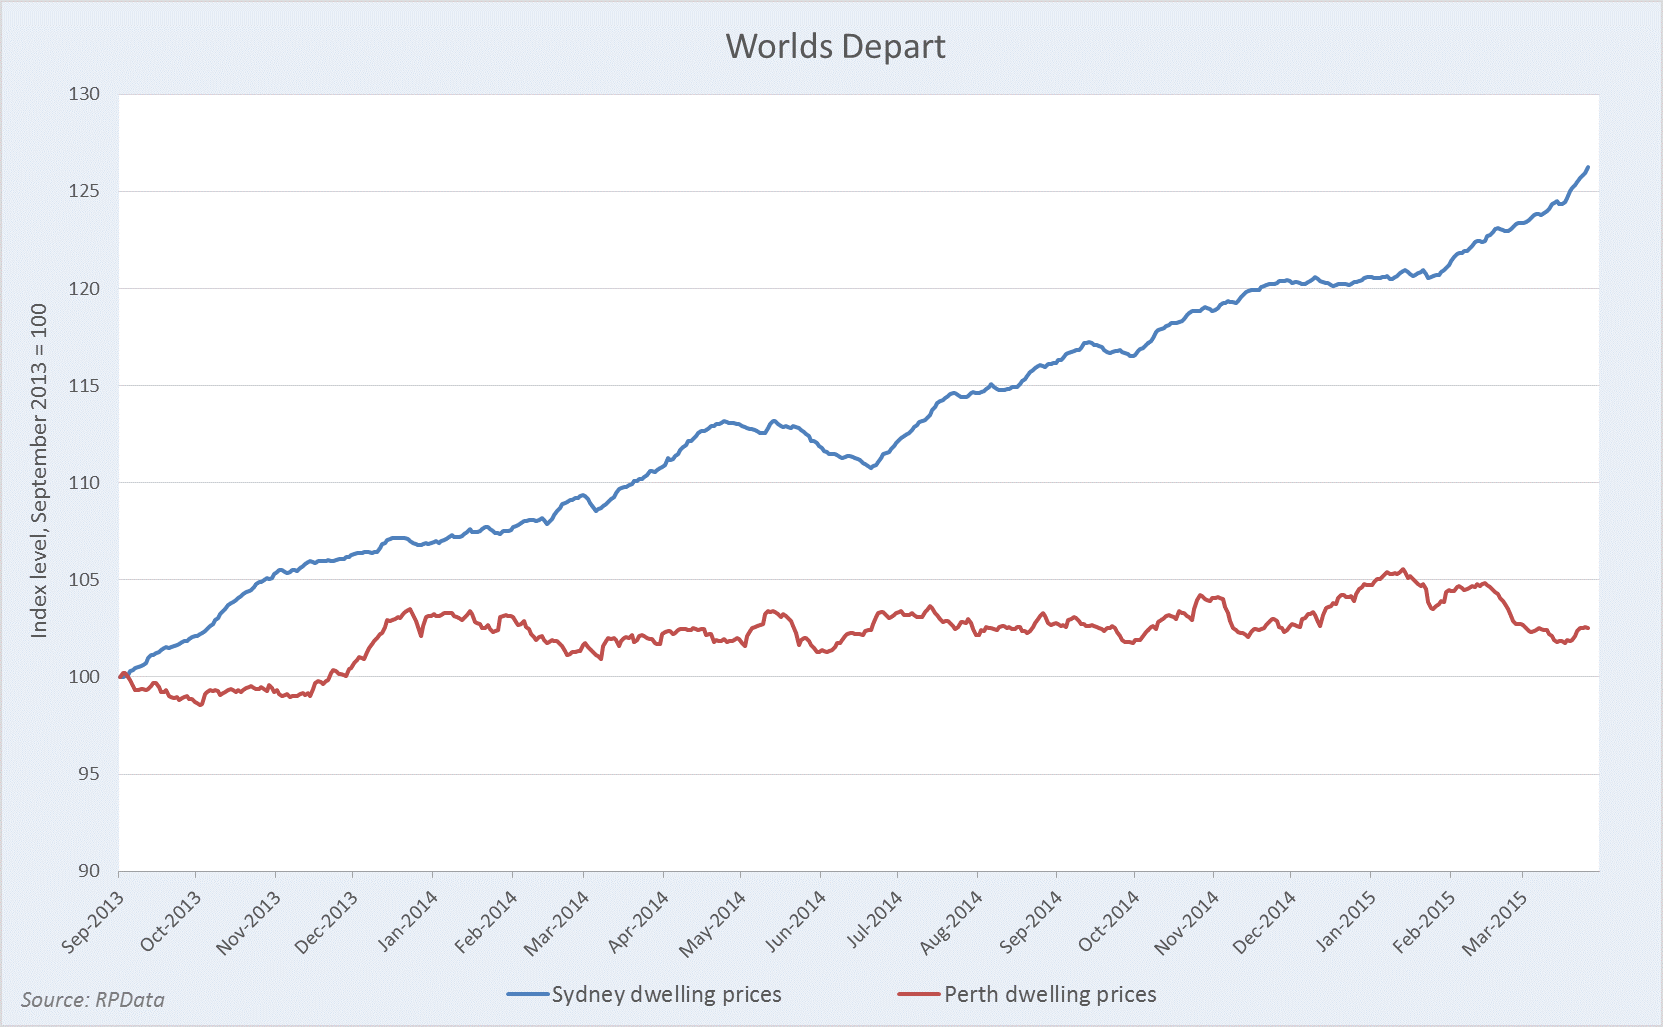
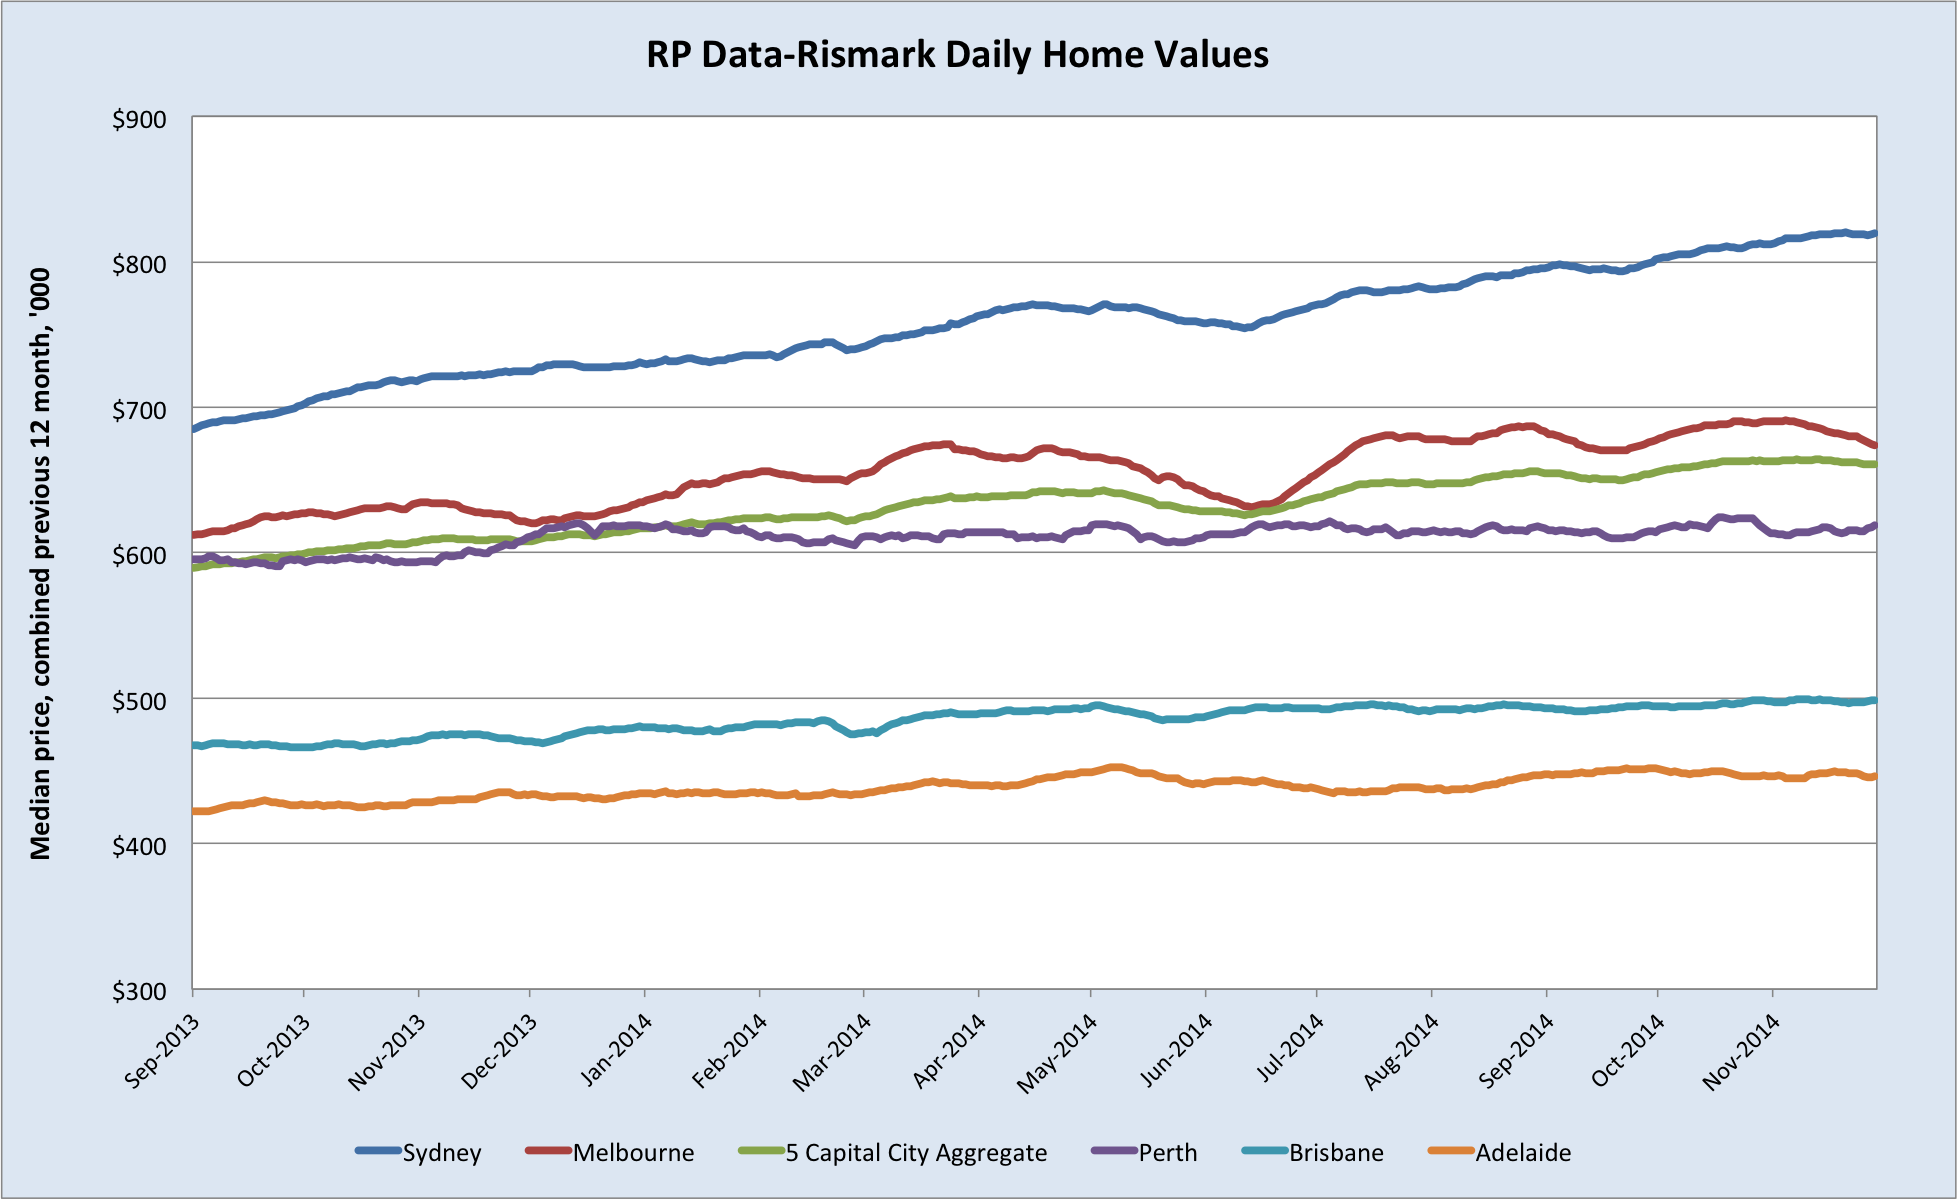
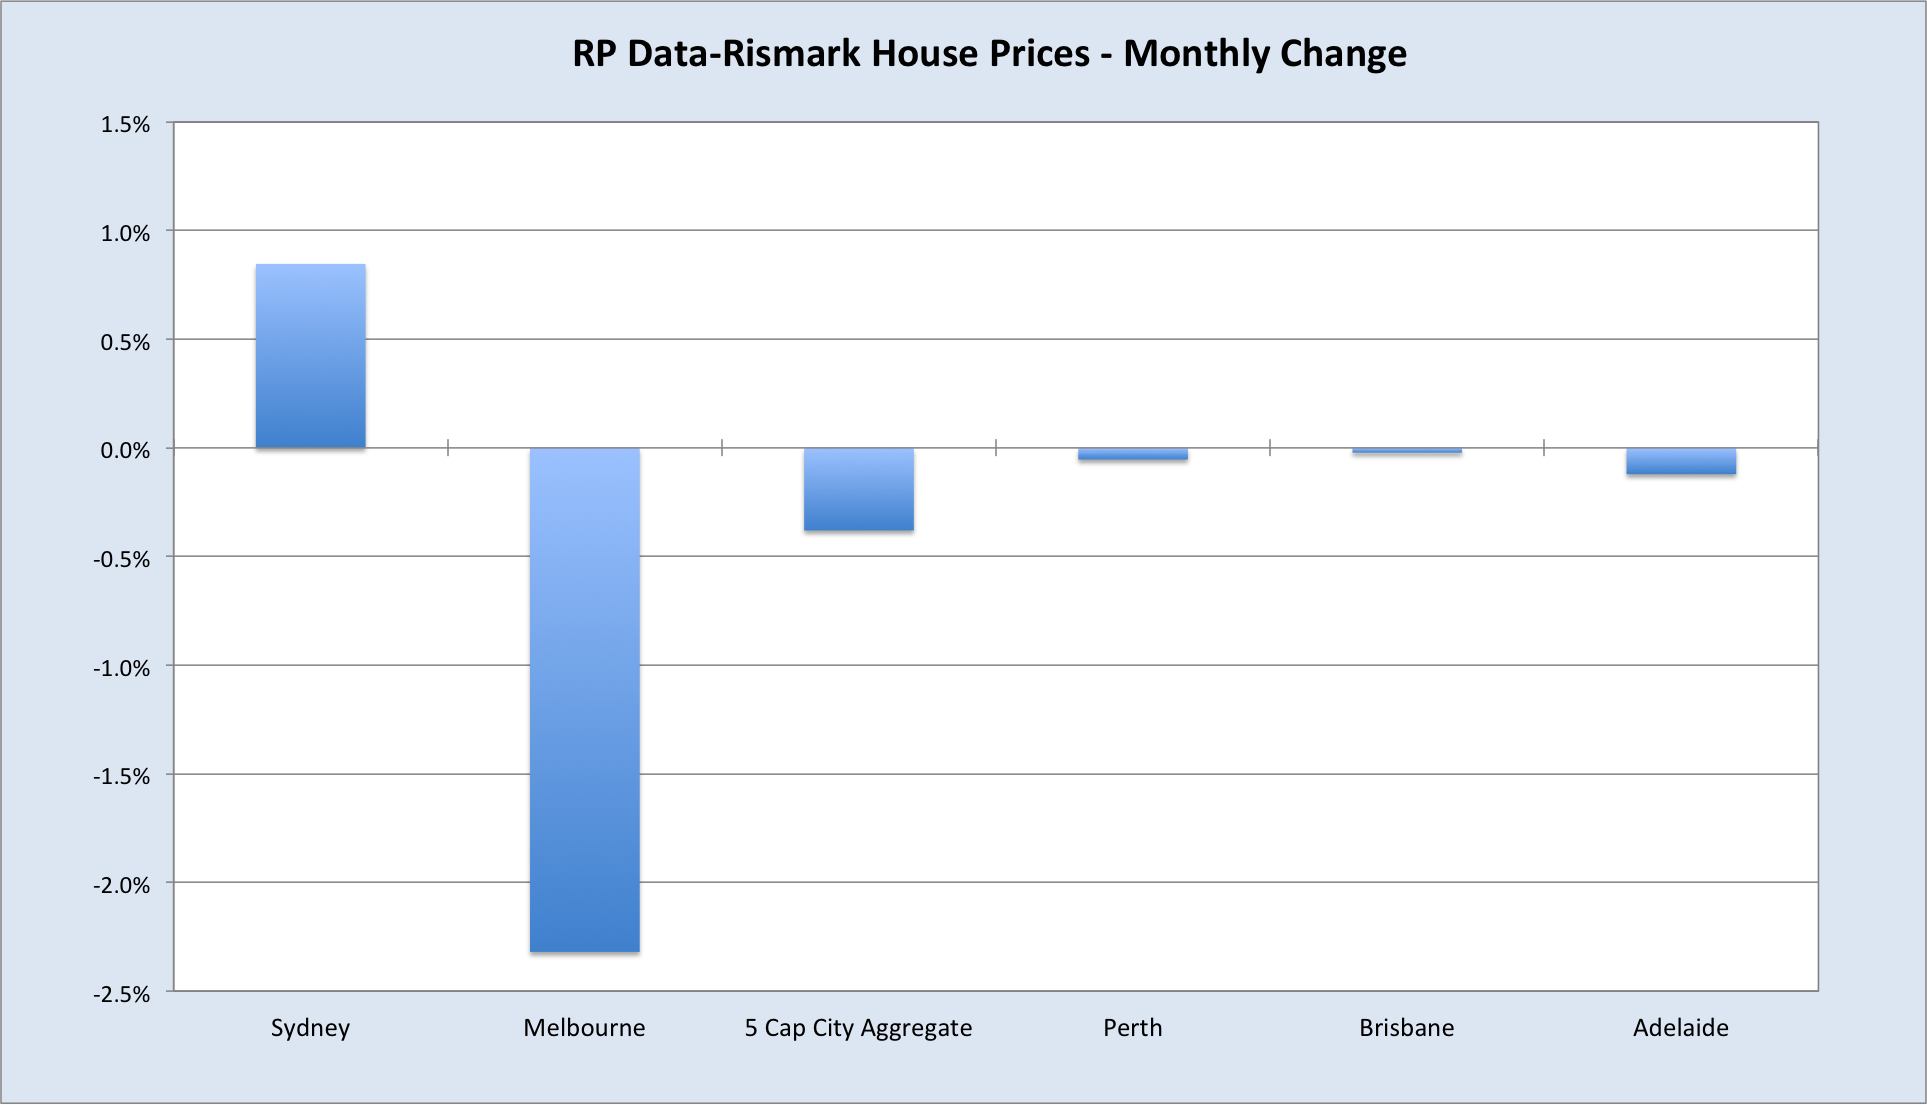
The housing sector moderated somewhat over the month, with Sydney and Melbourne diverging.


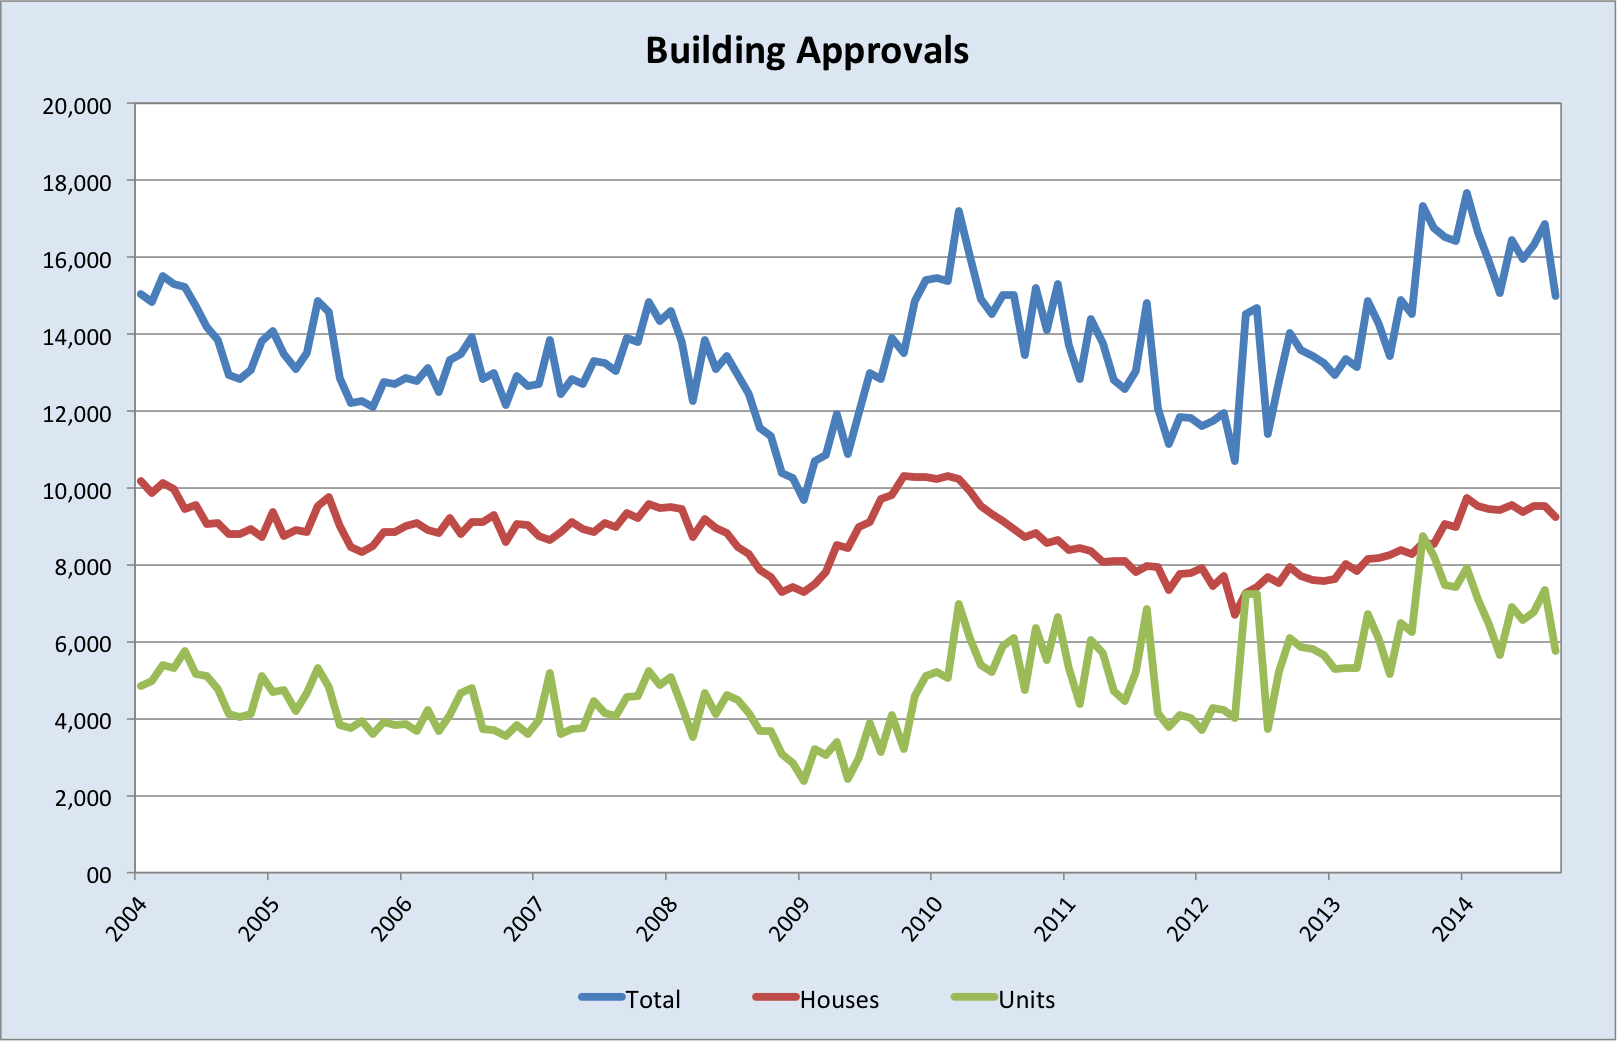
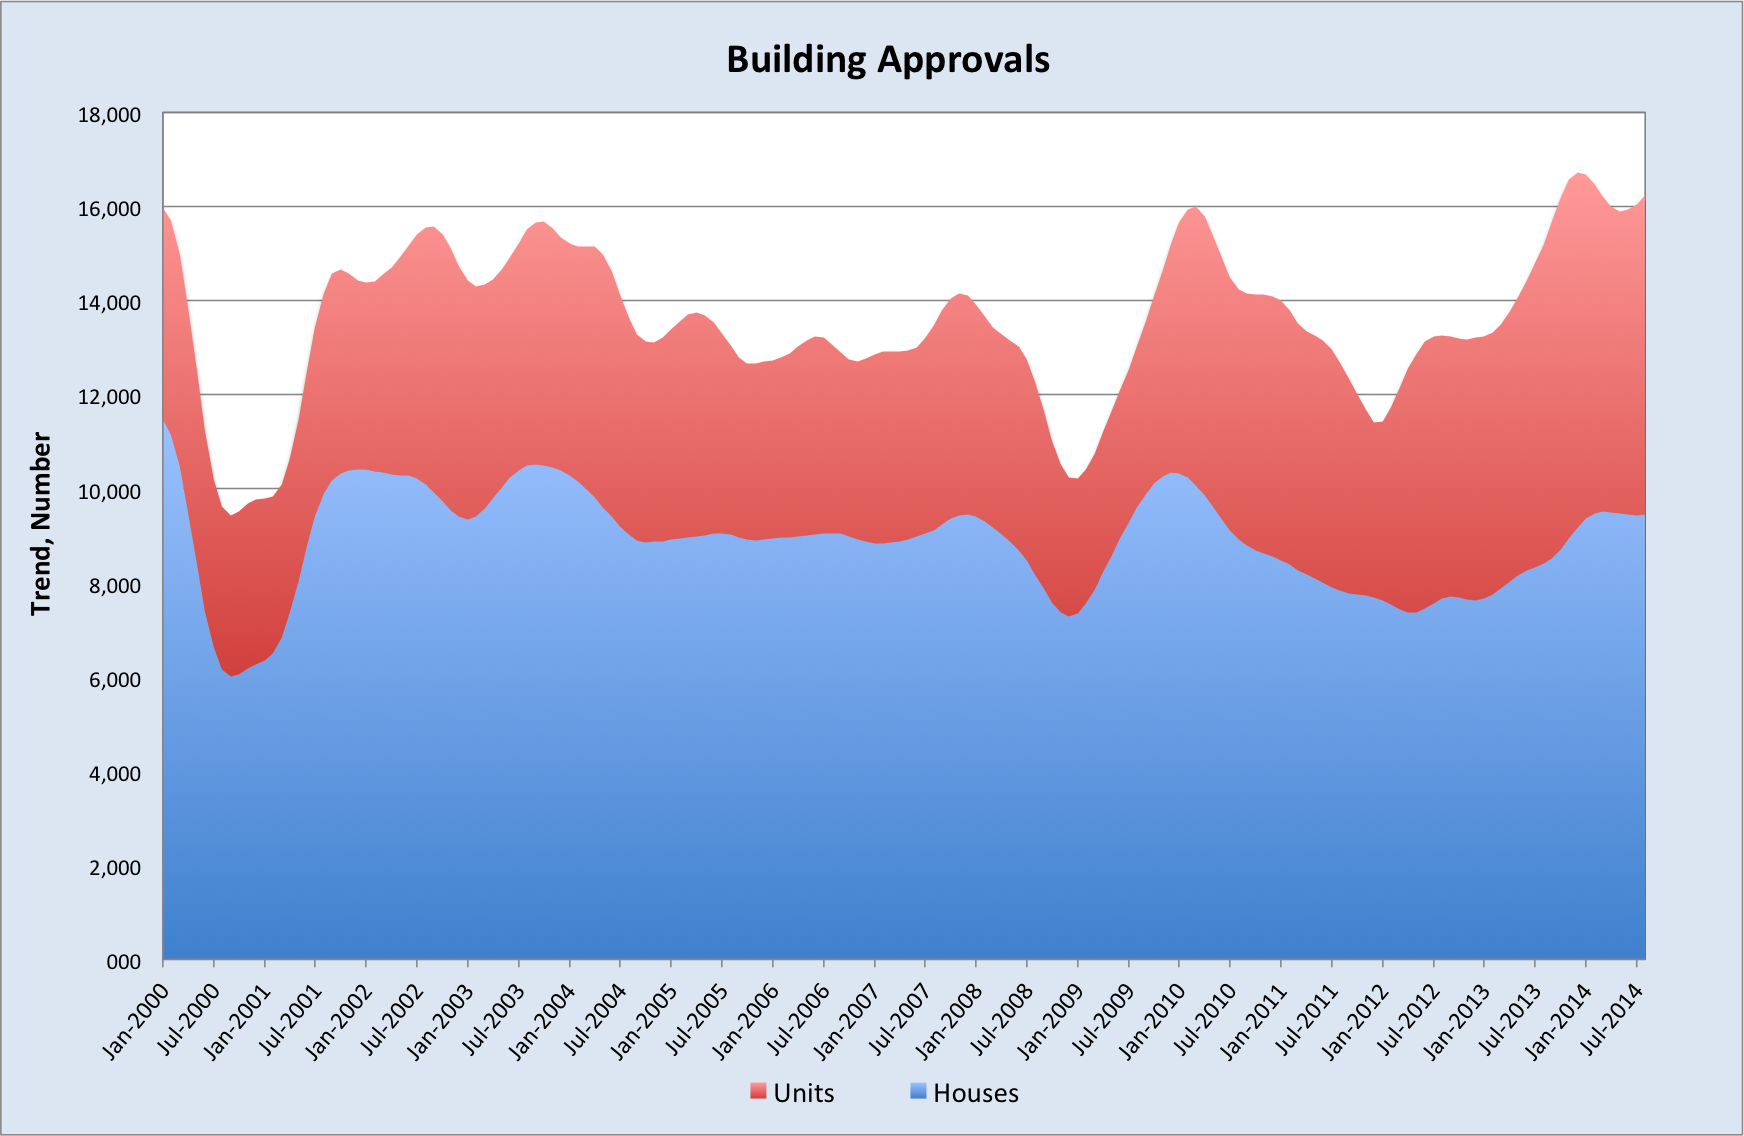
ABS data for building activity is only released quarterly, however the most recent monthly building approvals data registered a sharp drop of 11% from the previous month in seasonally adjusted terms.

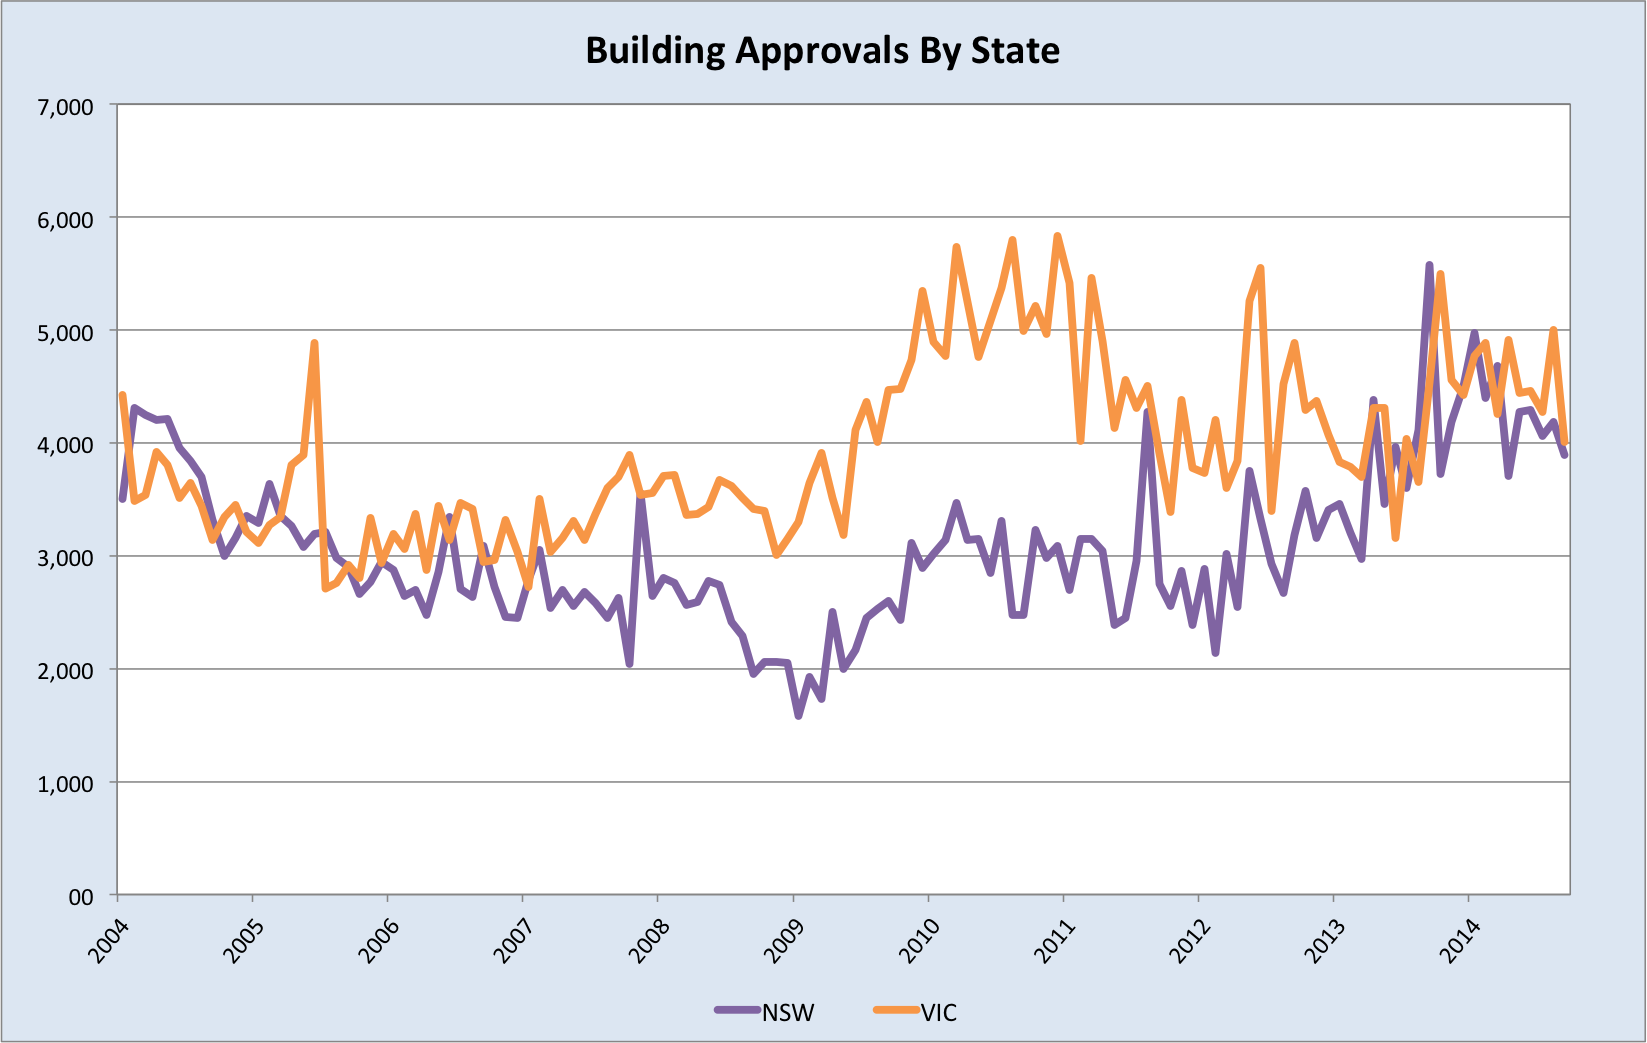
As you can see, the overall fall was largely due to the fall in approvals for units (apartments), which declined 21.9% between August and September. Since Melbourne is determined to become ‘Manhattan Down Under’, much of the apartment building surge has been concentrated in Victoria. Unsurprisingly then, September’s fall in national approvals was driven by Victoria.

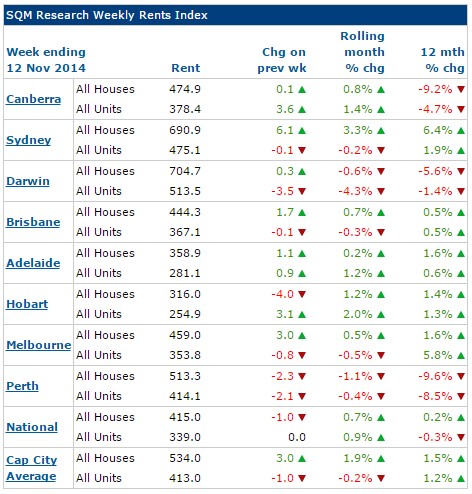
These data are fairly volatile, so one month doesn’t tell us a great deal. We’ll get the October data next week, and it will be interesting to see if approvals rebound. However, with rents growing far slower than house prices, increases in housing supply will steadily inflate valuations.


Following the steep decline in interest rates between November 2011 and August 2013, the economic case for investing in houses improved substantially. But the consequences of this, namely house price growth far outstripping rental growth as investors piled in and supply increased, have eroded the attractiveness of property as an investment. Of course, Australian housing investors are not in it for the yield, they are in it for capital gains. Nevertheless, after-tax cash flow is important for justifying the borrowing required to speculate on houses, so tumbling yields will, in time, crimp investment demand. Valuations could go truly idiotic in the meantime, but eventually more cuts are going to be required to keep the party rolling. As I’ve mentioned, I can see it running for another 6 months or so, absent some external shock, before cooling on its own accord. If the structural downturn bites harder, property could easily roll over sooner.
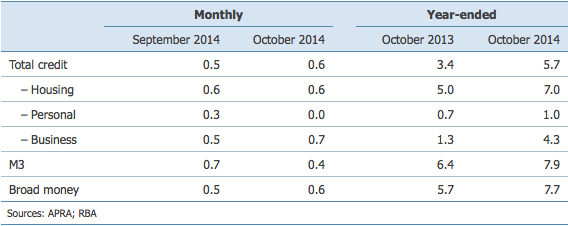
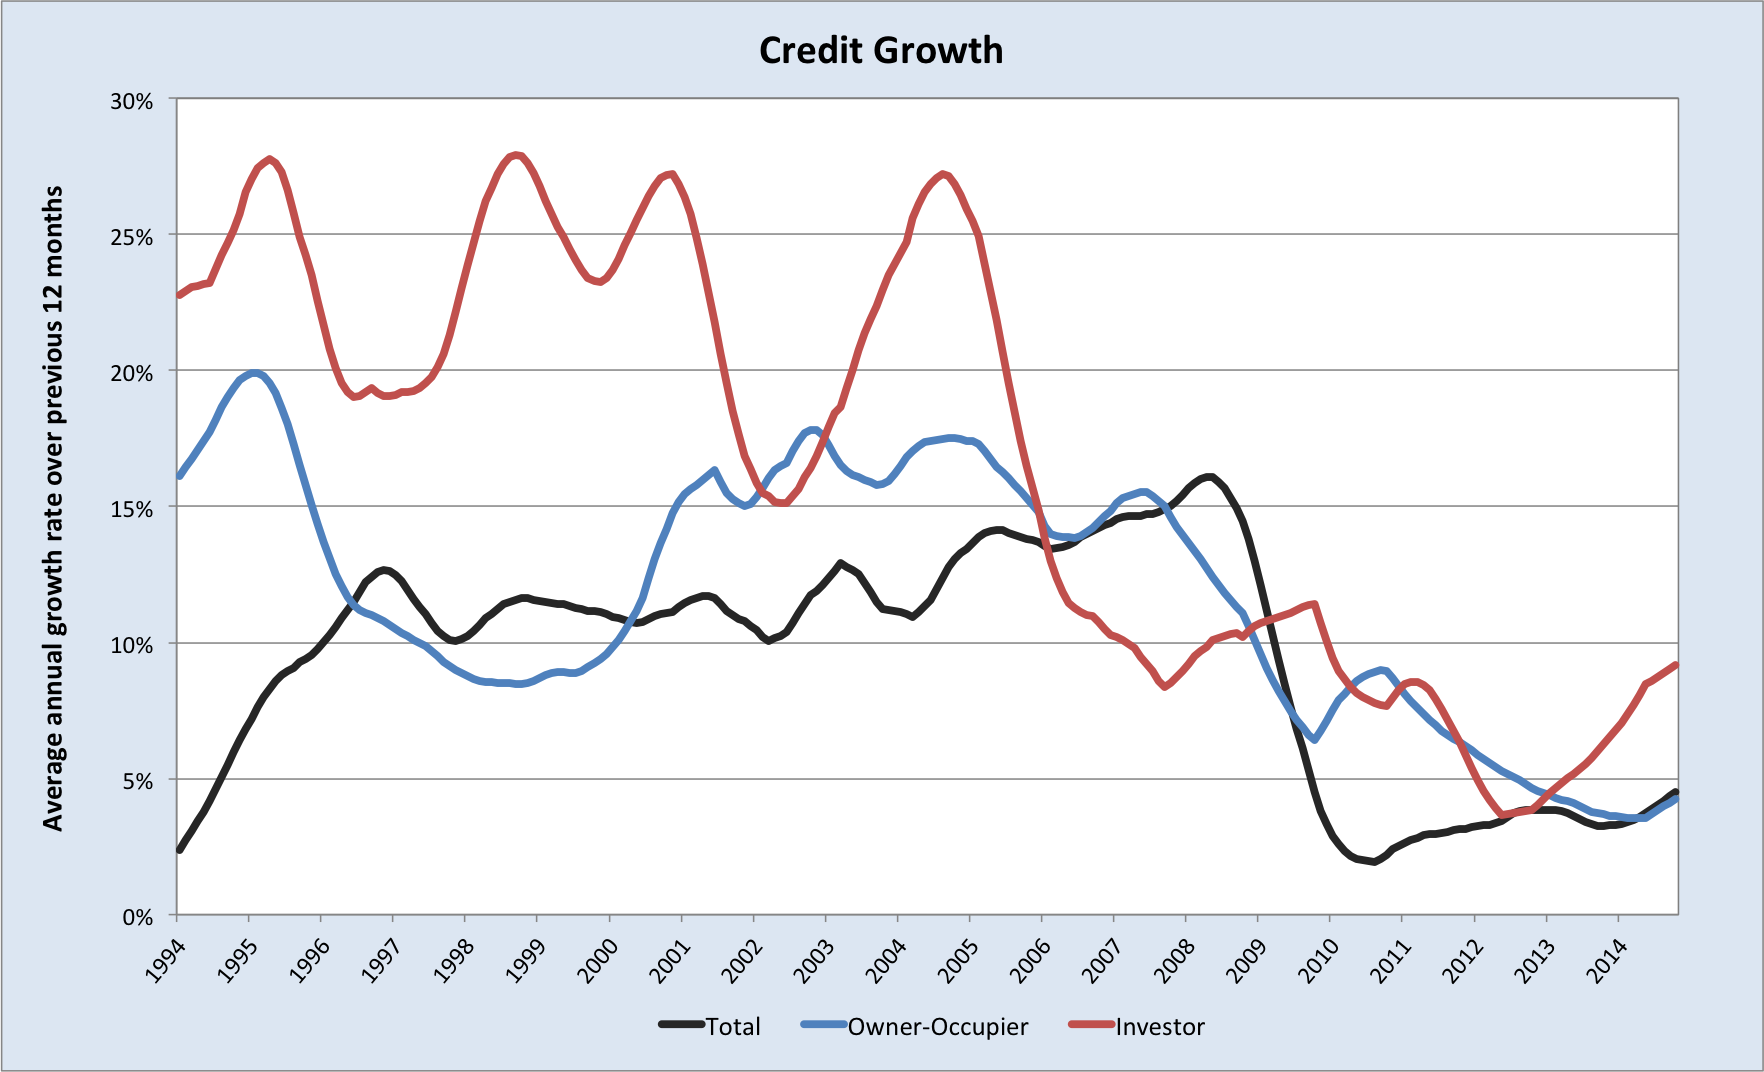
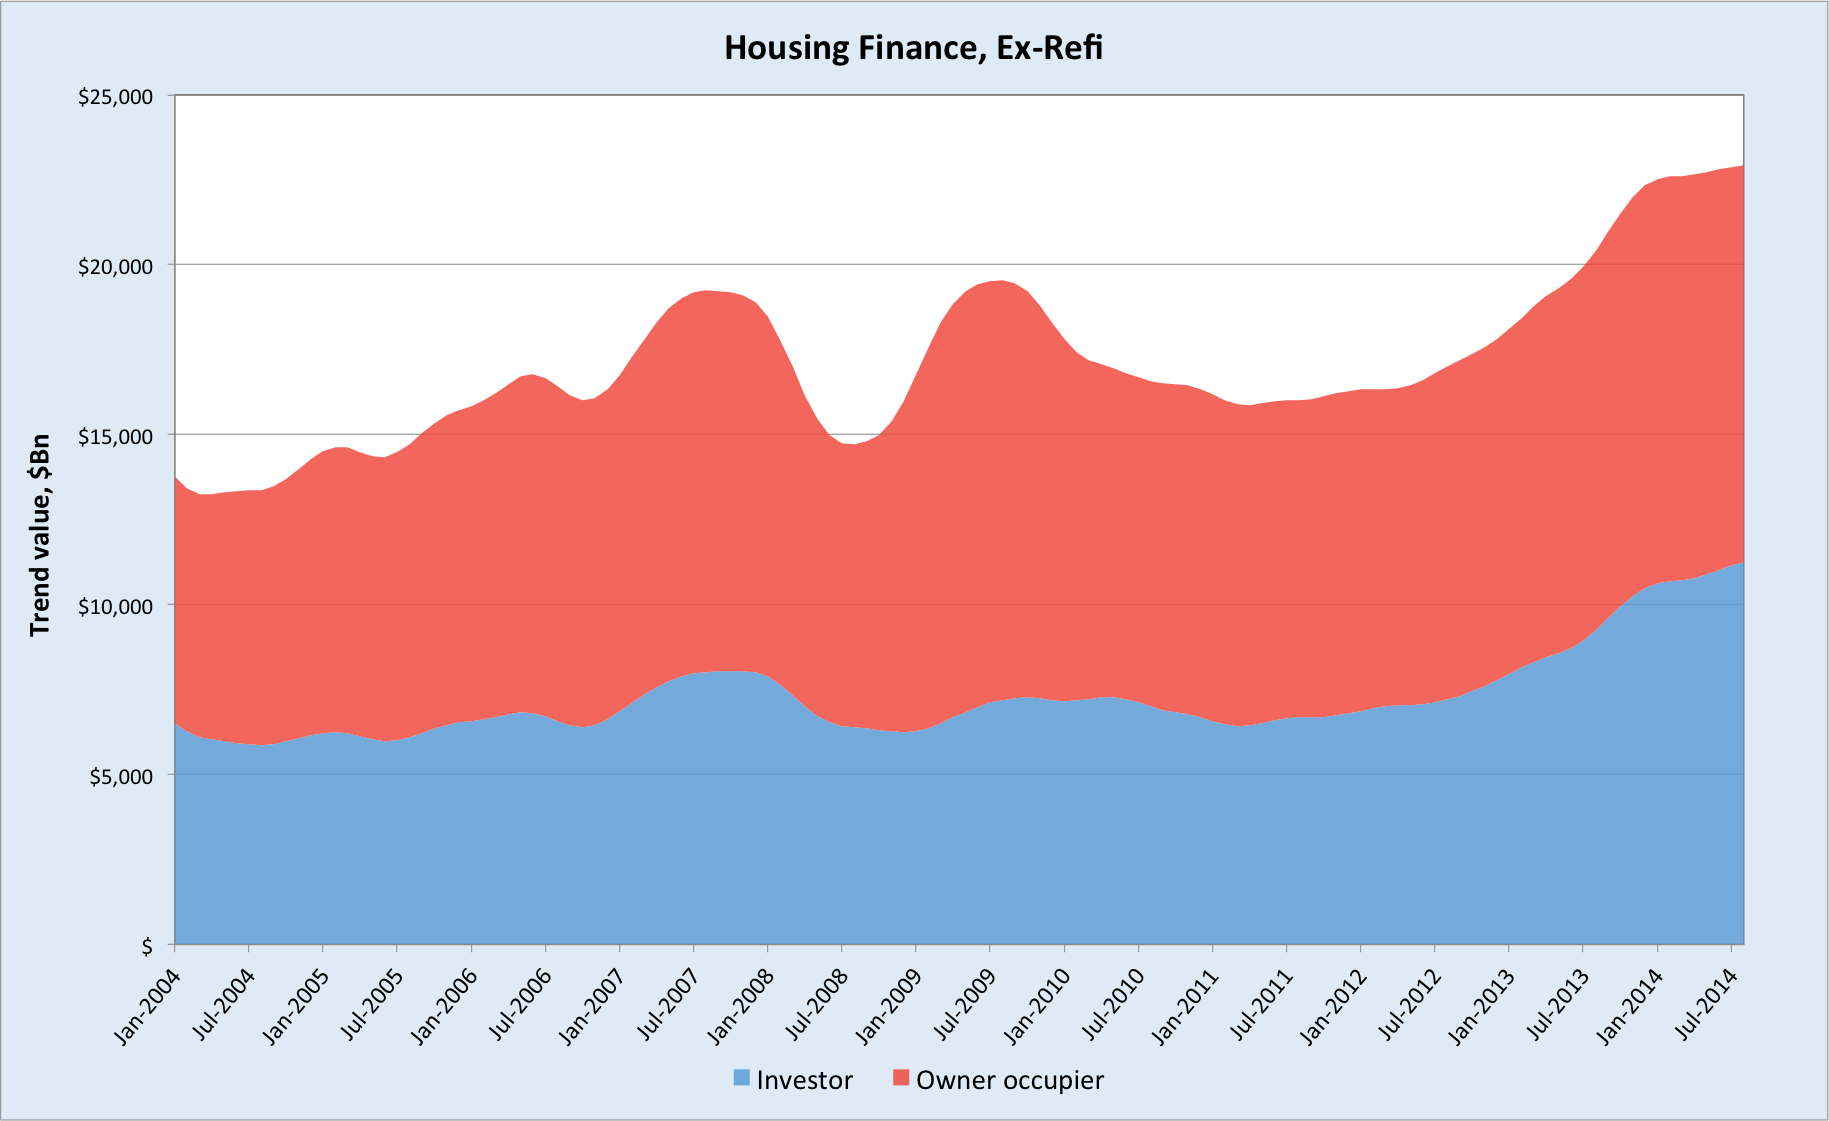
The RBA released credit data for October today, which showed an uptick in credit growth over the month.

In comparison to the last speculative housing boom, overall credit growth has been subdued. It is important to recognize though that we’re beginning from a much higher base level of debt this time around. The jump in investor loans is therefore a concern, despite the growth rate being low historically. Also, with national income set to decline, expansions in risky borrowing are undesirable and potentially destabilising; cutting rates could fuel this fire.
This leads some observers, such as those in the OECD, to argue that current activity in the property market is enough to warrant higher interest rates. Higher rates would certainly hit this sector, but they would also hit the economy very hard, right as it’s entering a pronounced structural slowdown. This would be madness, in my view, and its why I cannot see rates rising. There are other tools to slow housing, and the RBA and APRA are presently canvassing their options. At most, if property burns brighter into the new year, it will defer interest rate cuts. In time, the structural weaknesses of the economy will see property roll over. When it does, cuts to interest rates will follow quickly, if they have not already arrived.
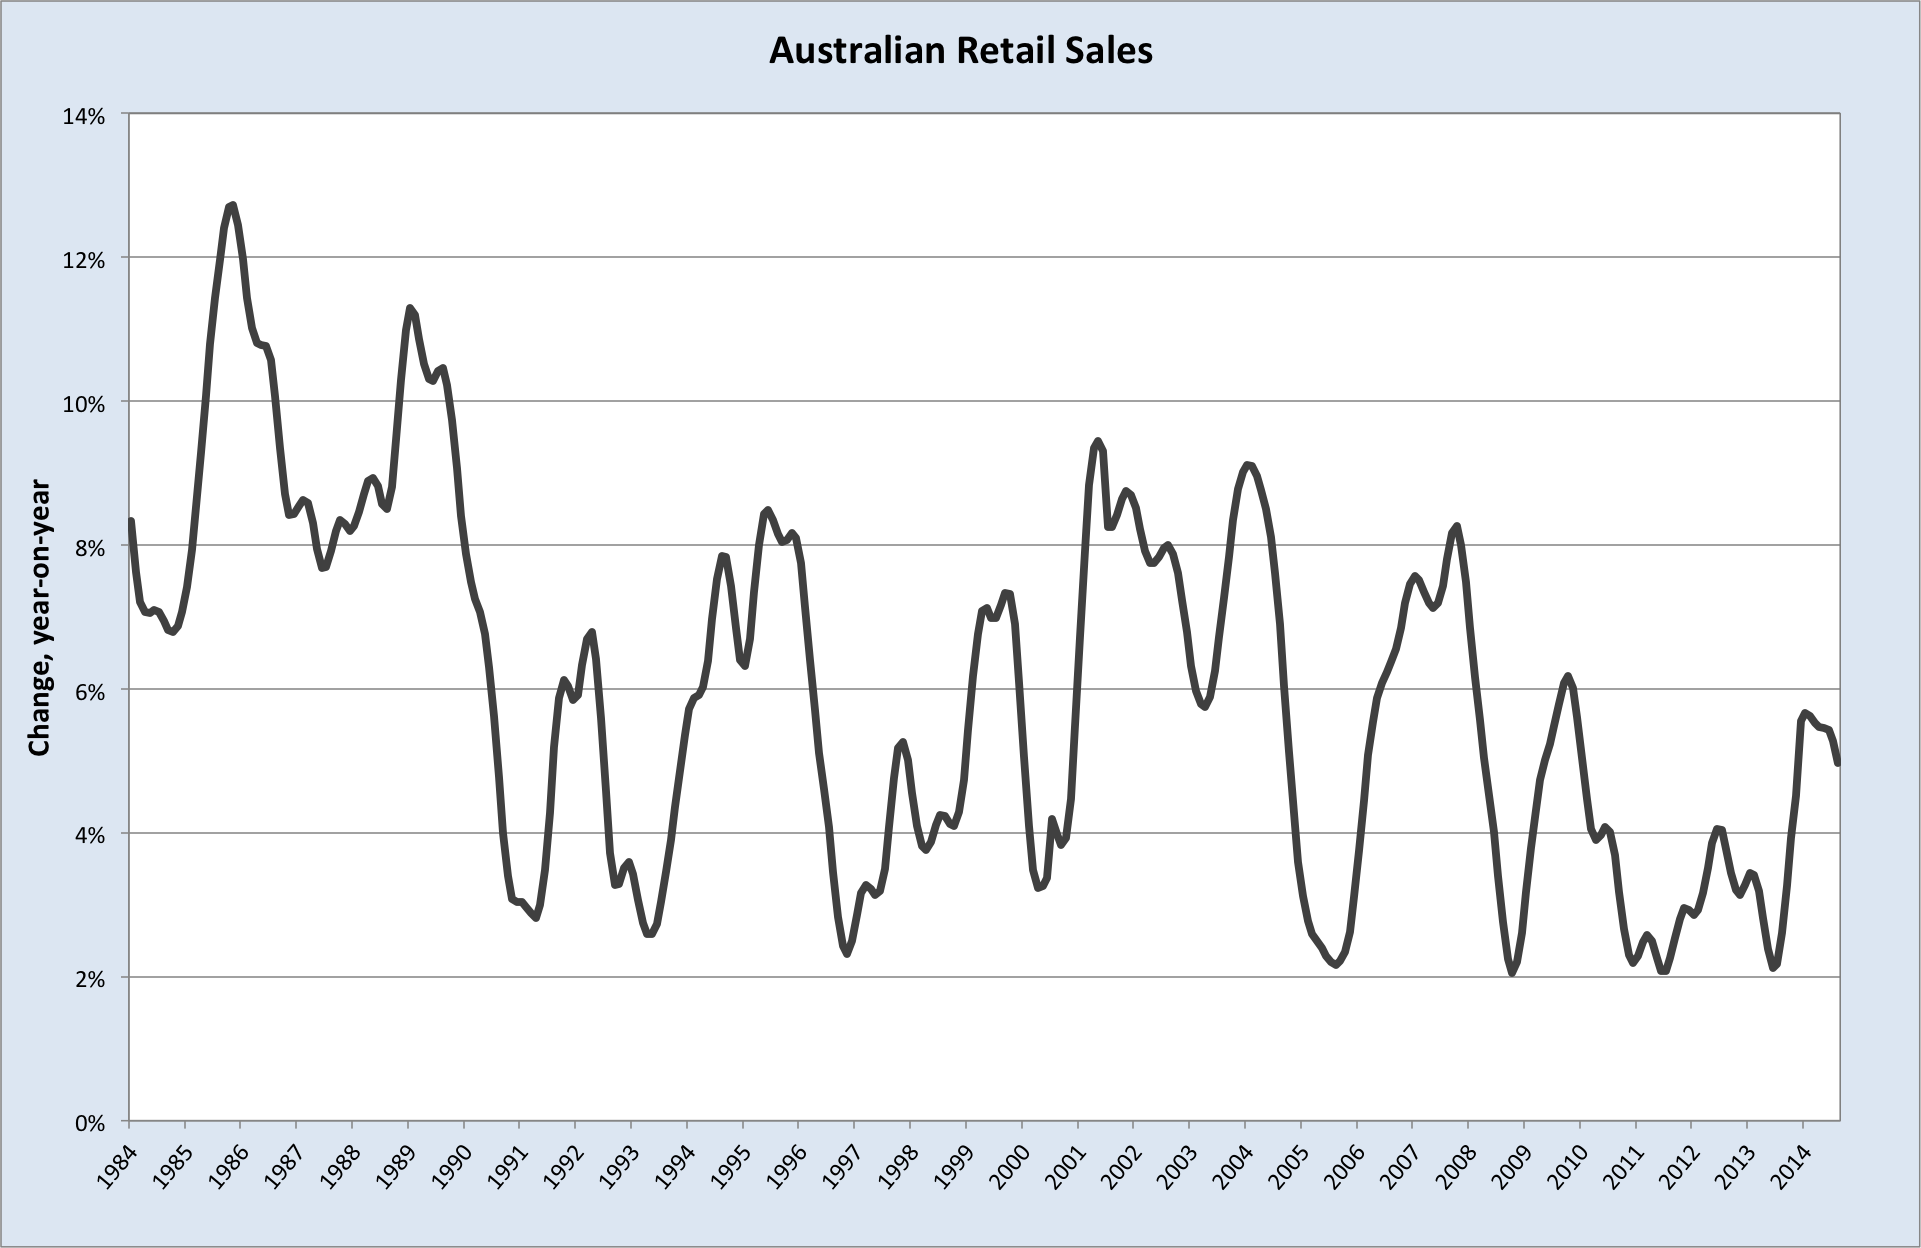
Consumers
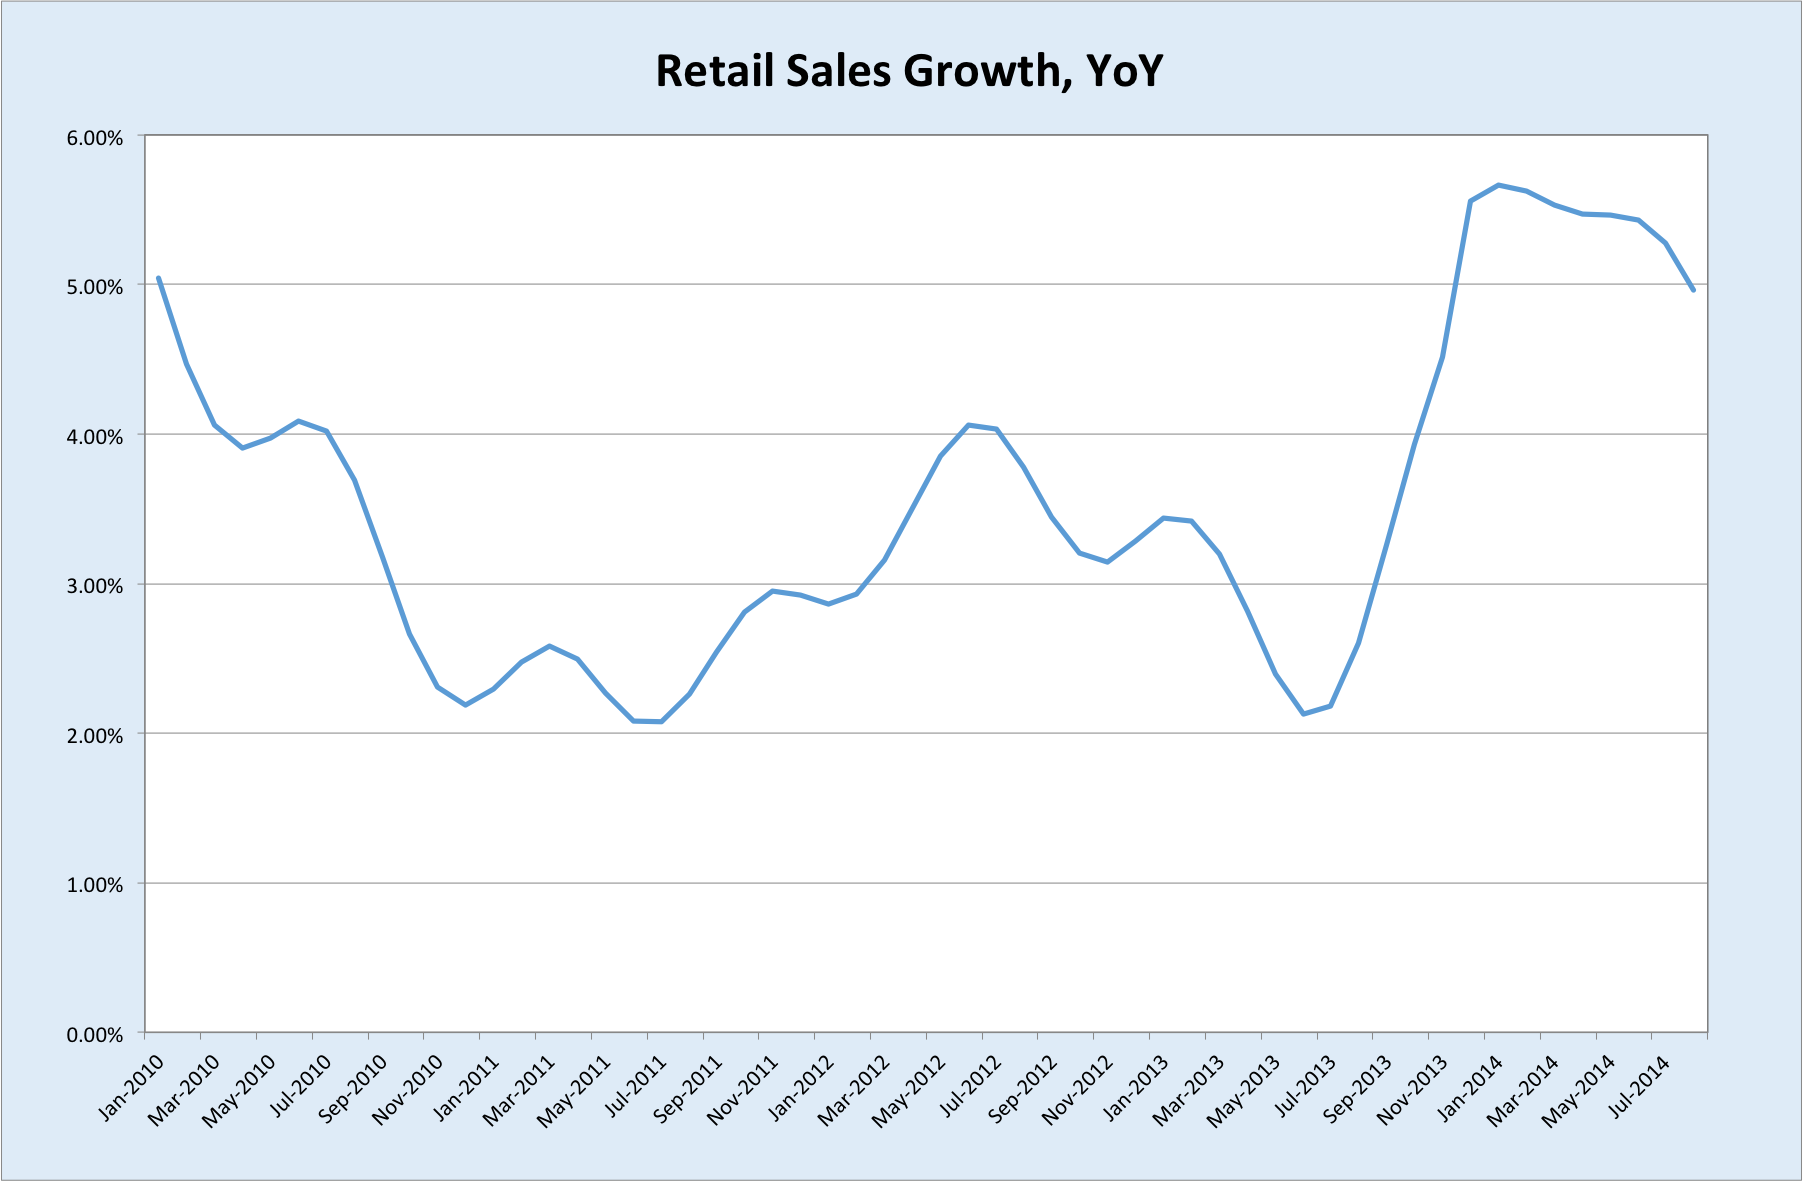
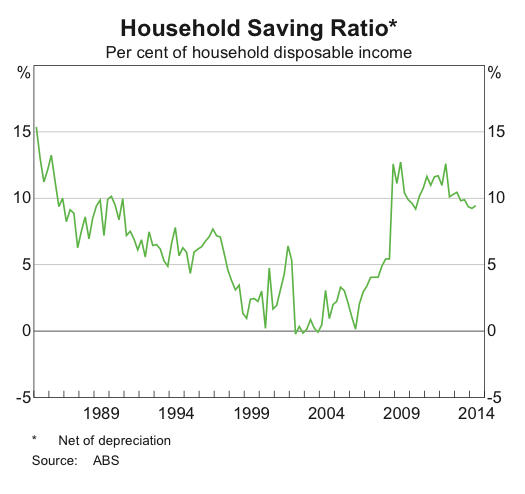
The Australian consumer is exhibiting less inclination to spend aggressively out of current income than during previous property booms.

There’s been some divergence in consumer sentiment reports this year, with the ANZ-Roy Morgan survey showing a mild improvement, but the Westpac-Melbourne Institute survey showing a weakening. From ANZ chief economist Warren Hogan:
Job vacancies data last week showed labour demand in the non-mining sector continues to gradually improve, particularly in labour-intensive industries such as construction, health and retail. Alongside low interest rates and rising house prices, this should support consumer confidence and retail spending as we head into the Christmas season.
And from Westpac chief economist Bill Evans:
In the near term, prospects for a boost in consumer spending going into the end of the year are not encouraging.
So, ‘who really knows what consumers are thinking right now?’ , seems to be the conclusion. The large decline in oil prices could help sentiment if it ever feeds through to petrol prices. But the salient point, I think, is that as the terms of trade bust and investment downturn gather pace, and as public balance sheets deteriorate, it’s going to be increasingly hard for the consumer to remain so upbeat and willing to spend that he/she overrides this structural downturn.
In any case, with national income falling, consumers will need to dig deeply into savings to deliver the jump in spending required to lift interest rates. As long as the savings ratio remains elevated, consumption will not rise strongly enough to overwhelm weakness elsewhere.
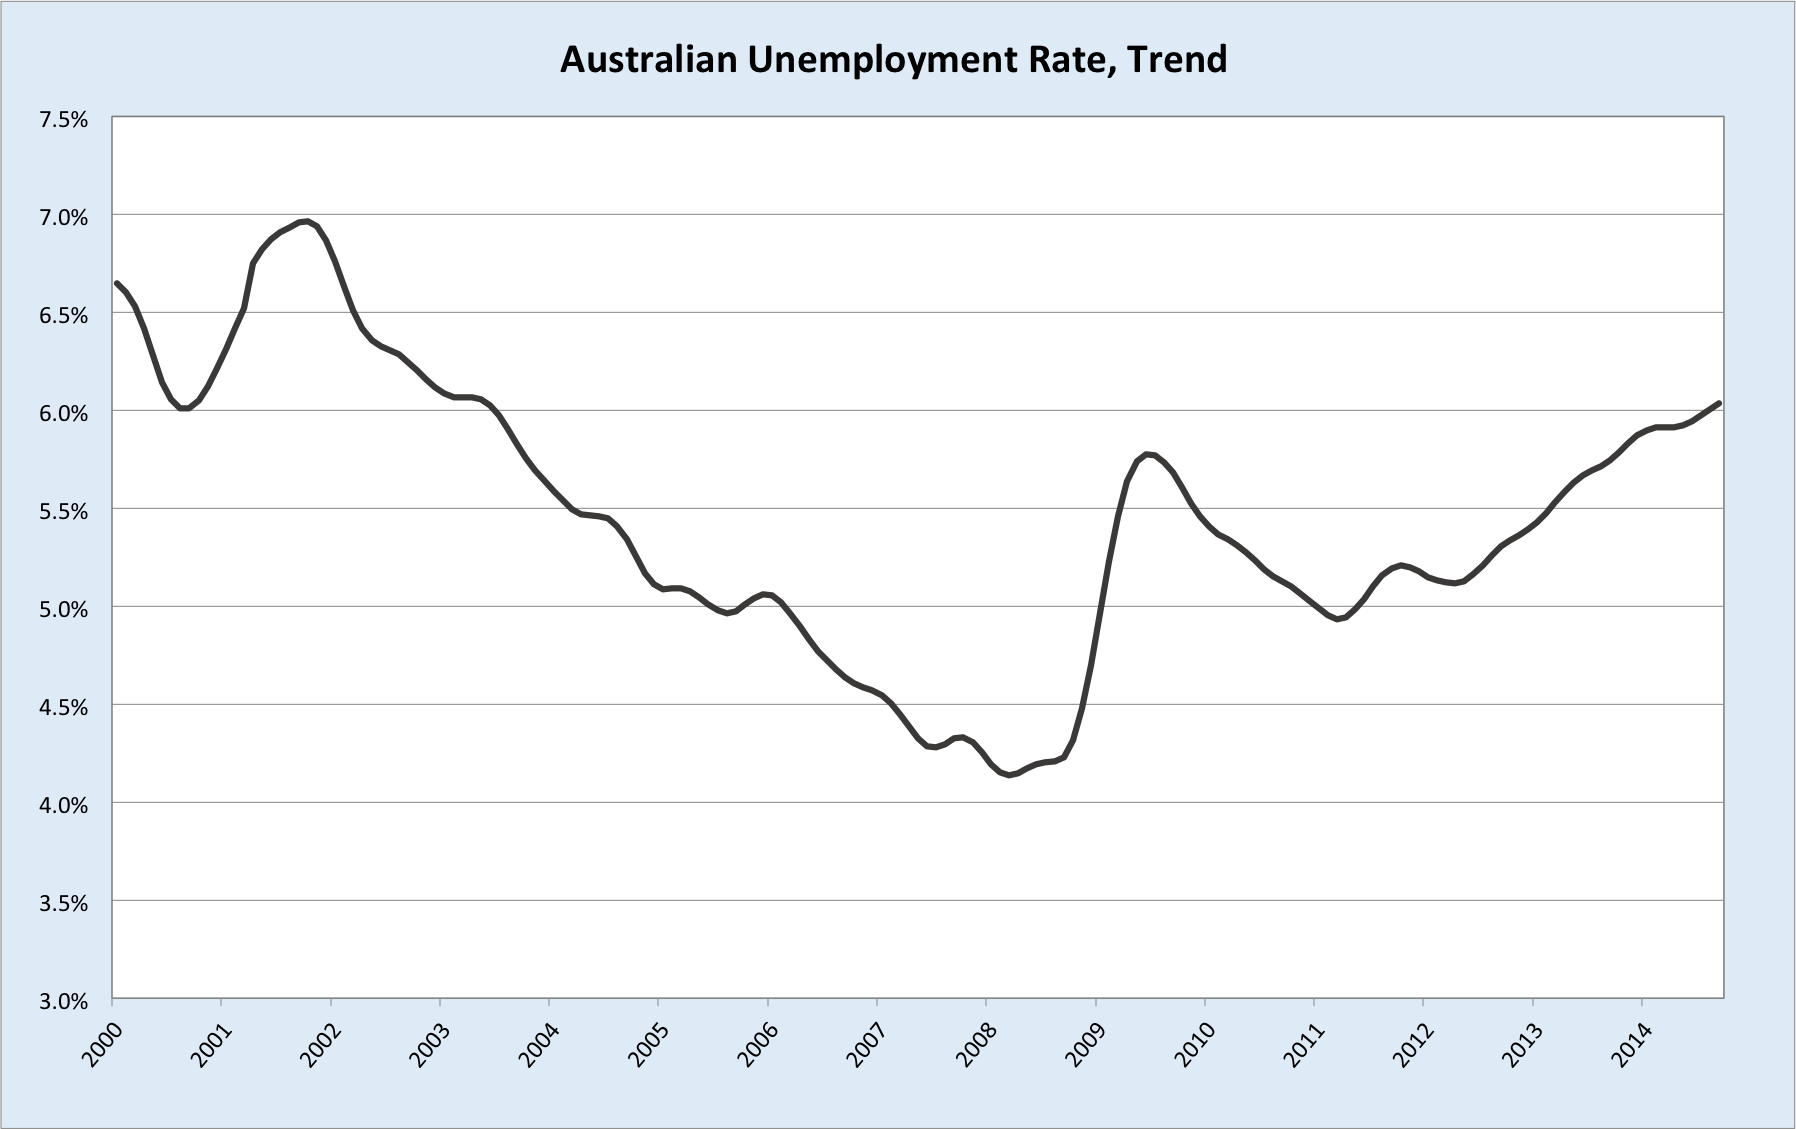
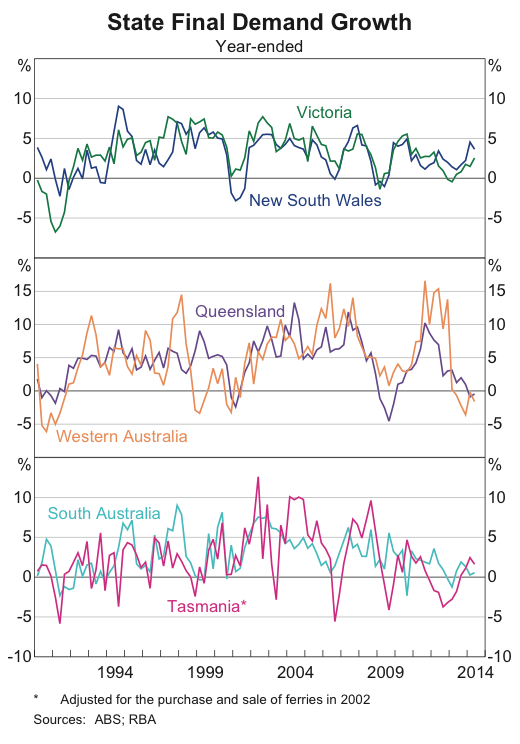
Employment
The Australian Bureau of Statistics’ labour force survey has suffered well-publicised issues in recent months, so the official data is not as reliable as it ought to be, but the trend in unemployment remains up.

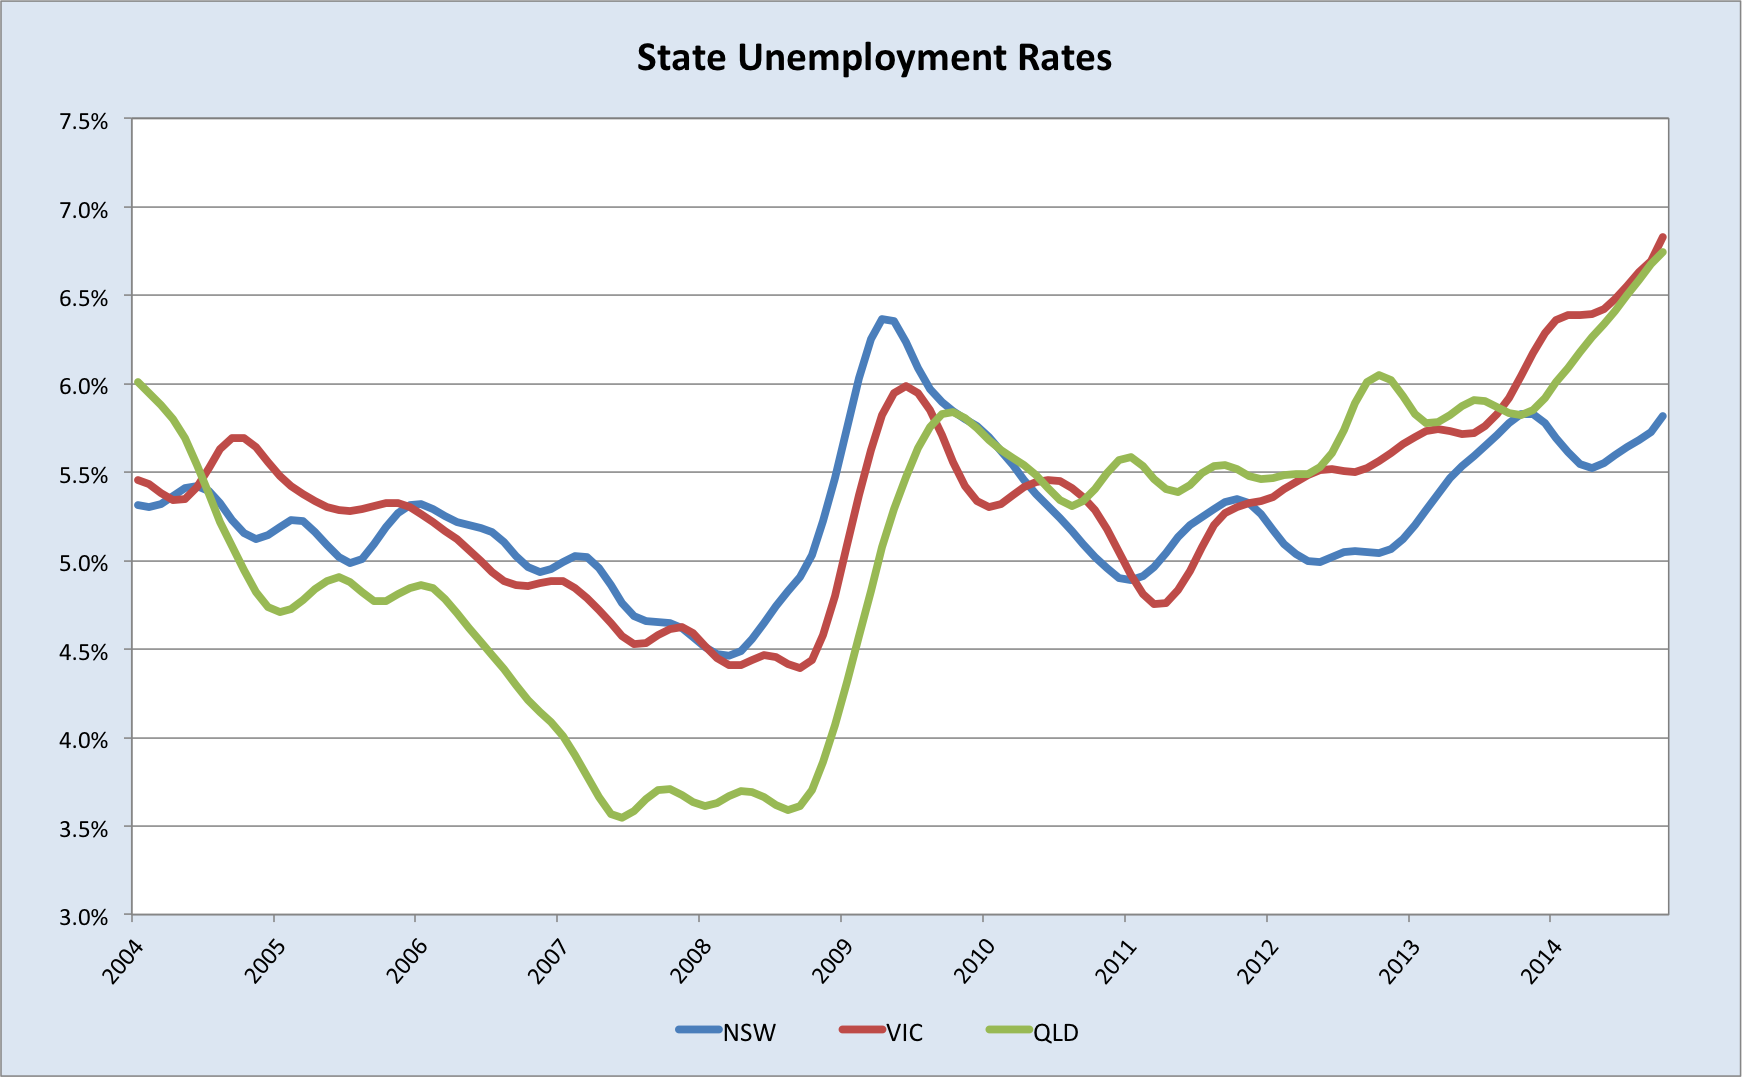
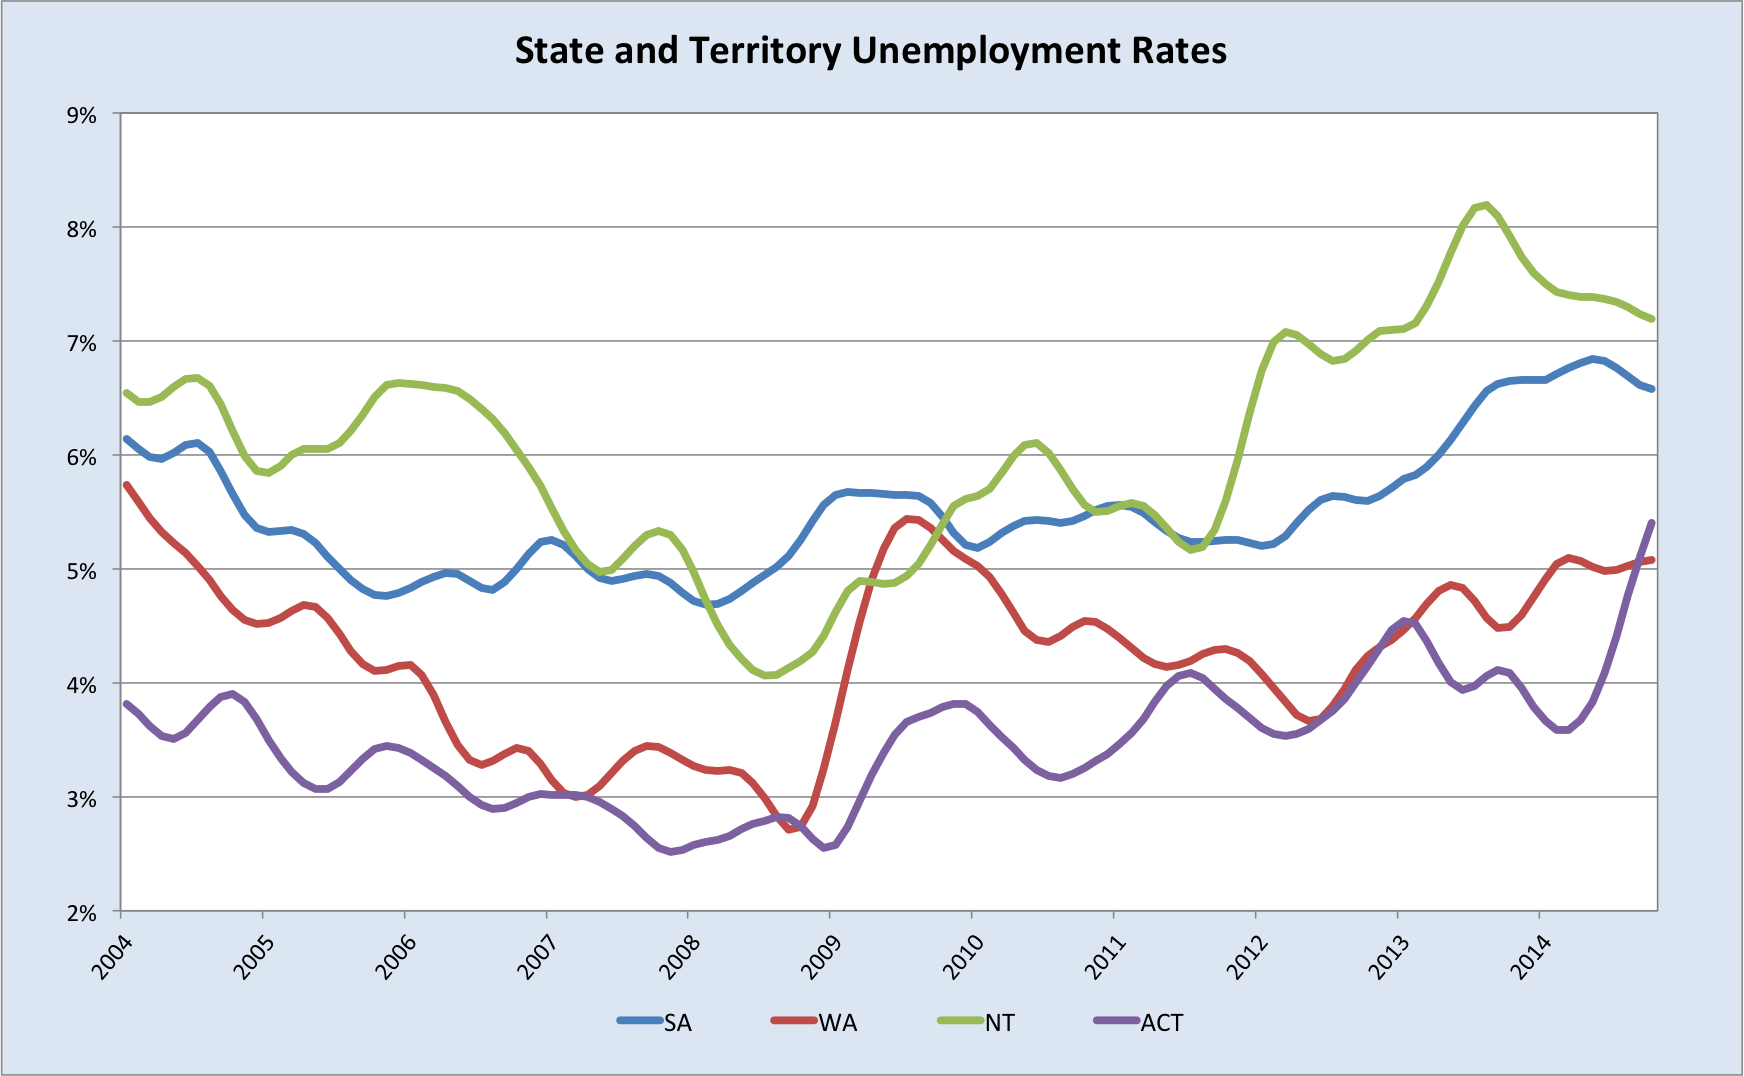
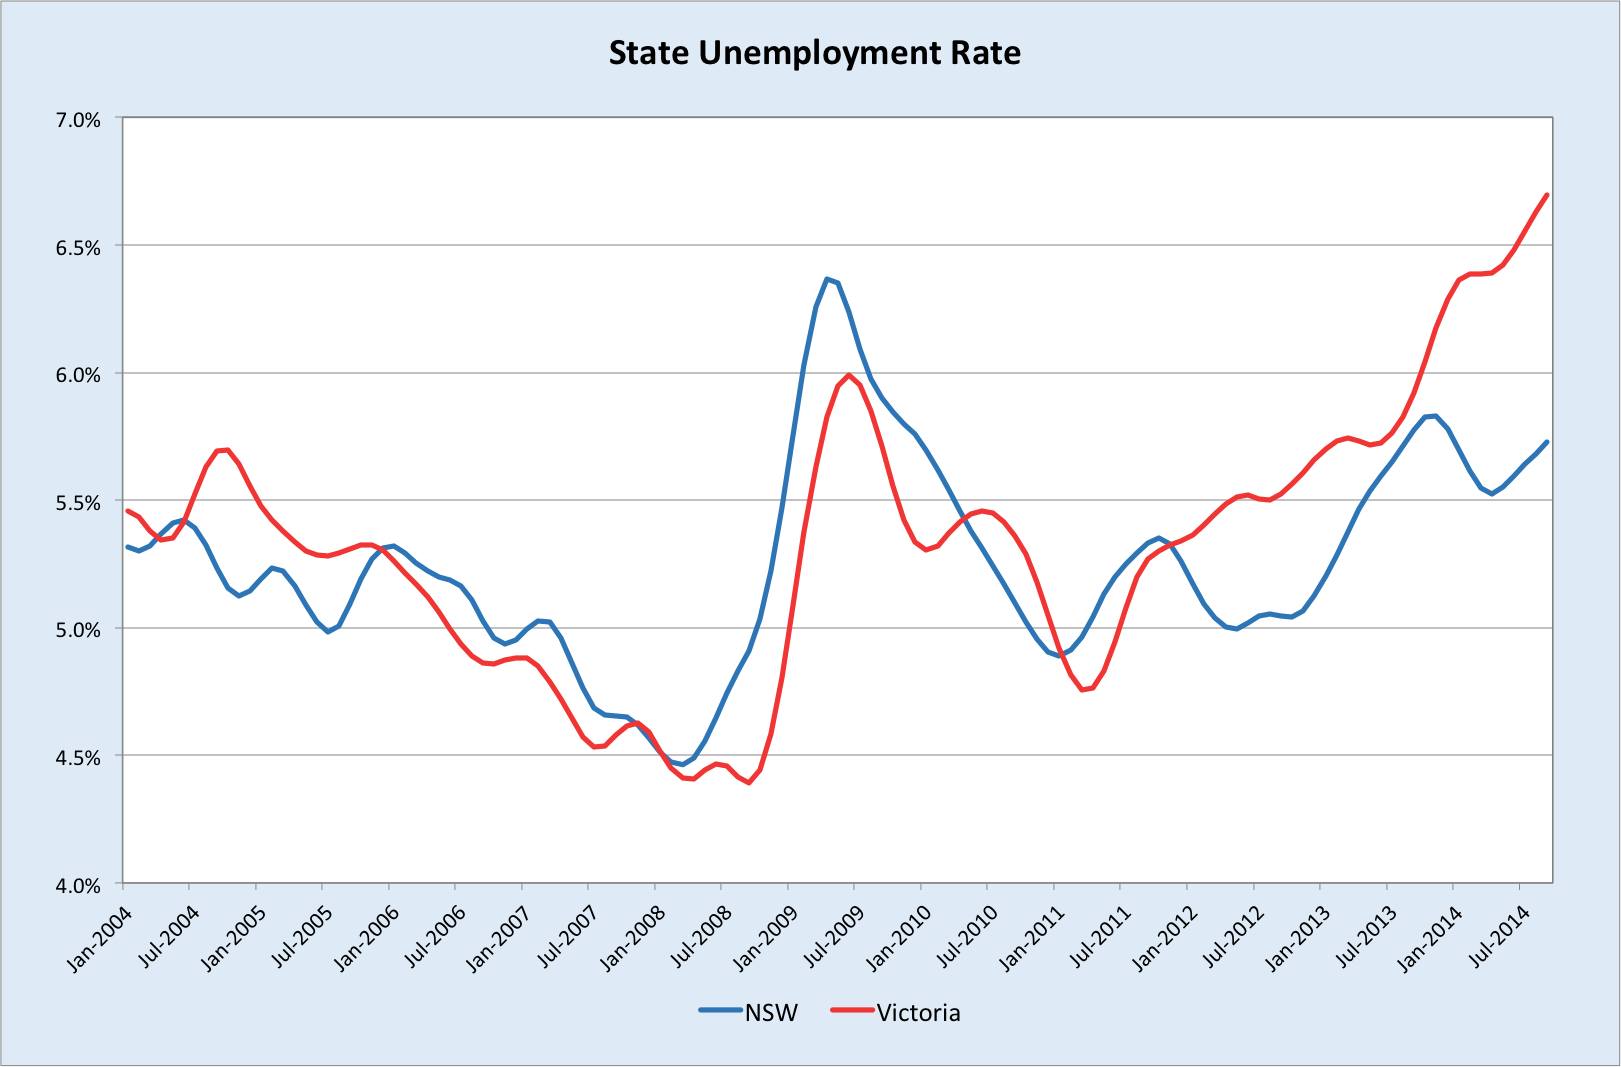
And here’s the breakdown of the states and territories:


Public sector layoffs in the ACT and Queensland, along with the beginning of the LNG investment wind-down in the latter, are hurting employment in those states, and will continue to do so. Strong population growth is driving the Victorian economy at present, instead of the other way around. While this works at the aggregate level, with overall state demand rising, it’s meant that unemployment has trended higher. Also troubling is the stubborn rate of unemployment in NSW, in spite of its property bonanza over the past couple of years. With the most spritely phase of the boom likely past, it’s difficult to see where a sustained improvement in employment will come from.
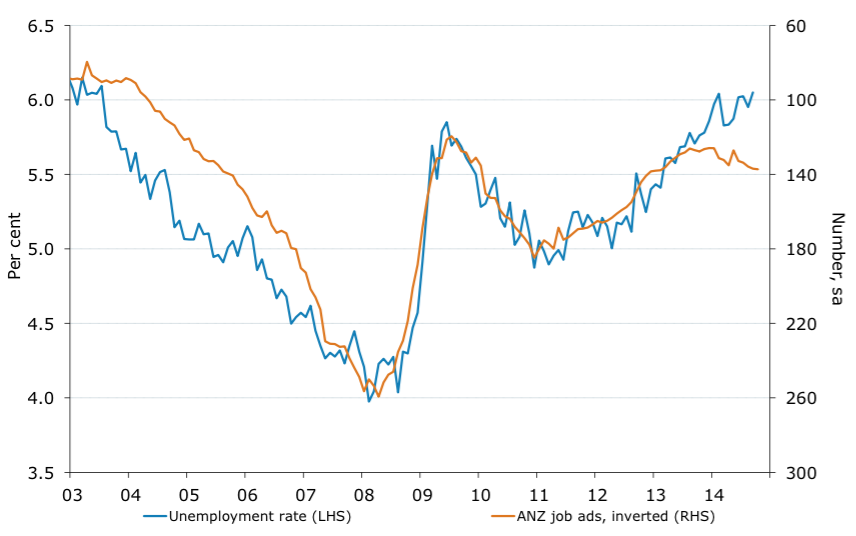
Warren Hogan obviously disagrees, and cites the ANZ job ads report as evidence:
The modest improvement in ANZ job ads in October is an encouraging sign that the pick-up in labour demand is continuing. In our view, this should feed into better employment growth outcomes and see the unemployment rate stabilise.


As you can see on the second chart, there’s been a clear divergence in the past 18 months between job ads and the unemployment rate. This is historically unusual, and indicates either that the labour market is ready to turn, as ANZ’s economists believe, or that the economy is in the grip of a highly anomalous structural adjustment that will see existing jobs shed faster than new ones become advertised. Most of the uptick in job ads will be connected to the frothy segments of the NSW and Victorian property markets. As I’ve made abundantly clear, I am sceptical that this froth will last for much longer.
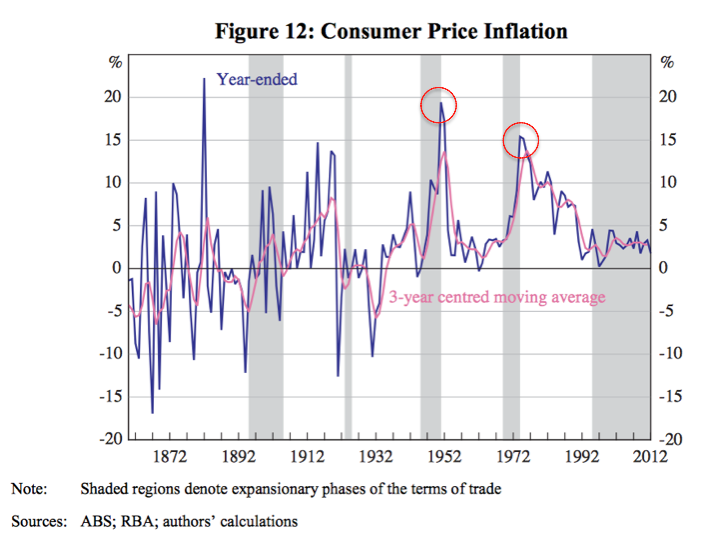
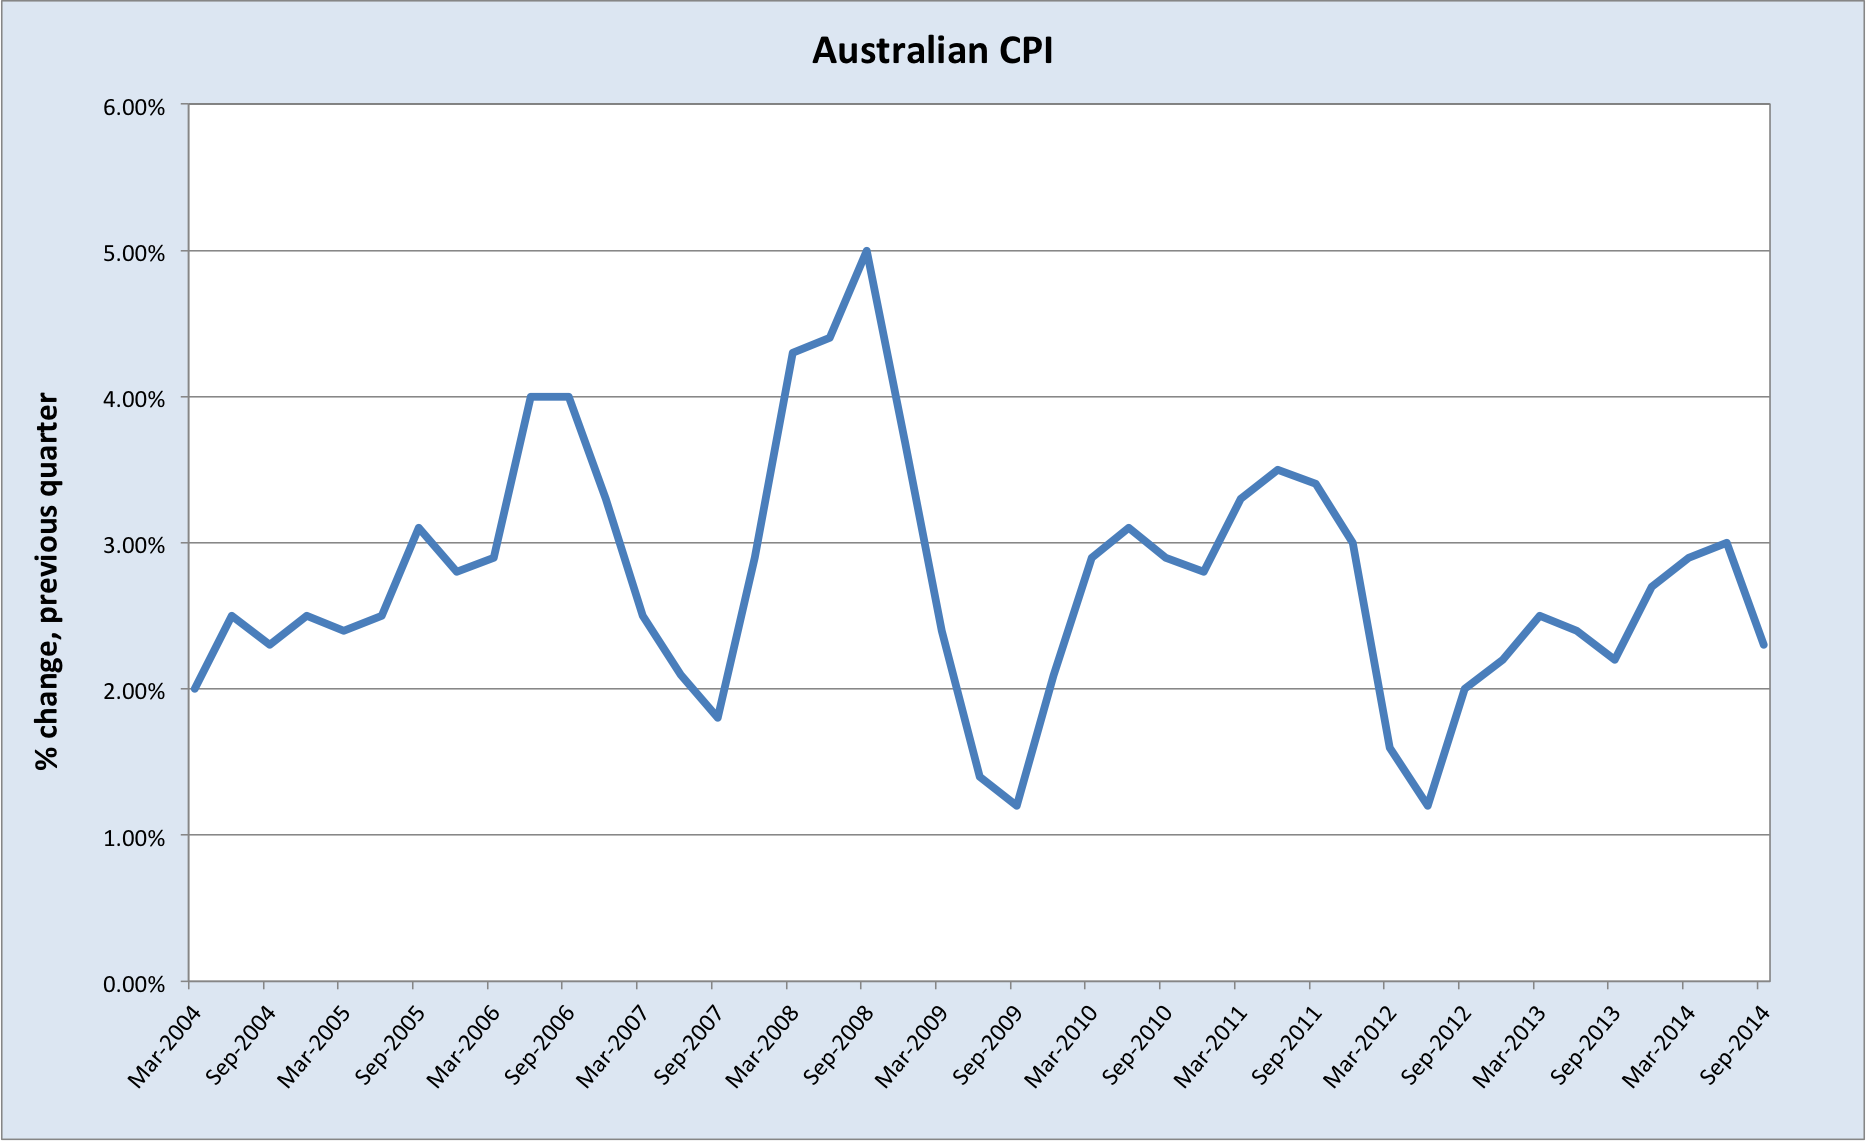
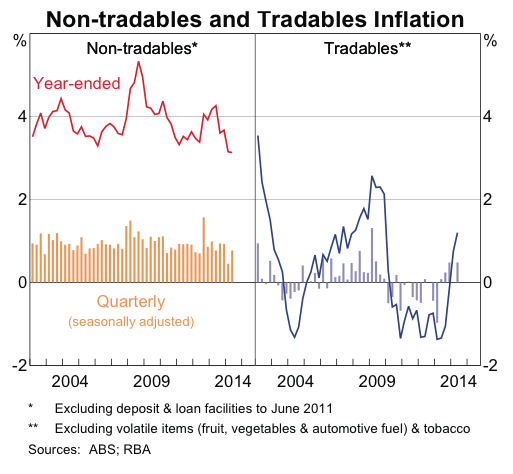
Inflation
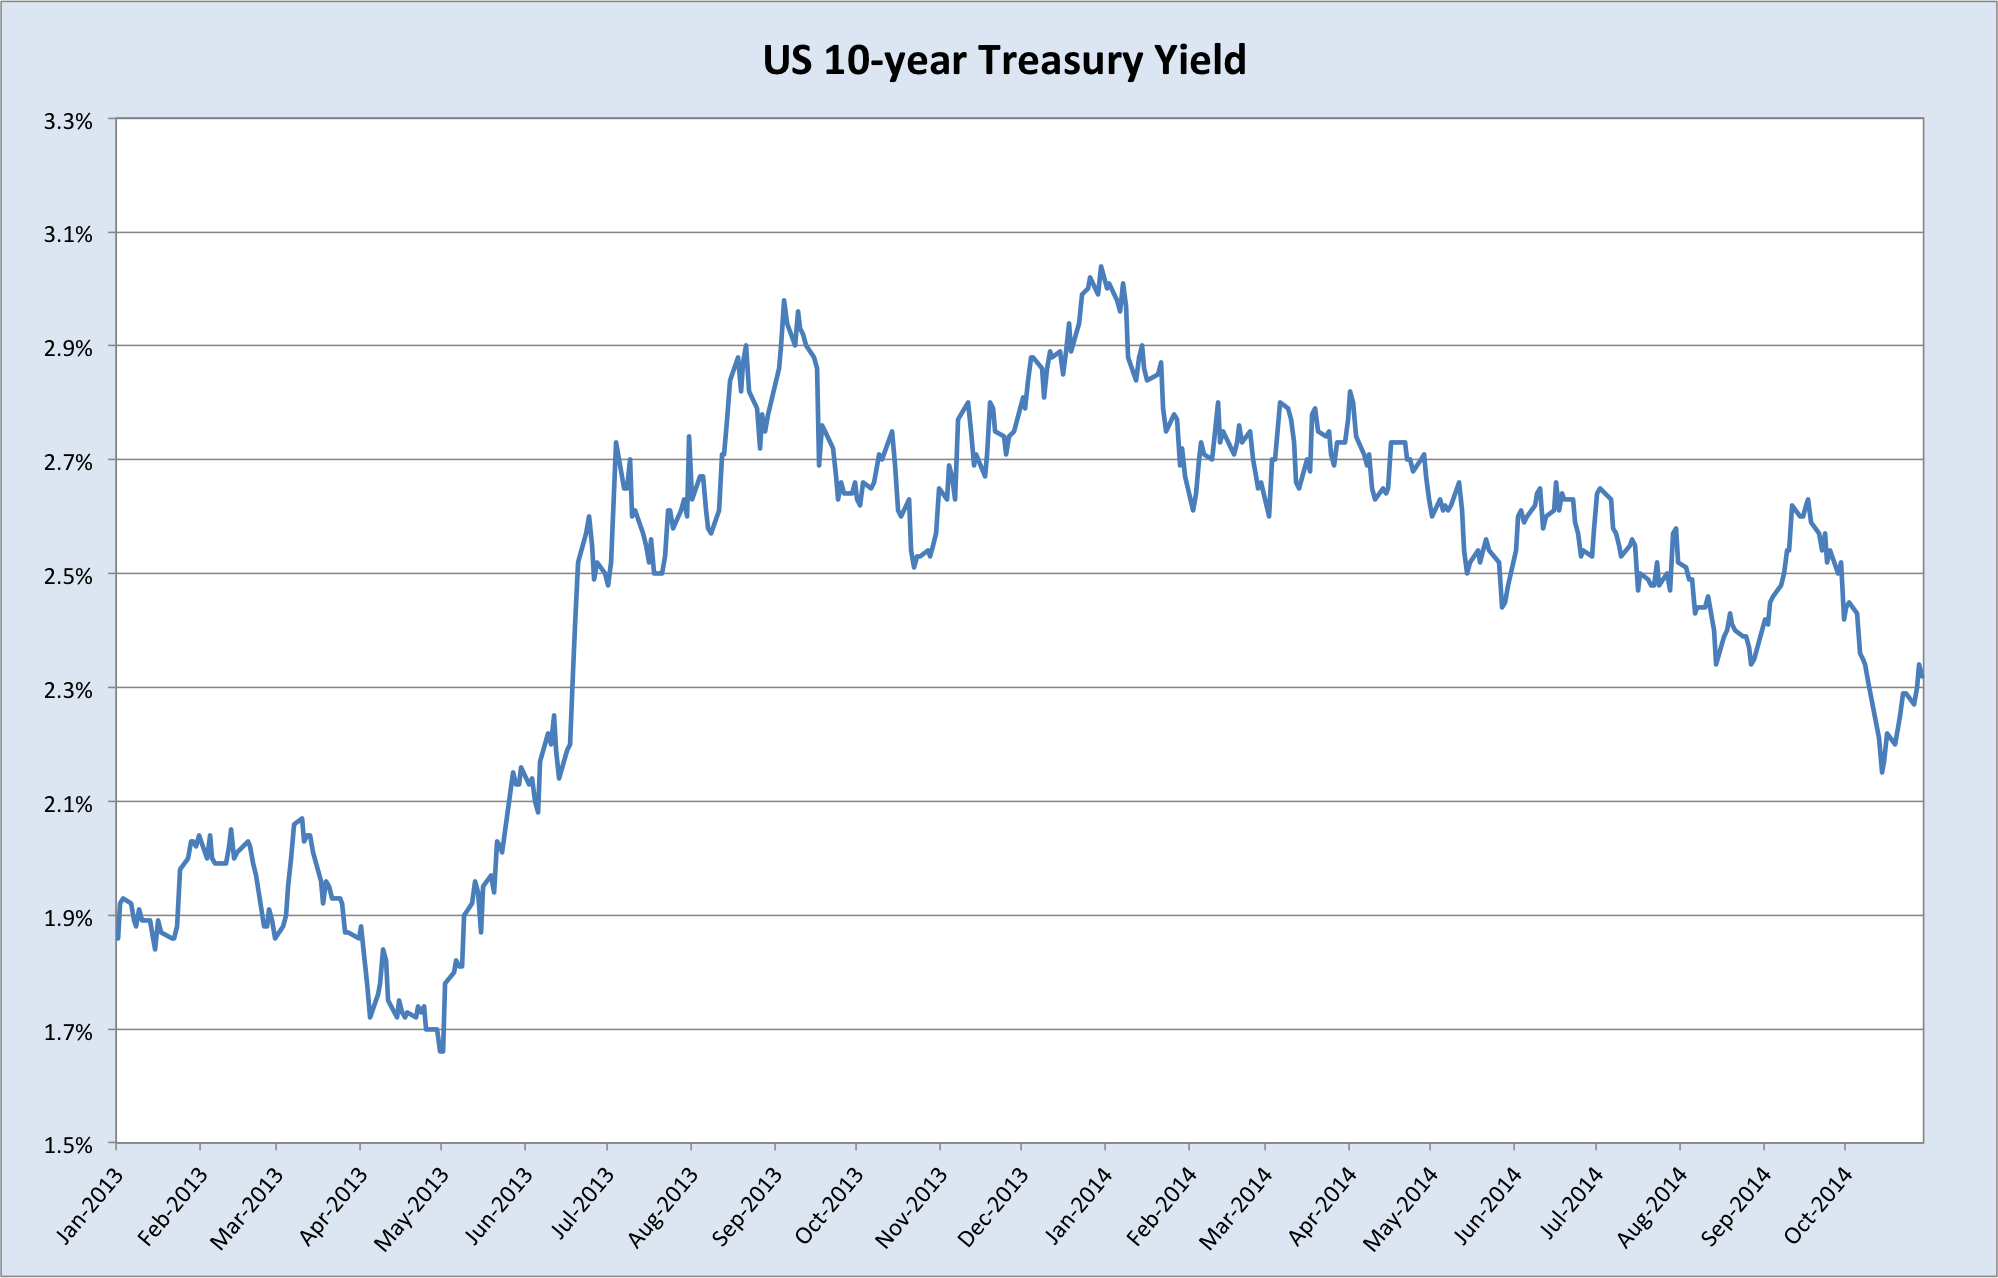
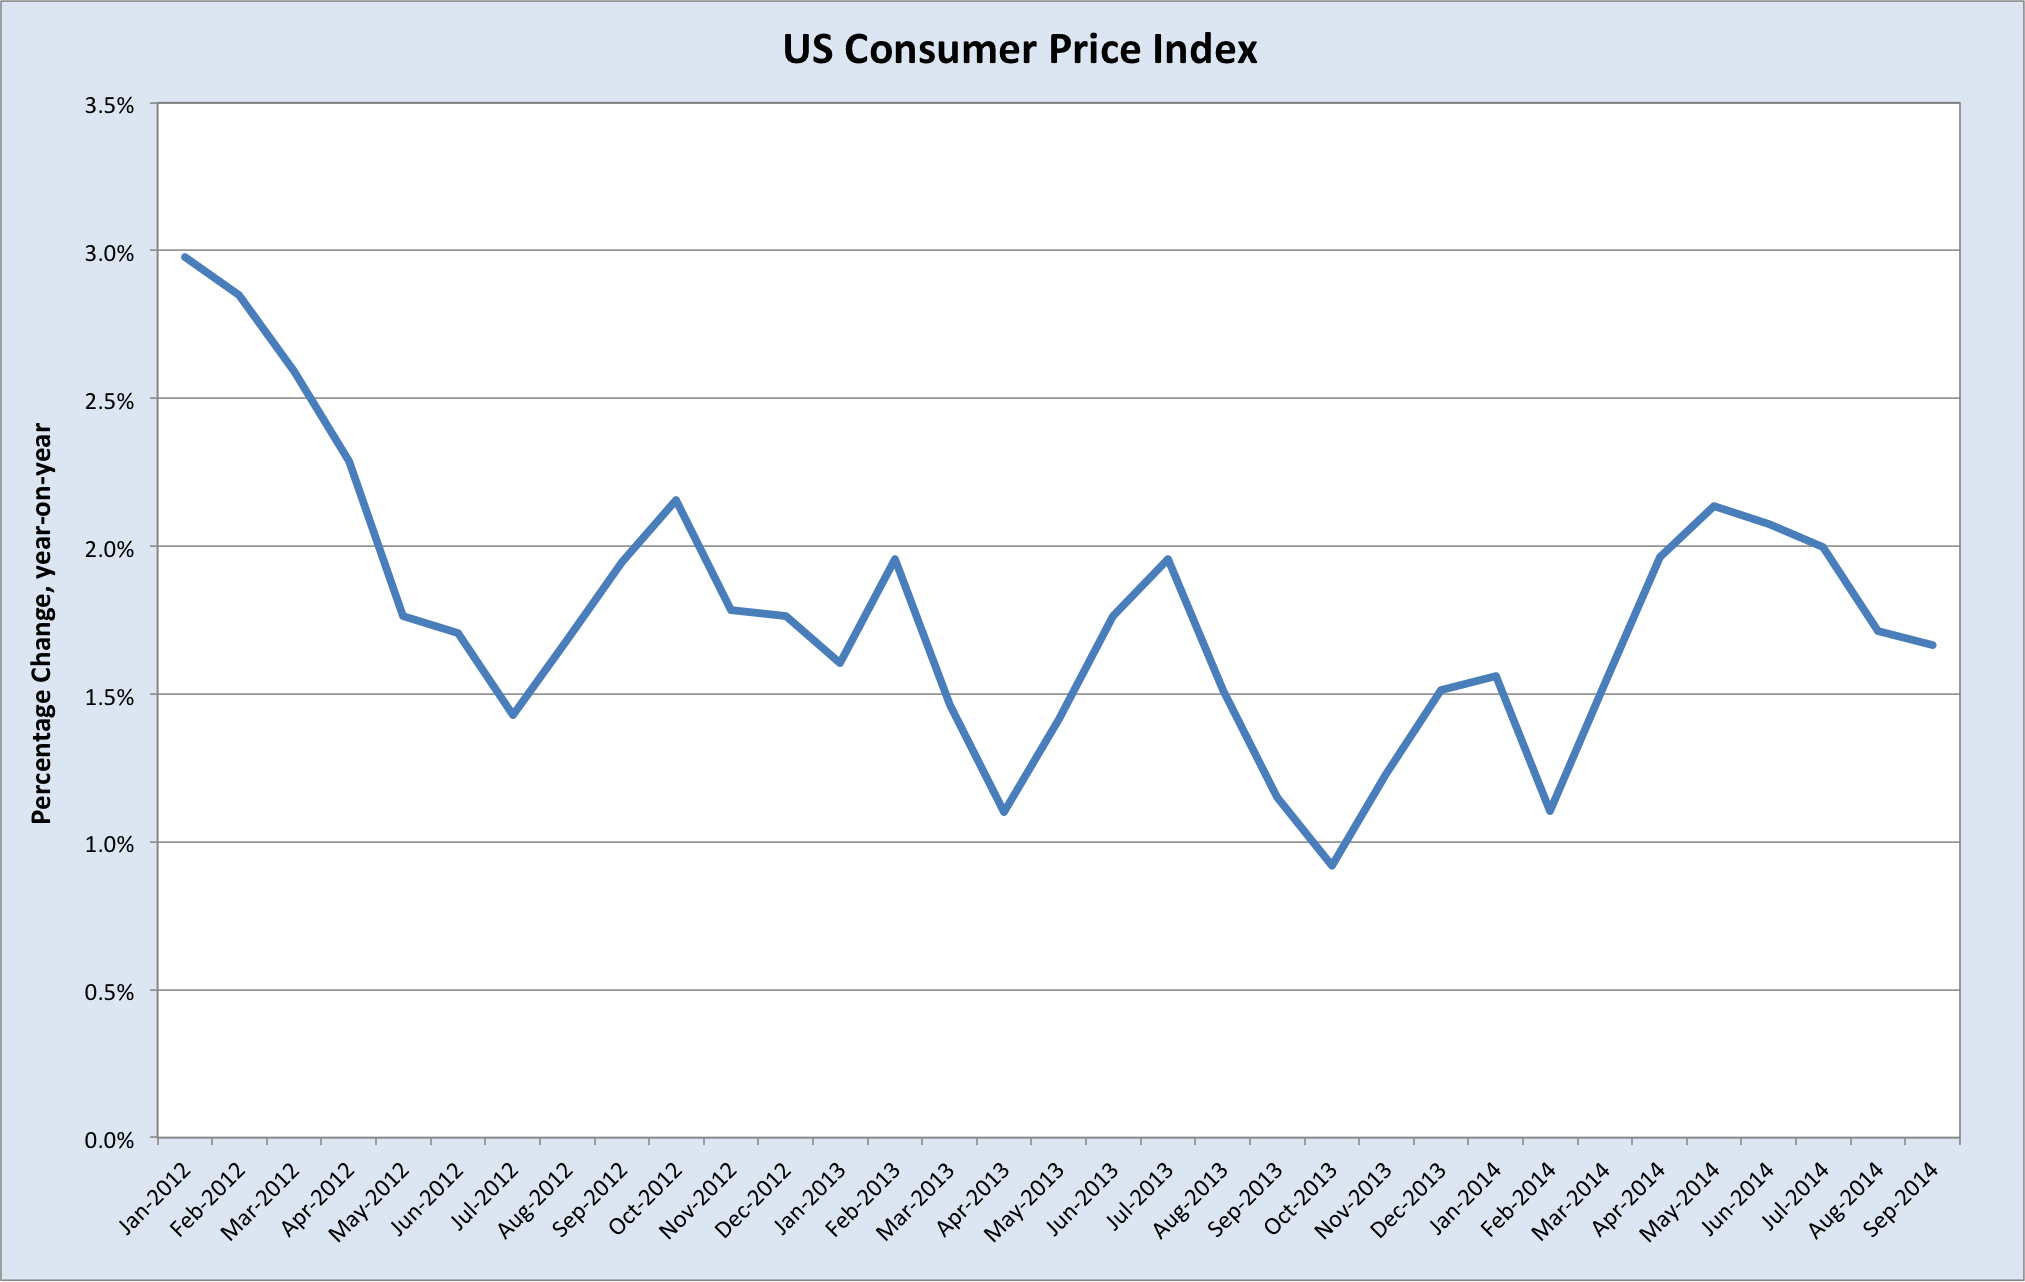
As discussed in the previous interest rates update, there’s little in the way of inflationary pressures for the RBA to worry about. Although the Consumer Price Index had bumped up against the top of the RBA’s band (2-3%), this was almost entirely driven by the depreciation in the Australian dollar last year, and therefore not something the RBA needed to counter with monetary policy.
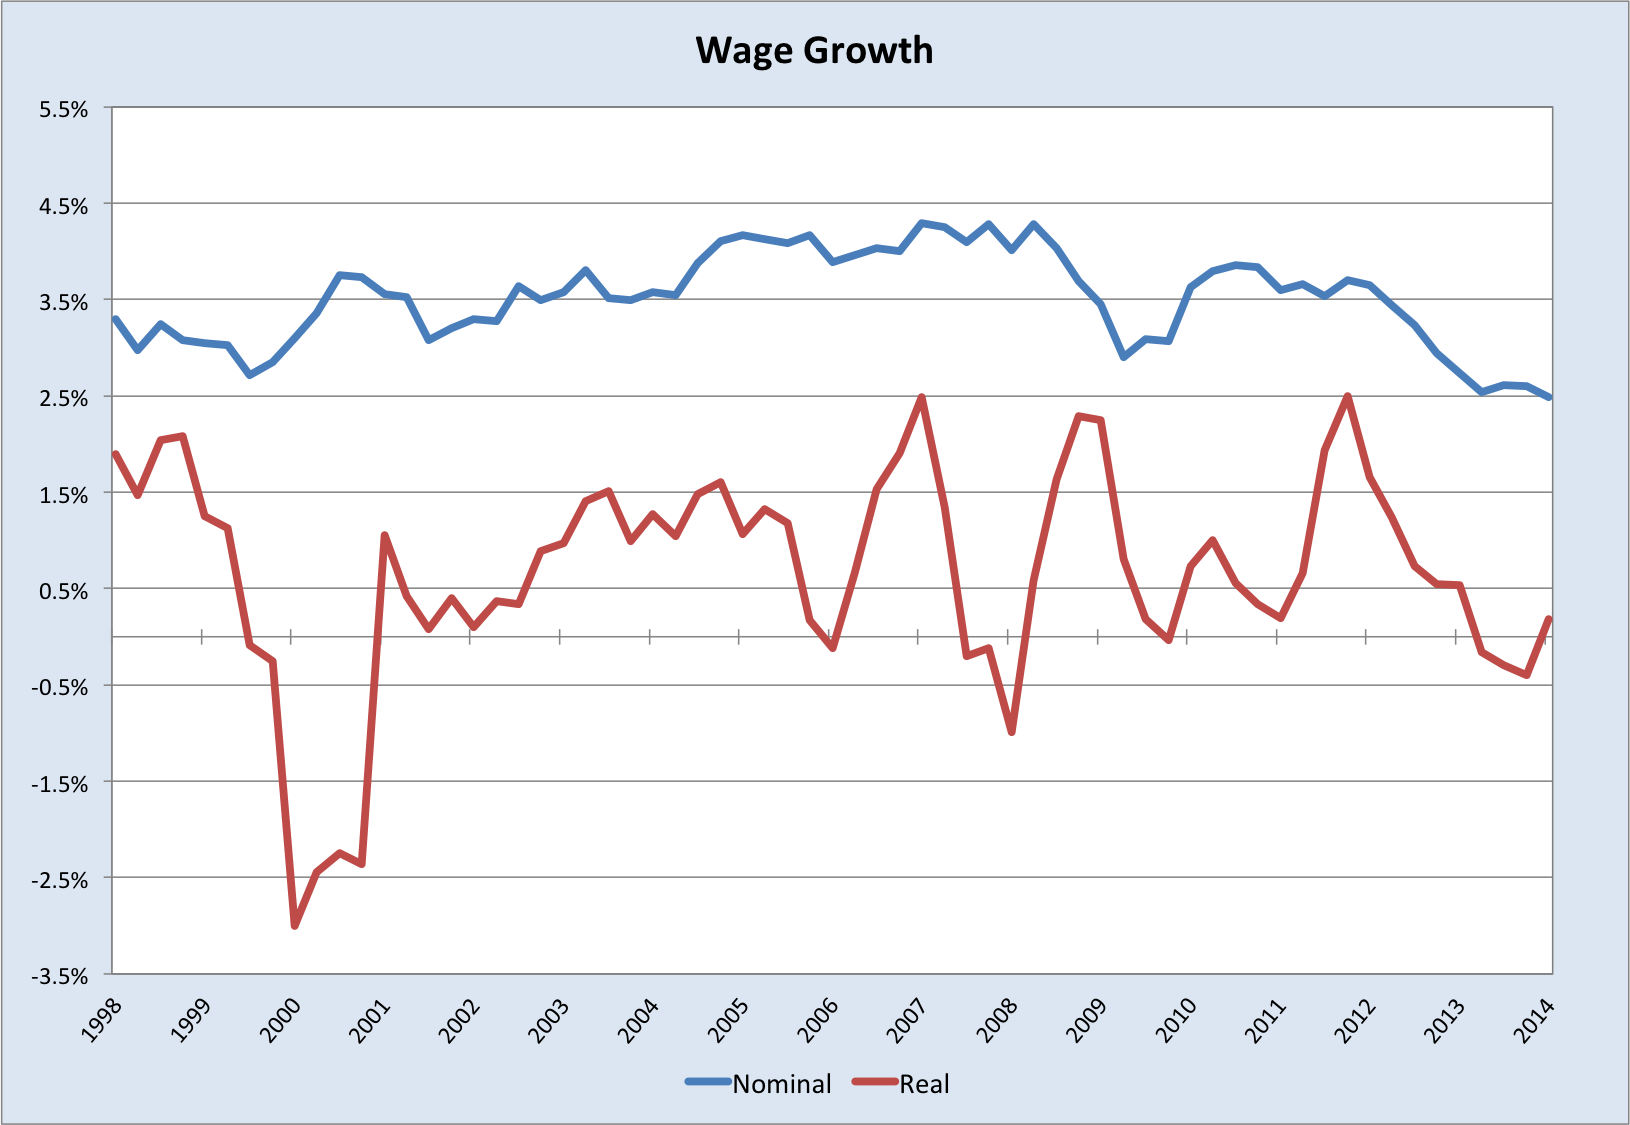
Nominal wage growth is currently the lowest on record, though the ABS only has a wage price index reaching back to late 1990s. However, Australia experienced far higher inflation in the preceding decades, so current levels are likely to be lowest in a very long time. Real wage growth is also low, flirting with negative rates.

In short, there is nothing in the prices of labour or goods and services to warrant monetary tightening.
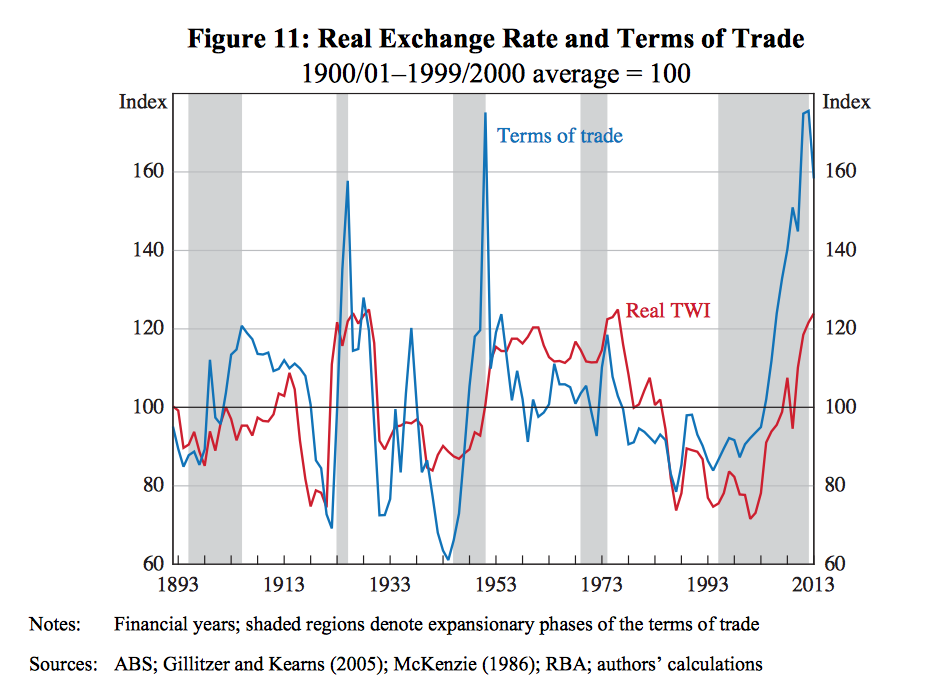
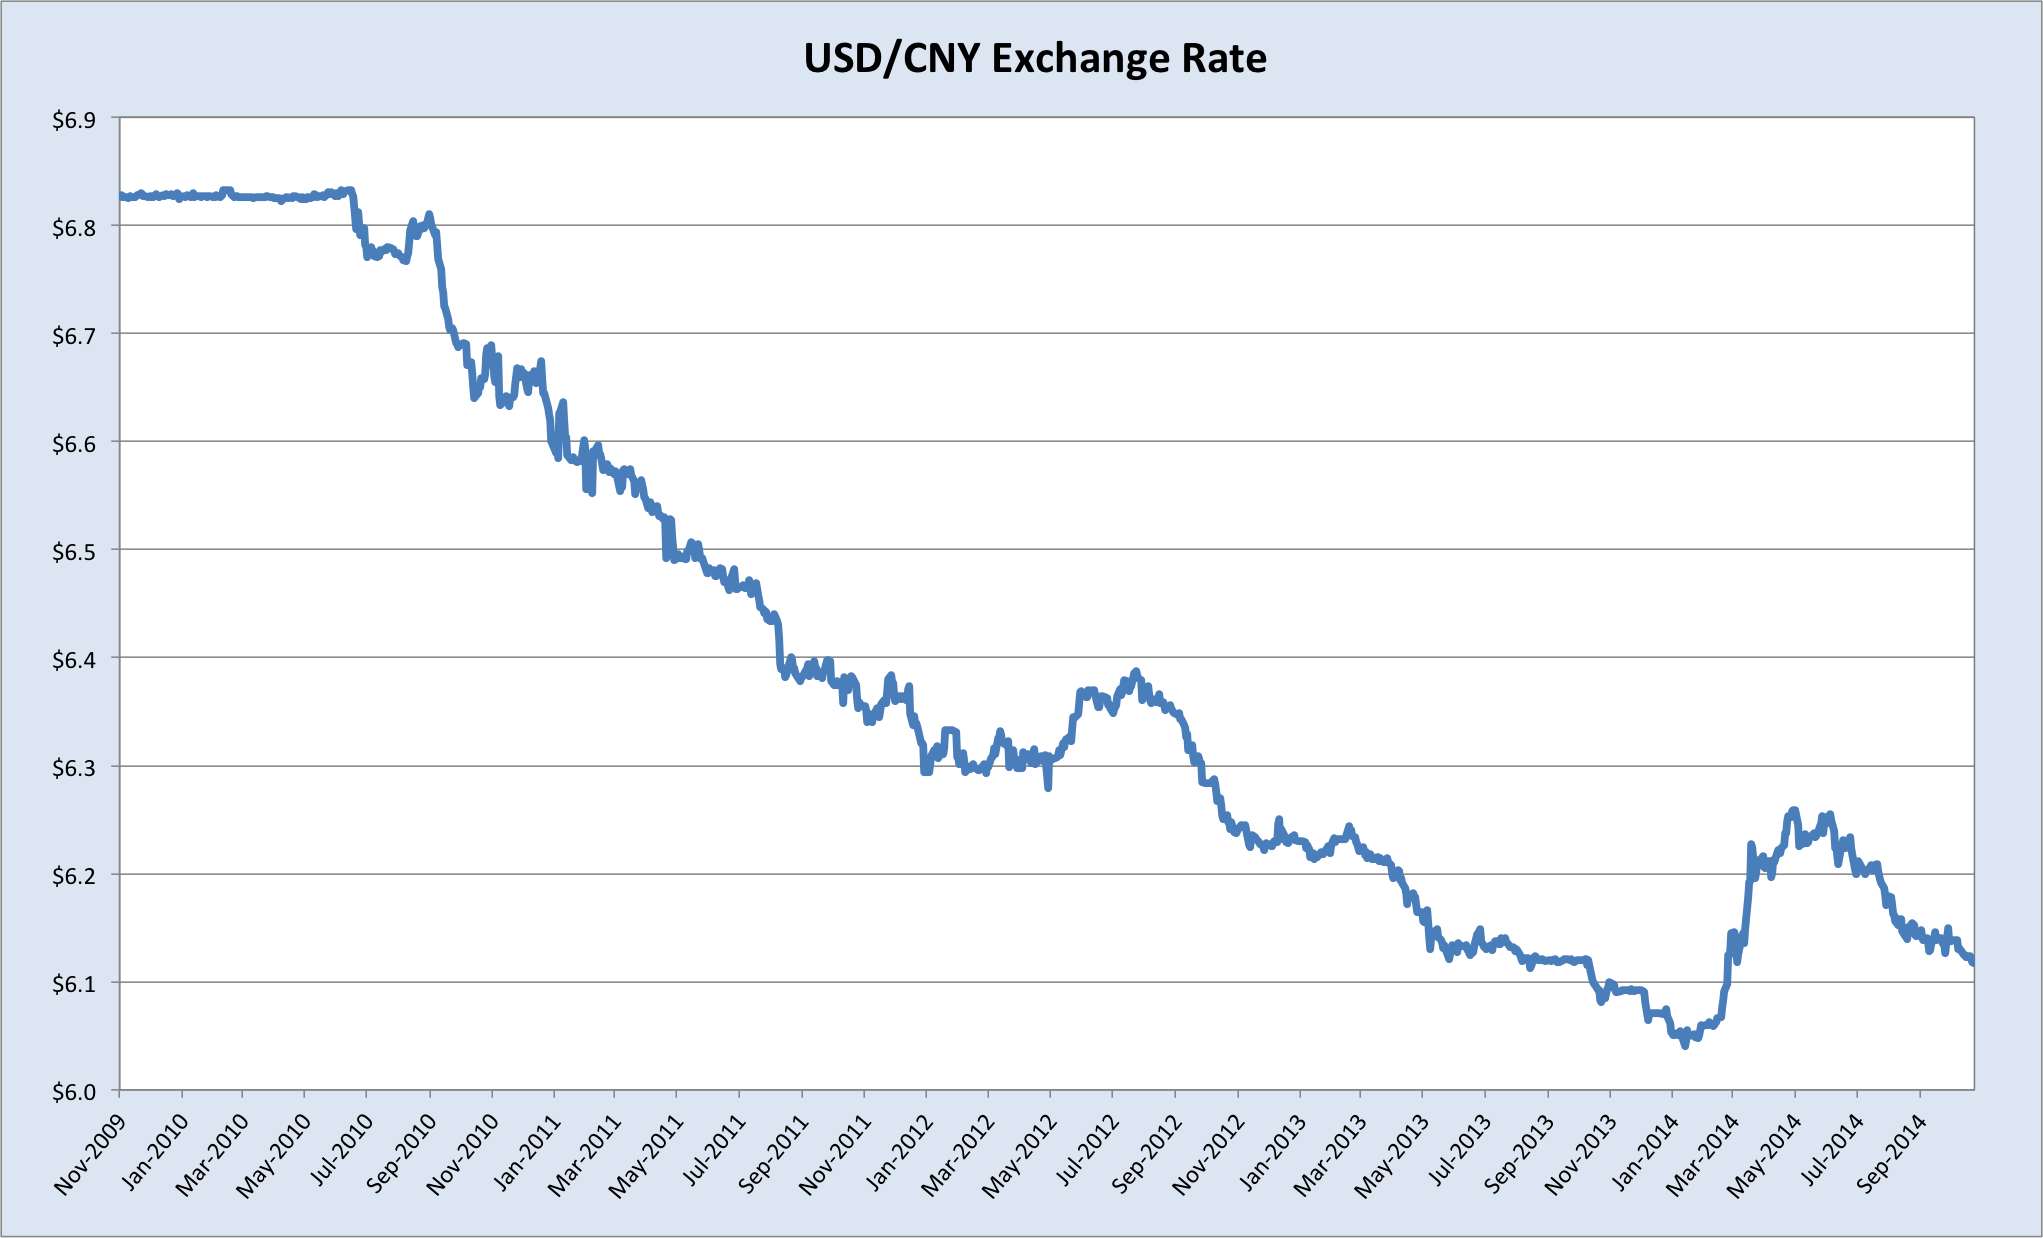
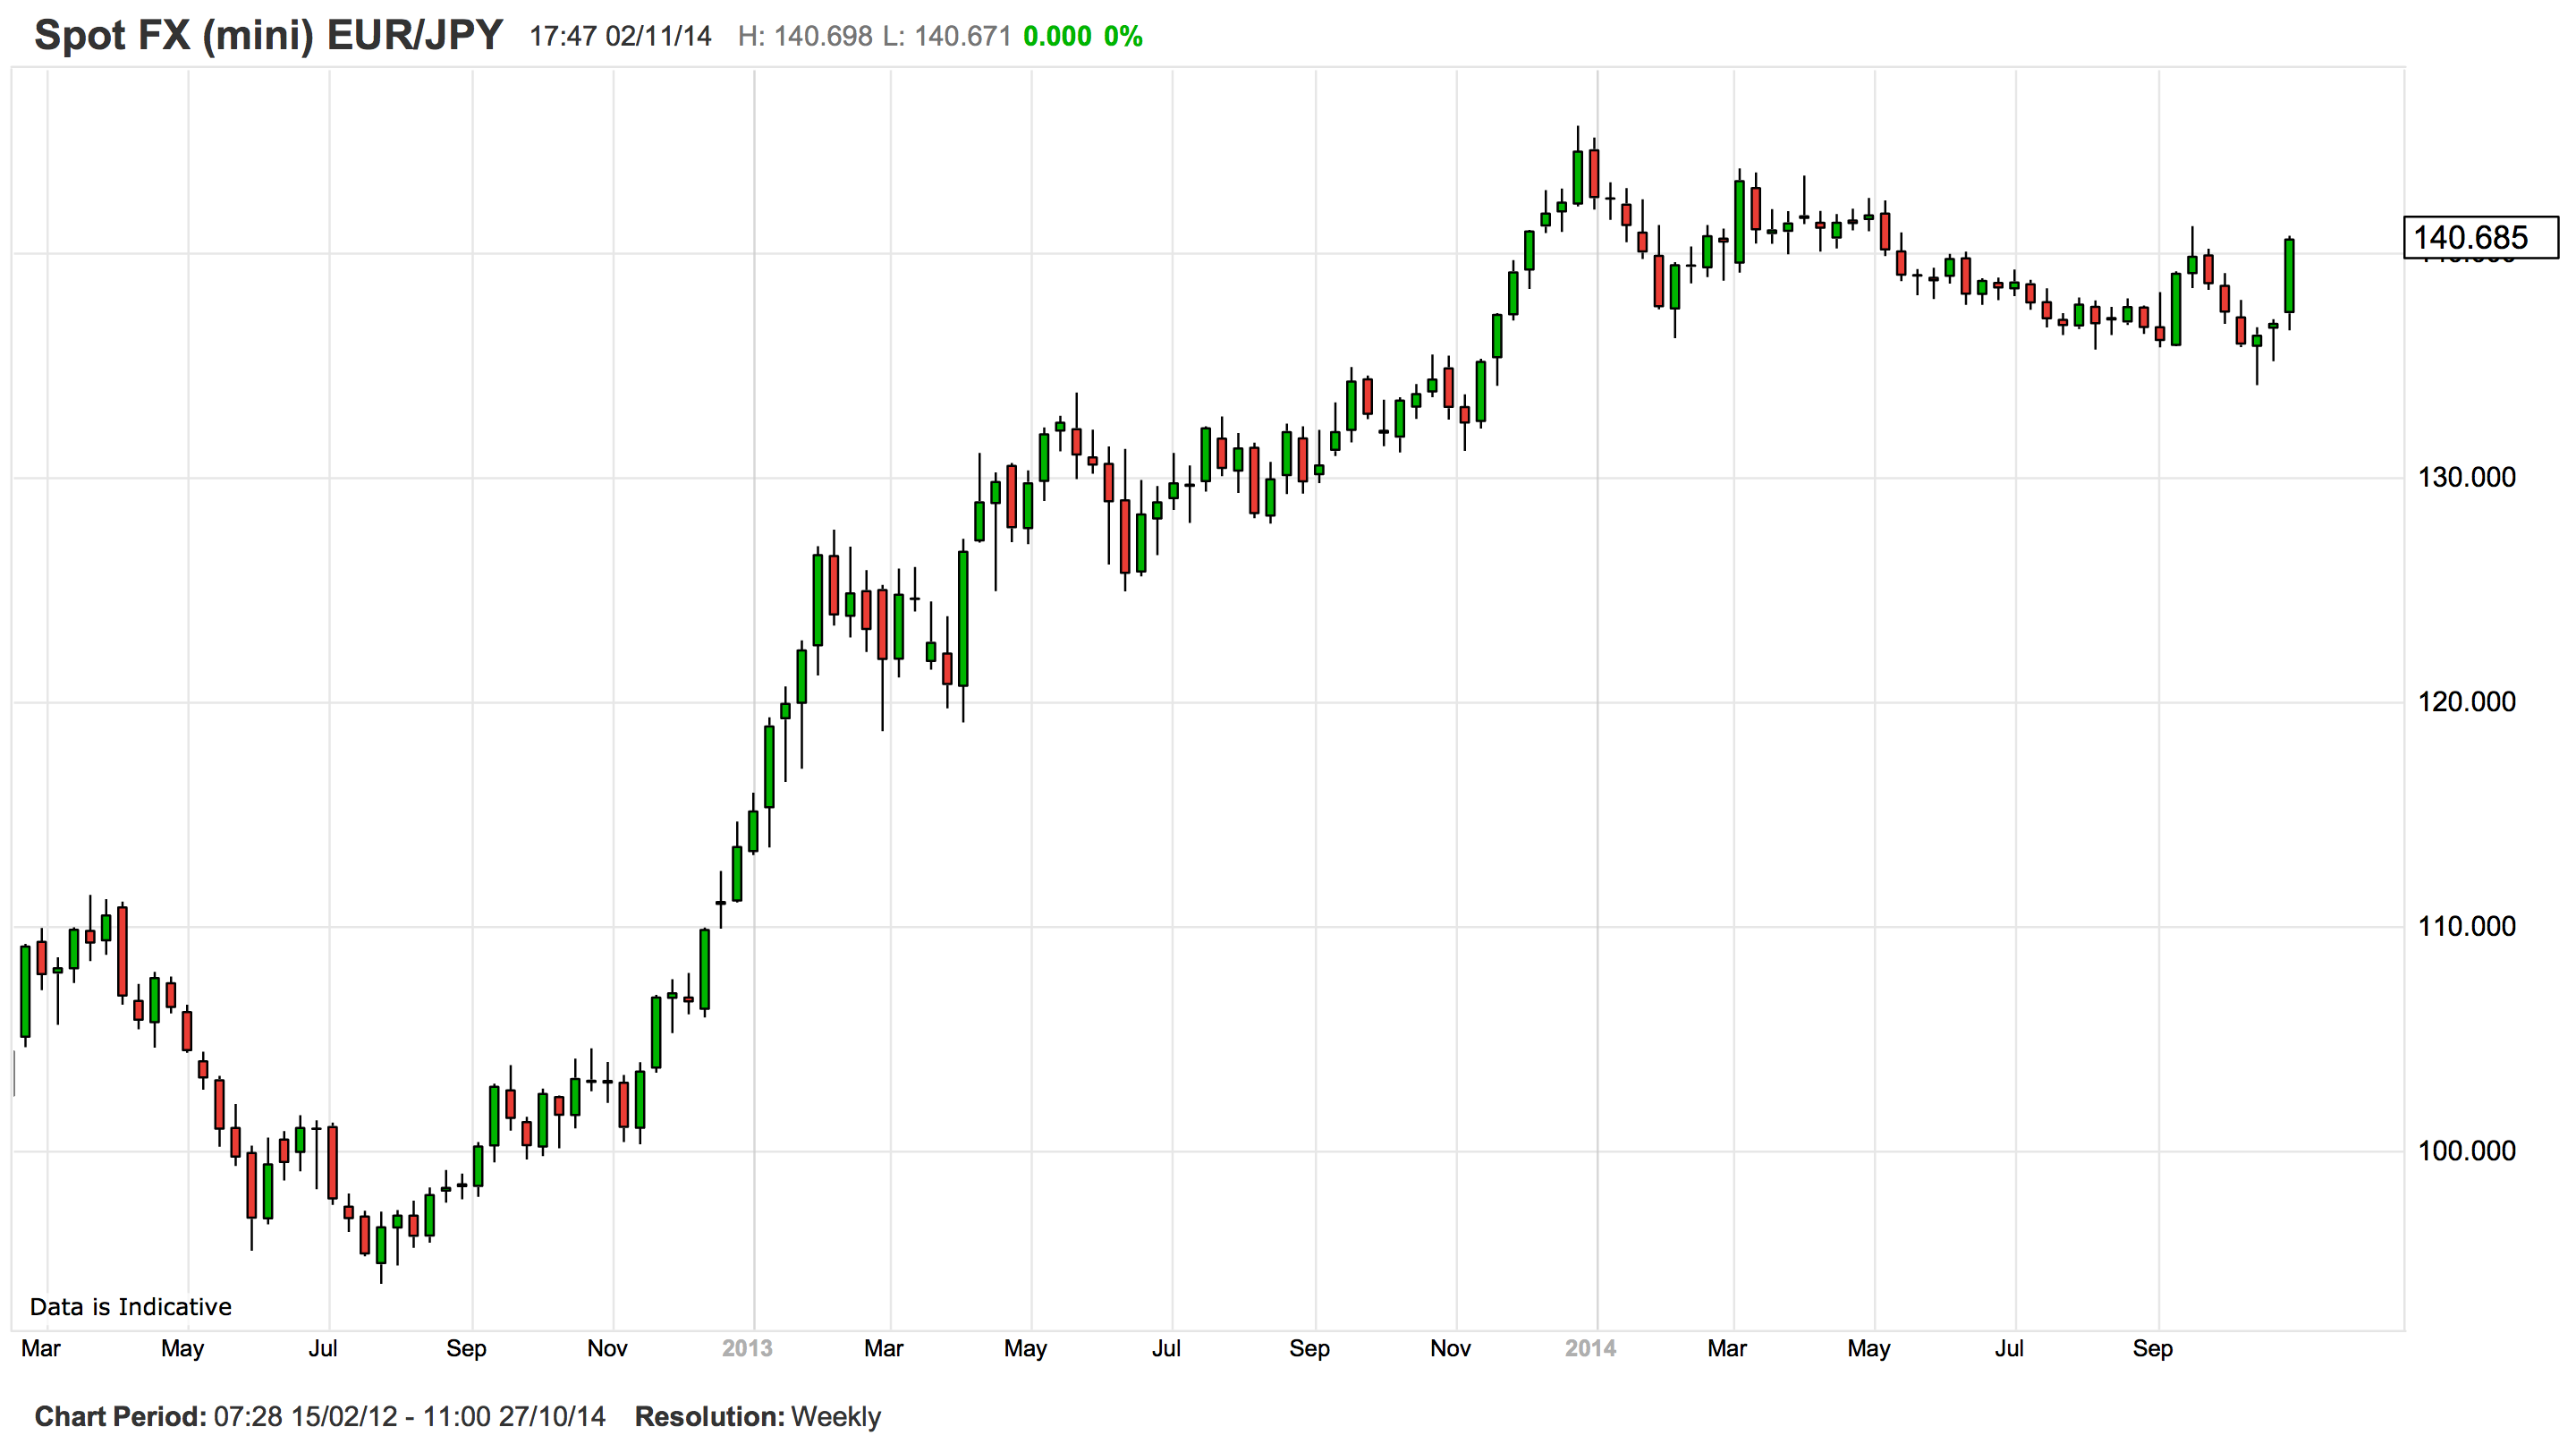
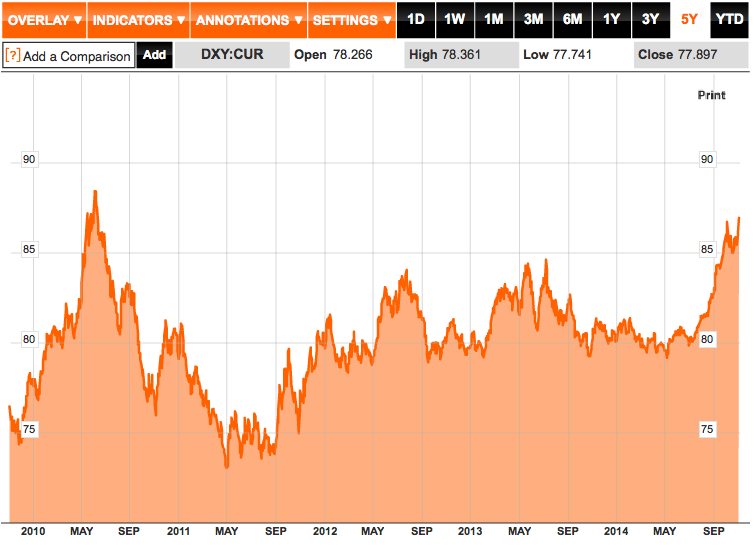
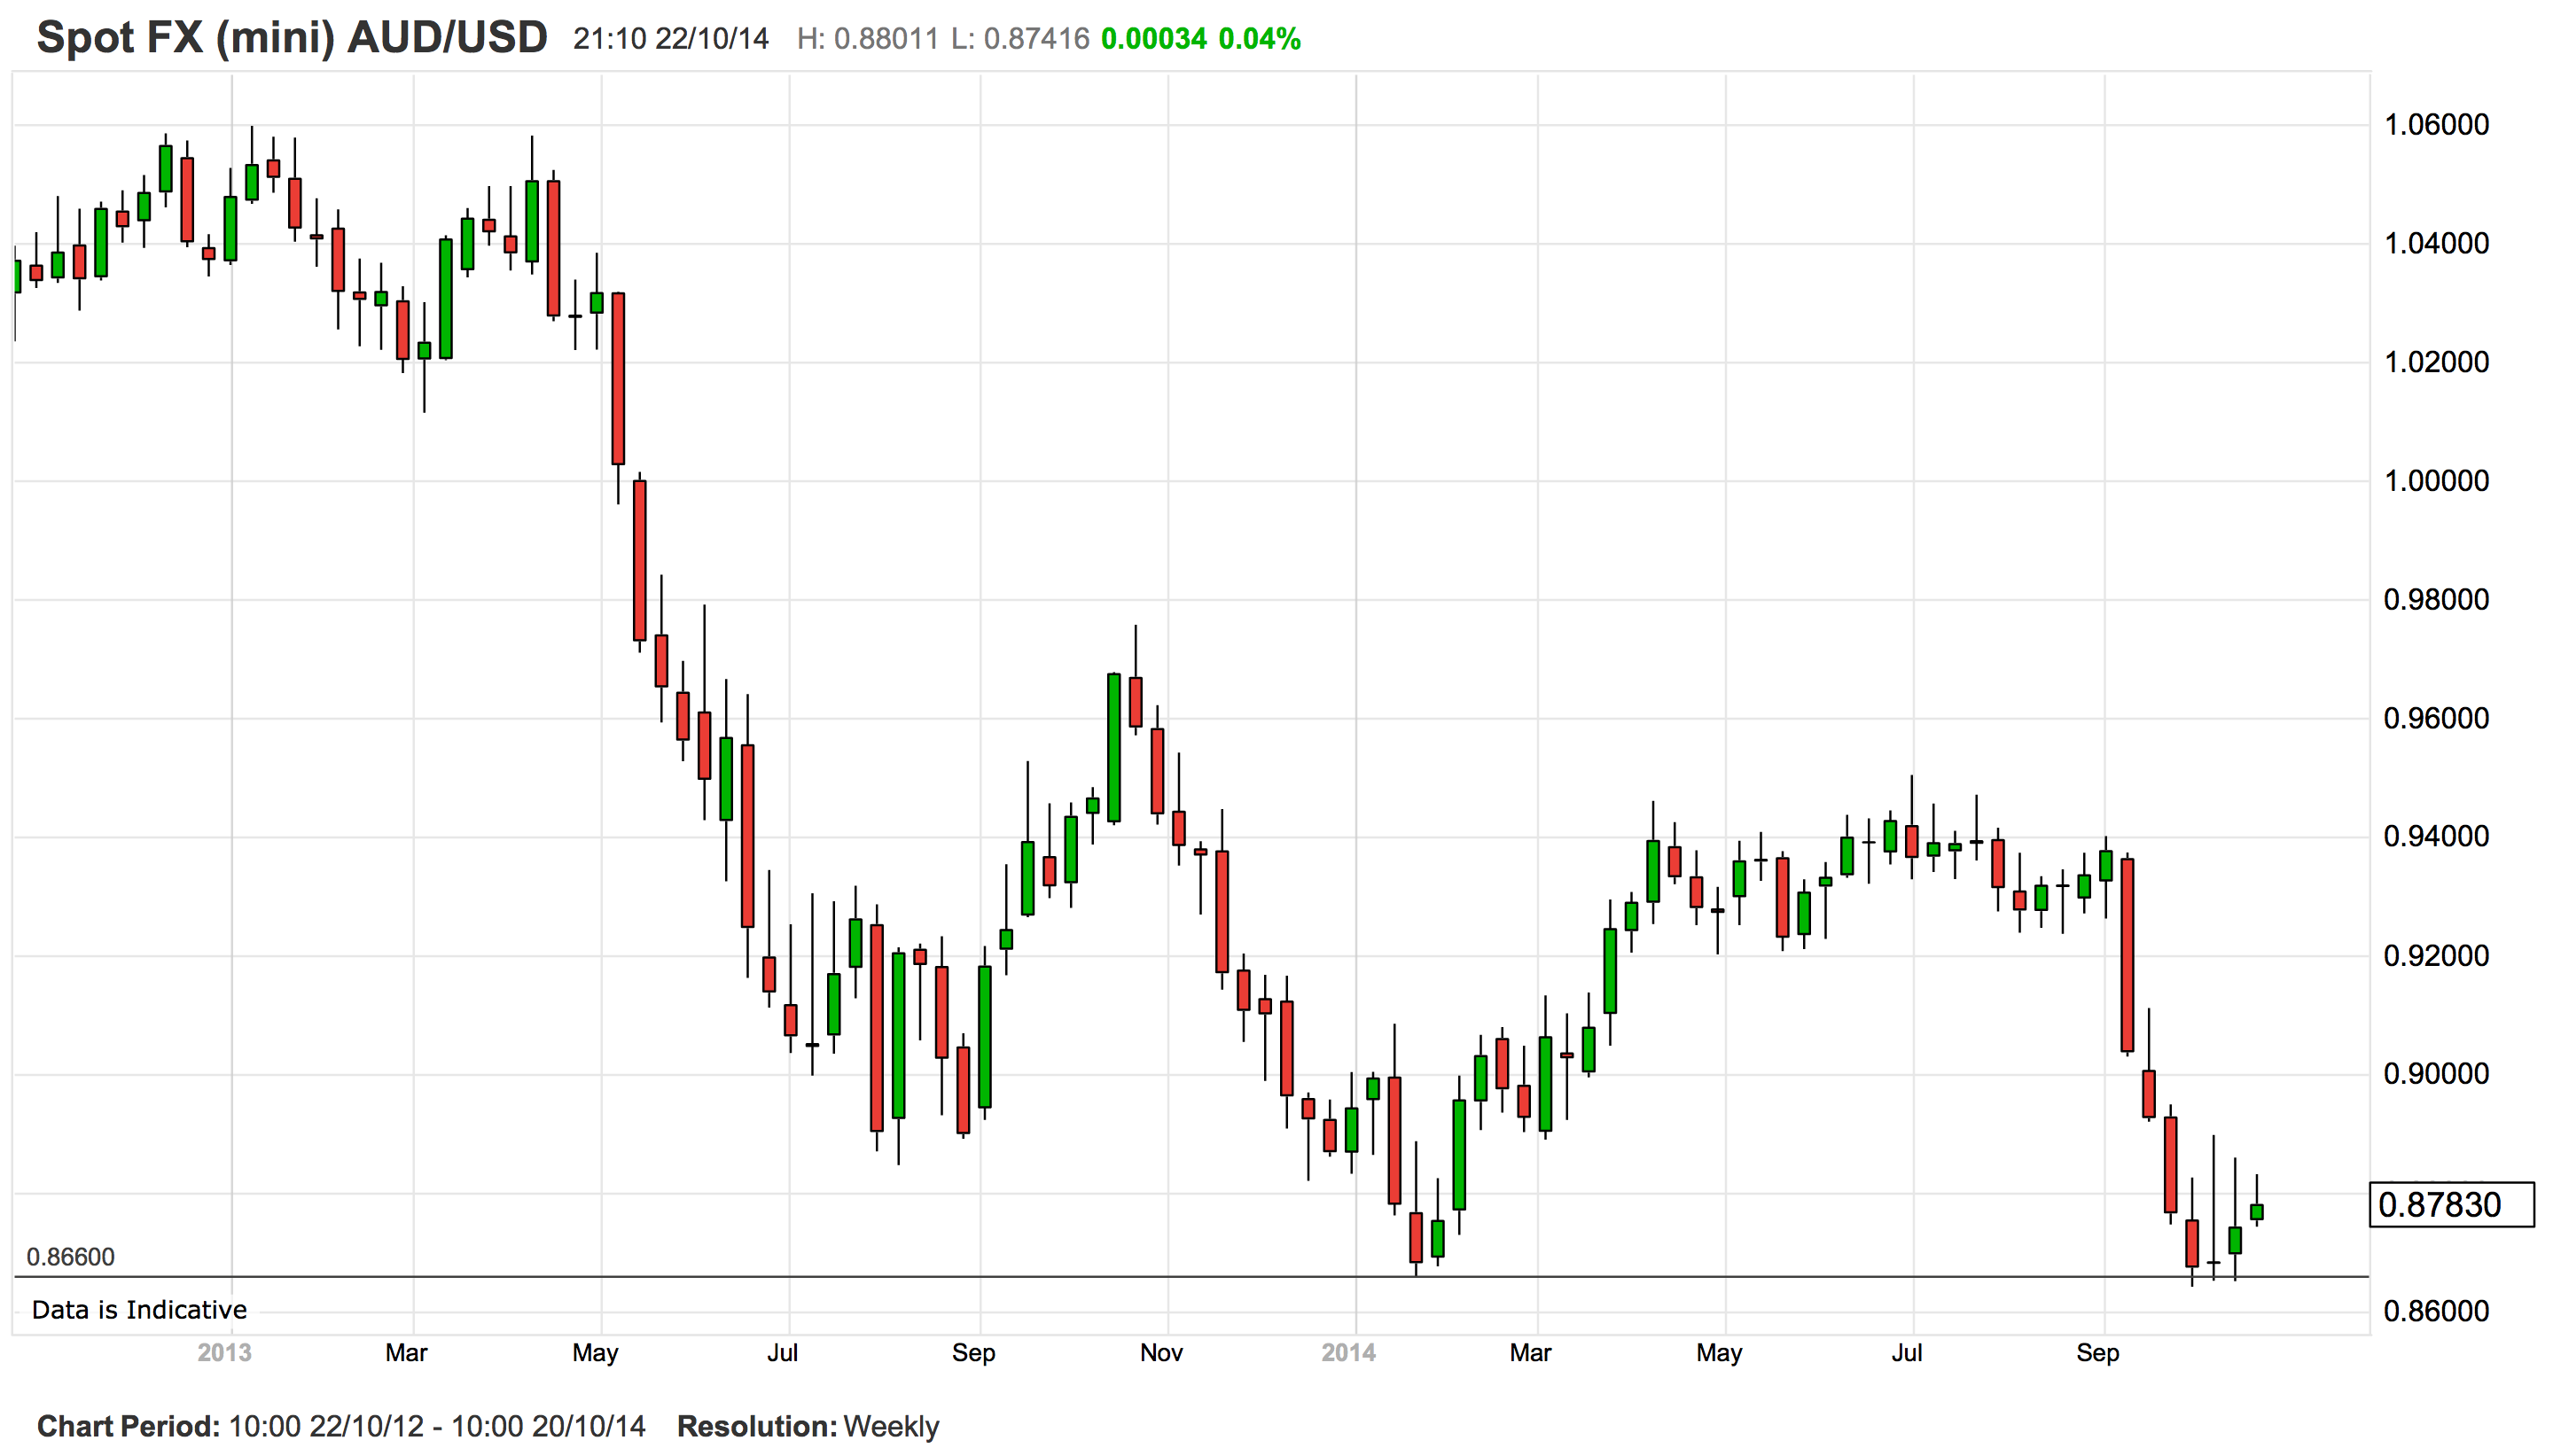
Exchange Rate
As I have written previously, a large and sustained drop in Australia’s real exchange rate is critical to achieving genuine economic rebalancing (as opposed to a short-term cyclical sugar-hit). Therefore, a deep fall in the exchange rate could defer or even eliminate the need to for the RBA to cut rates.
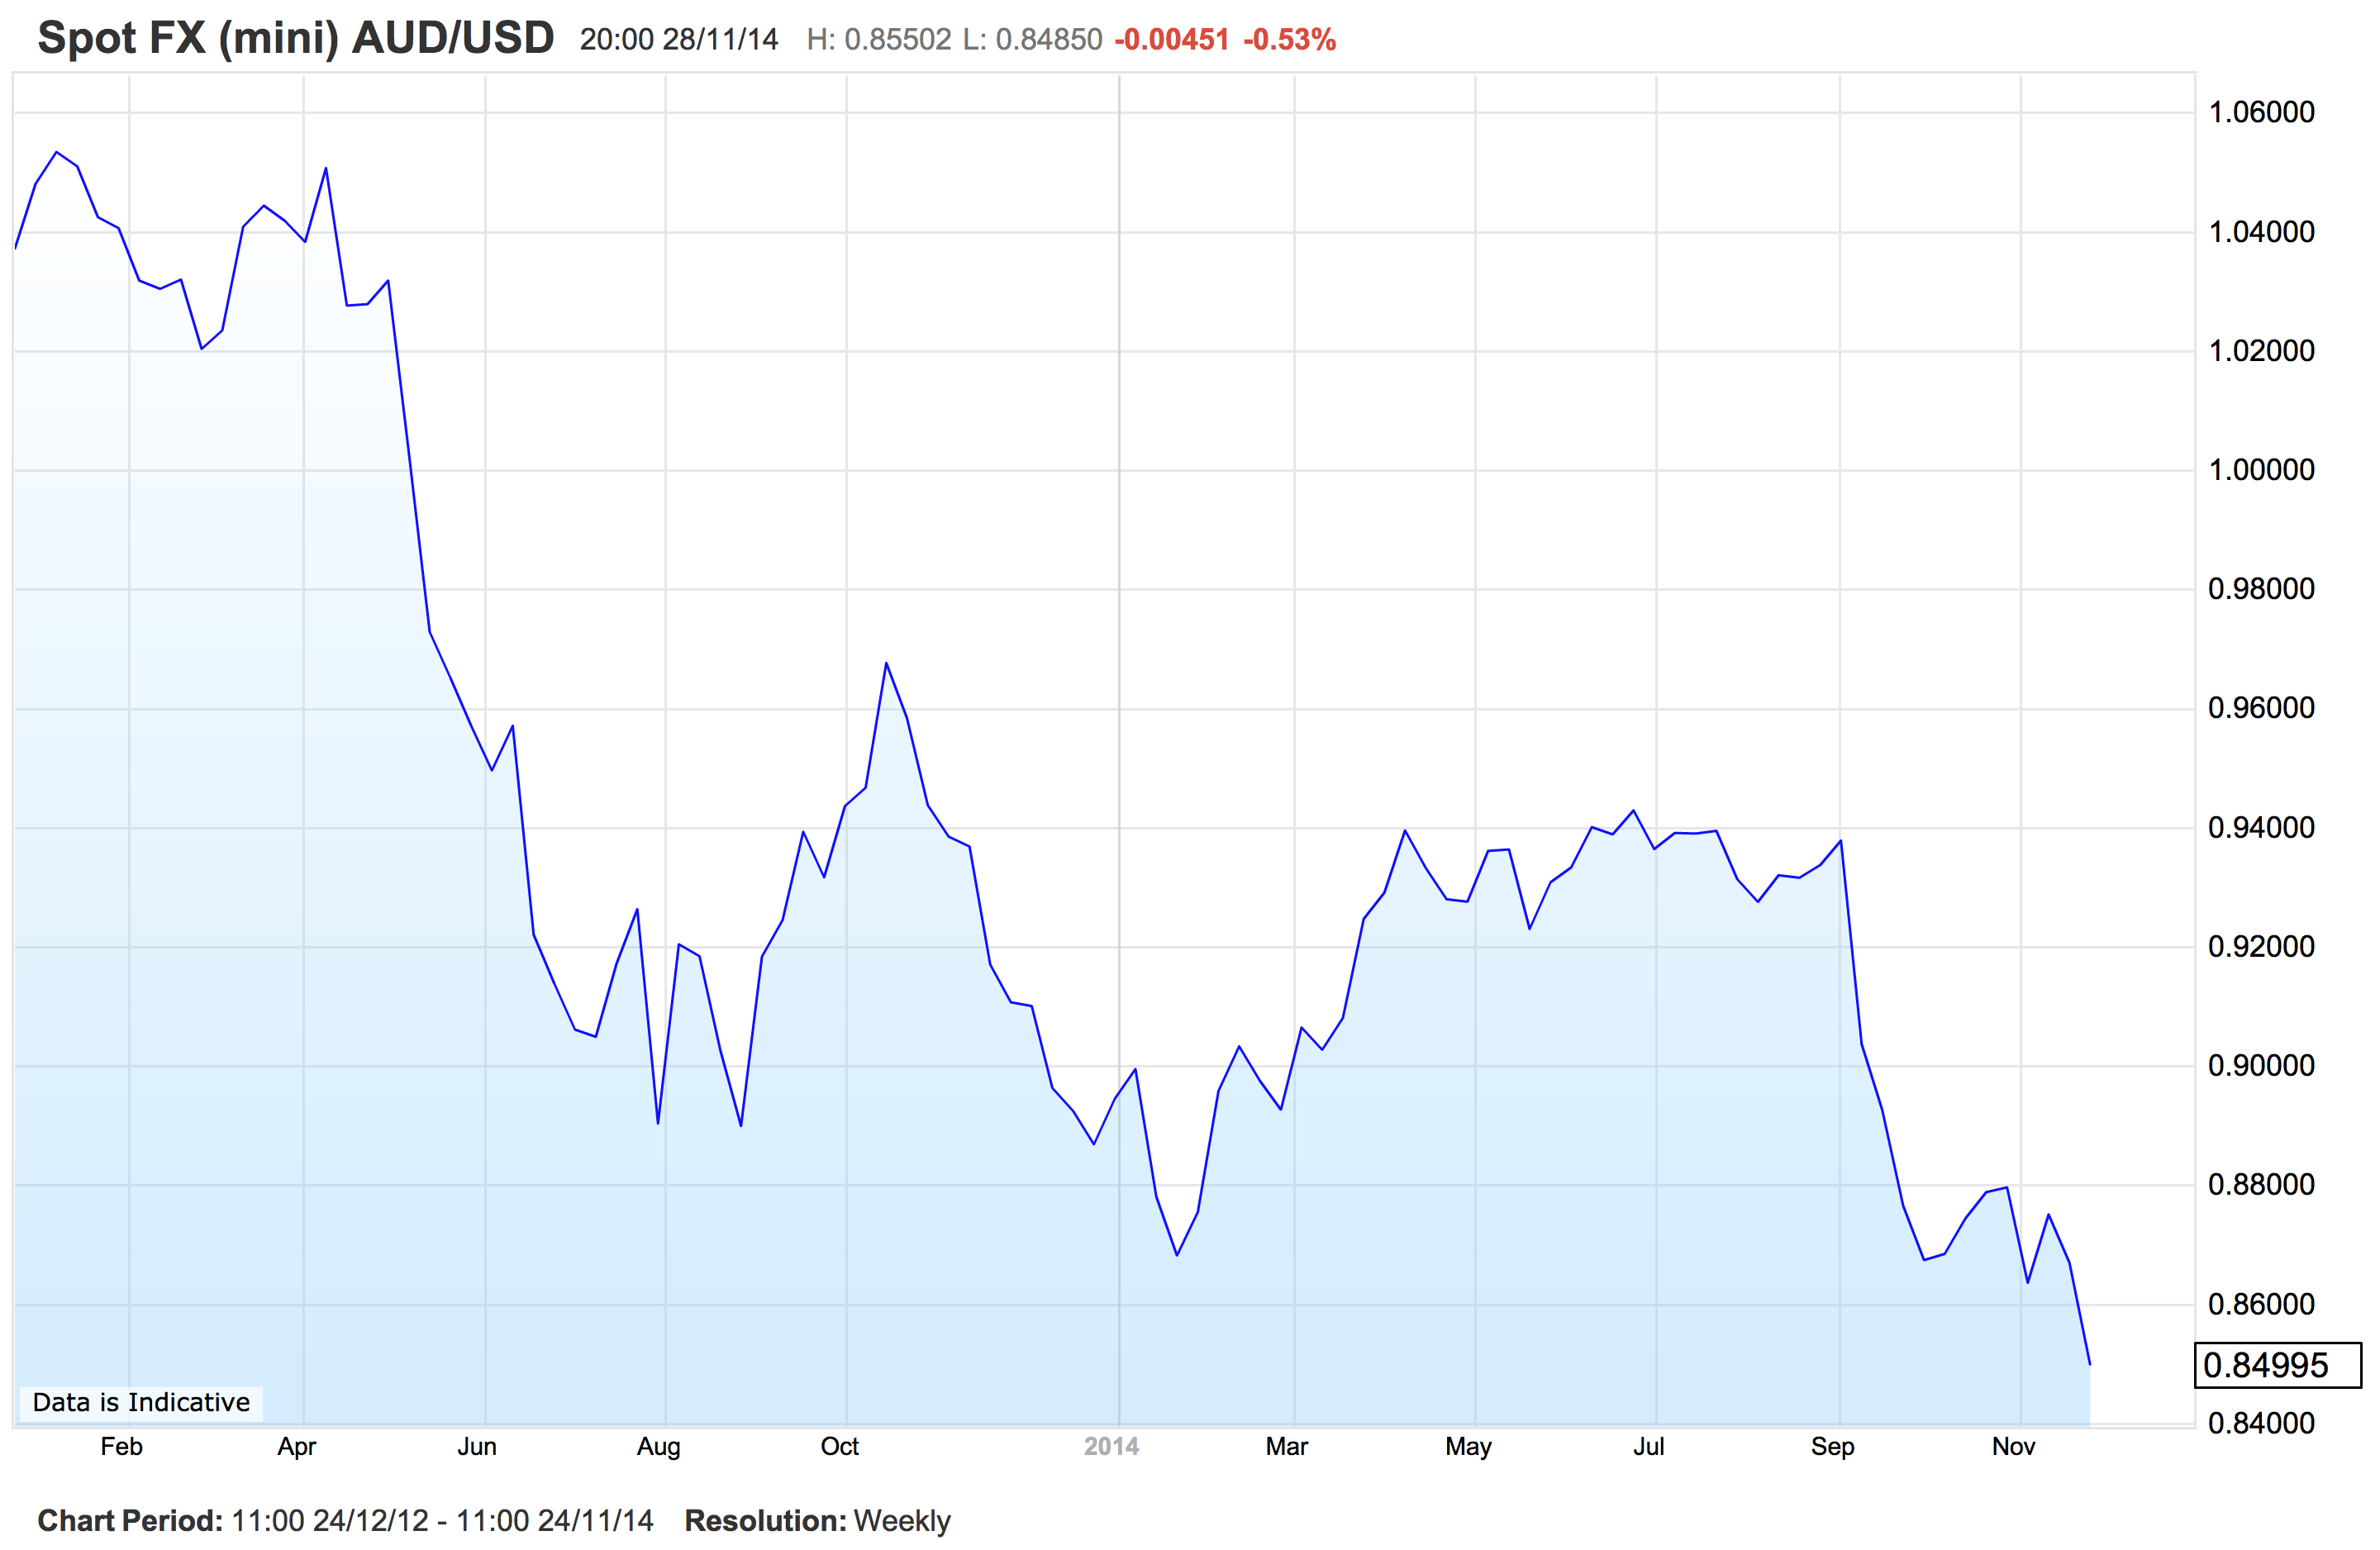
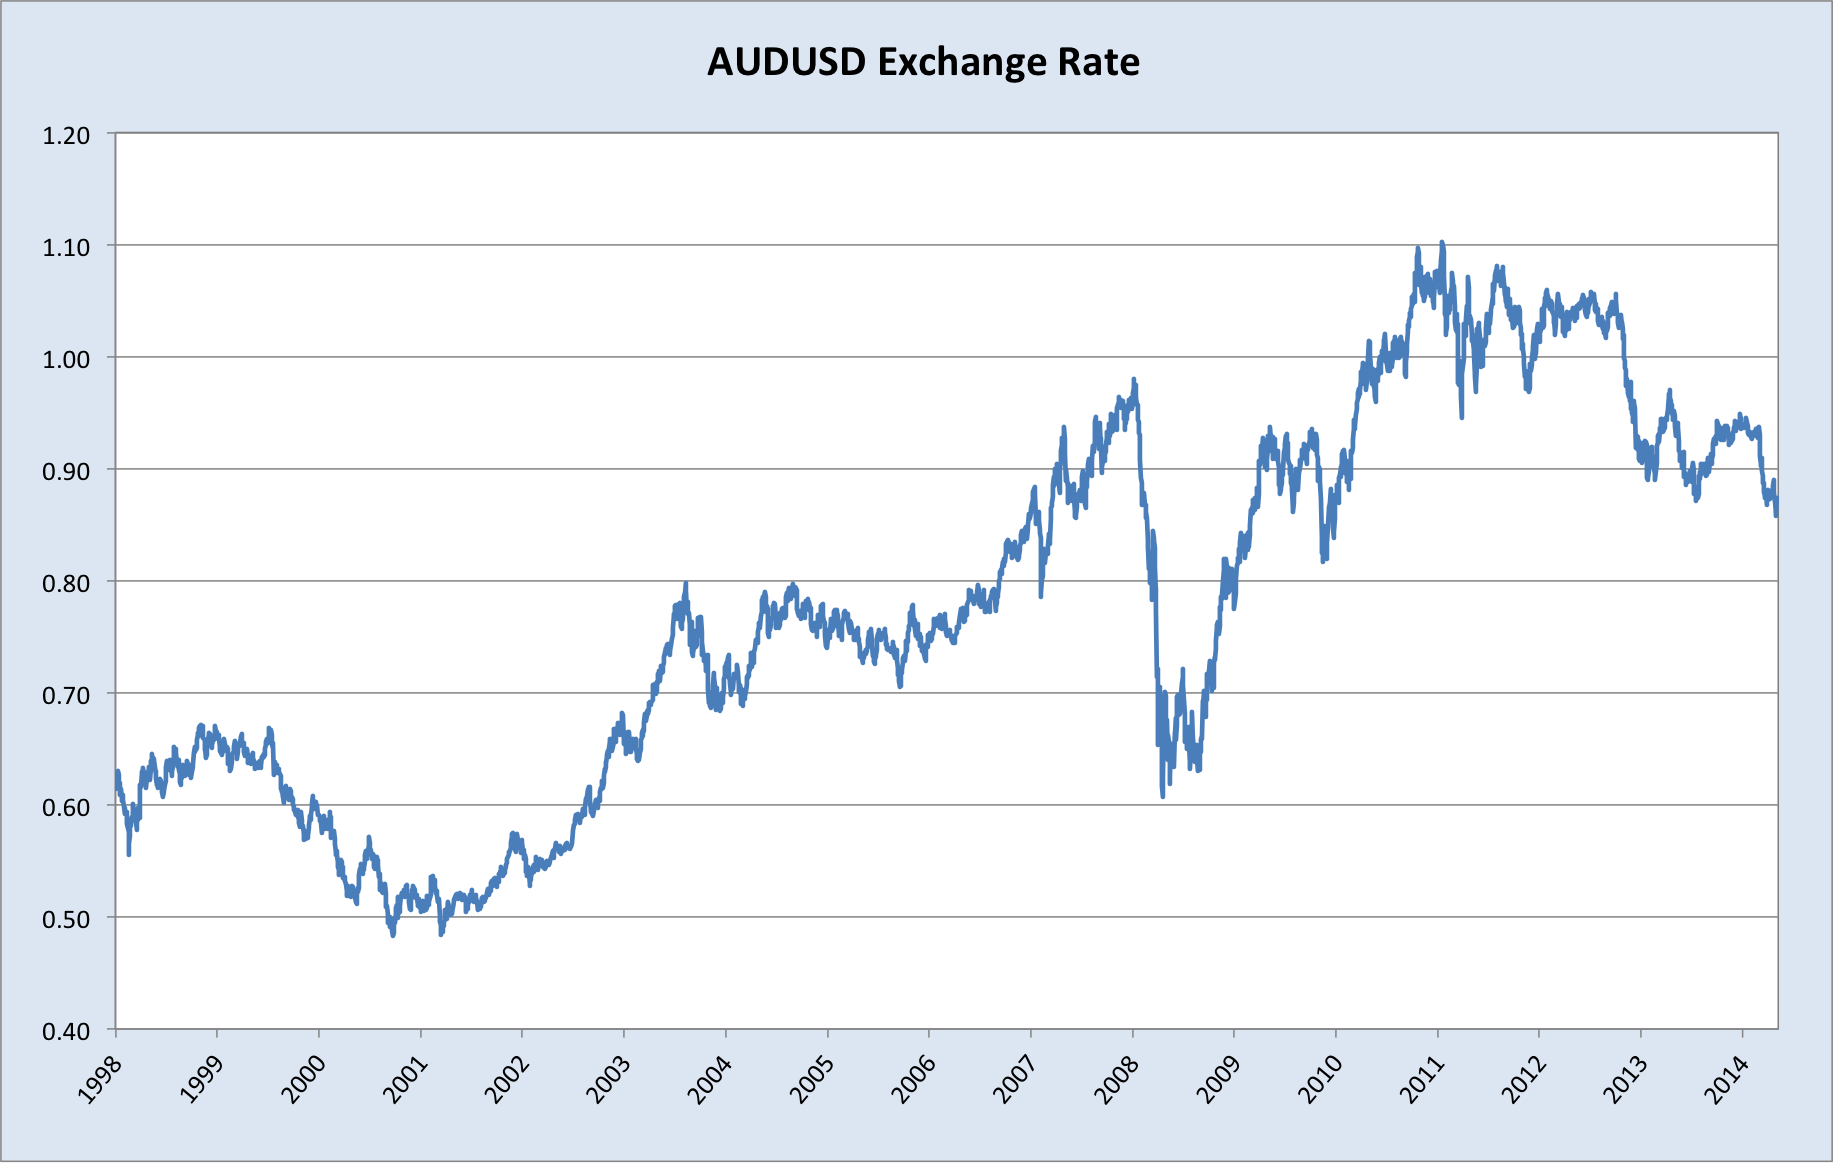
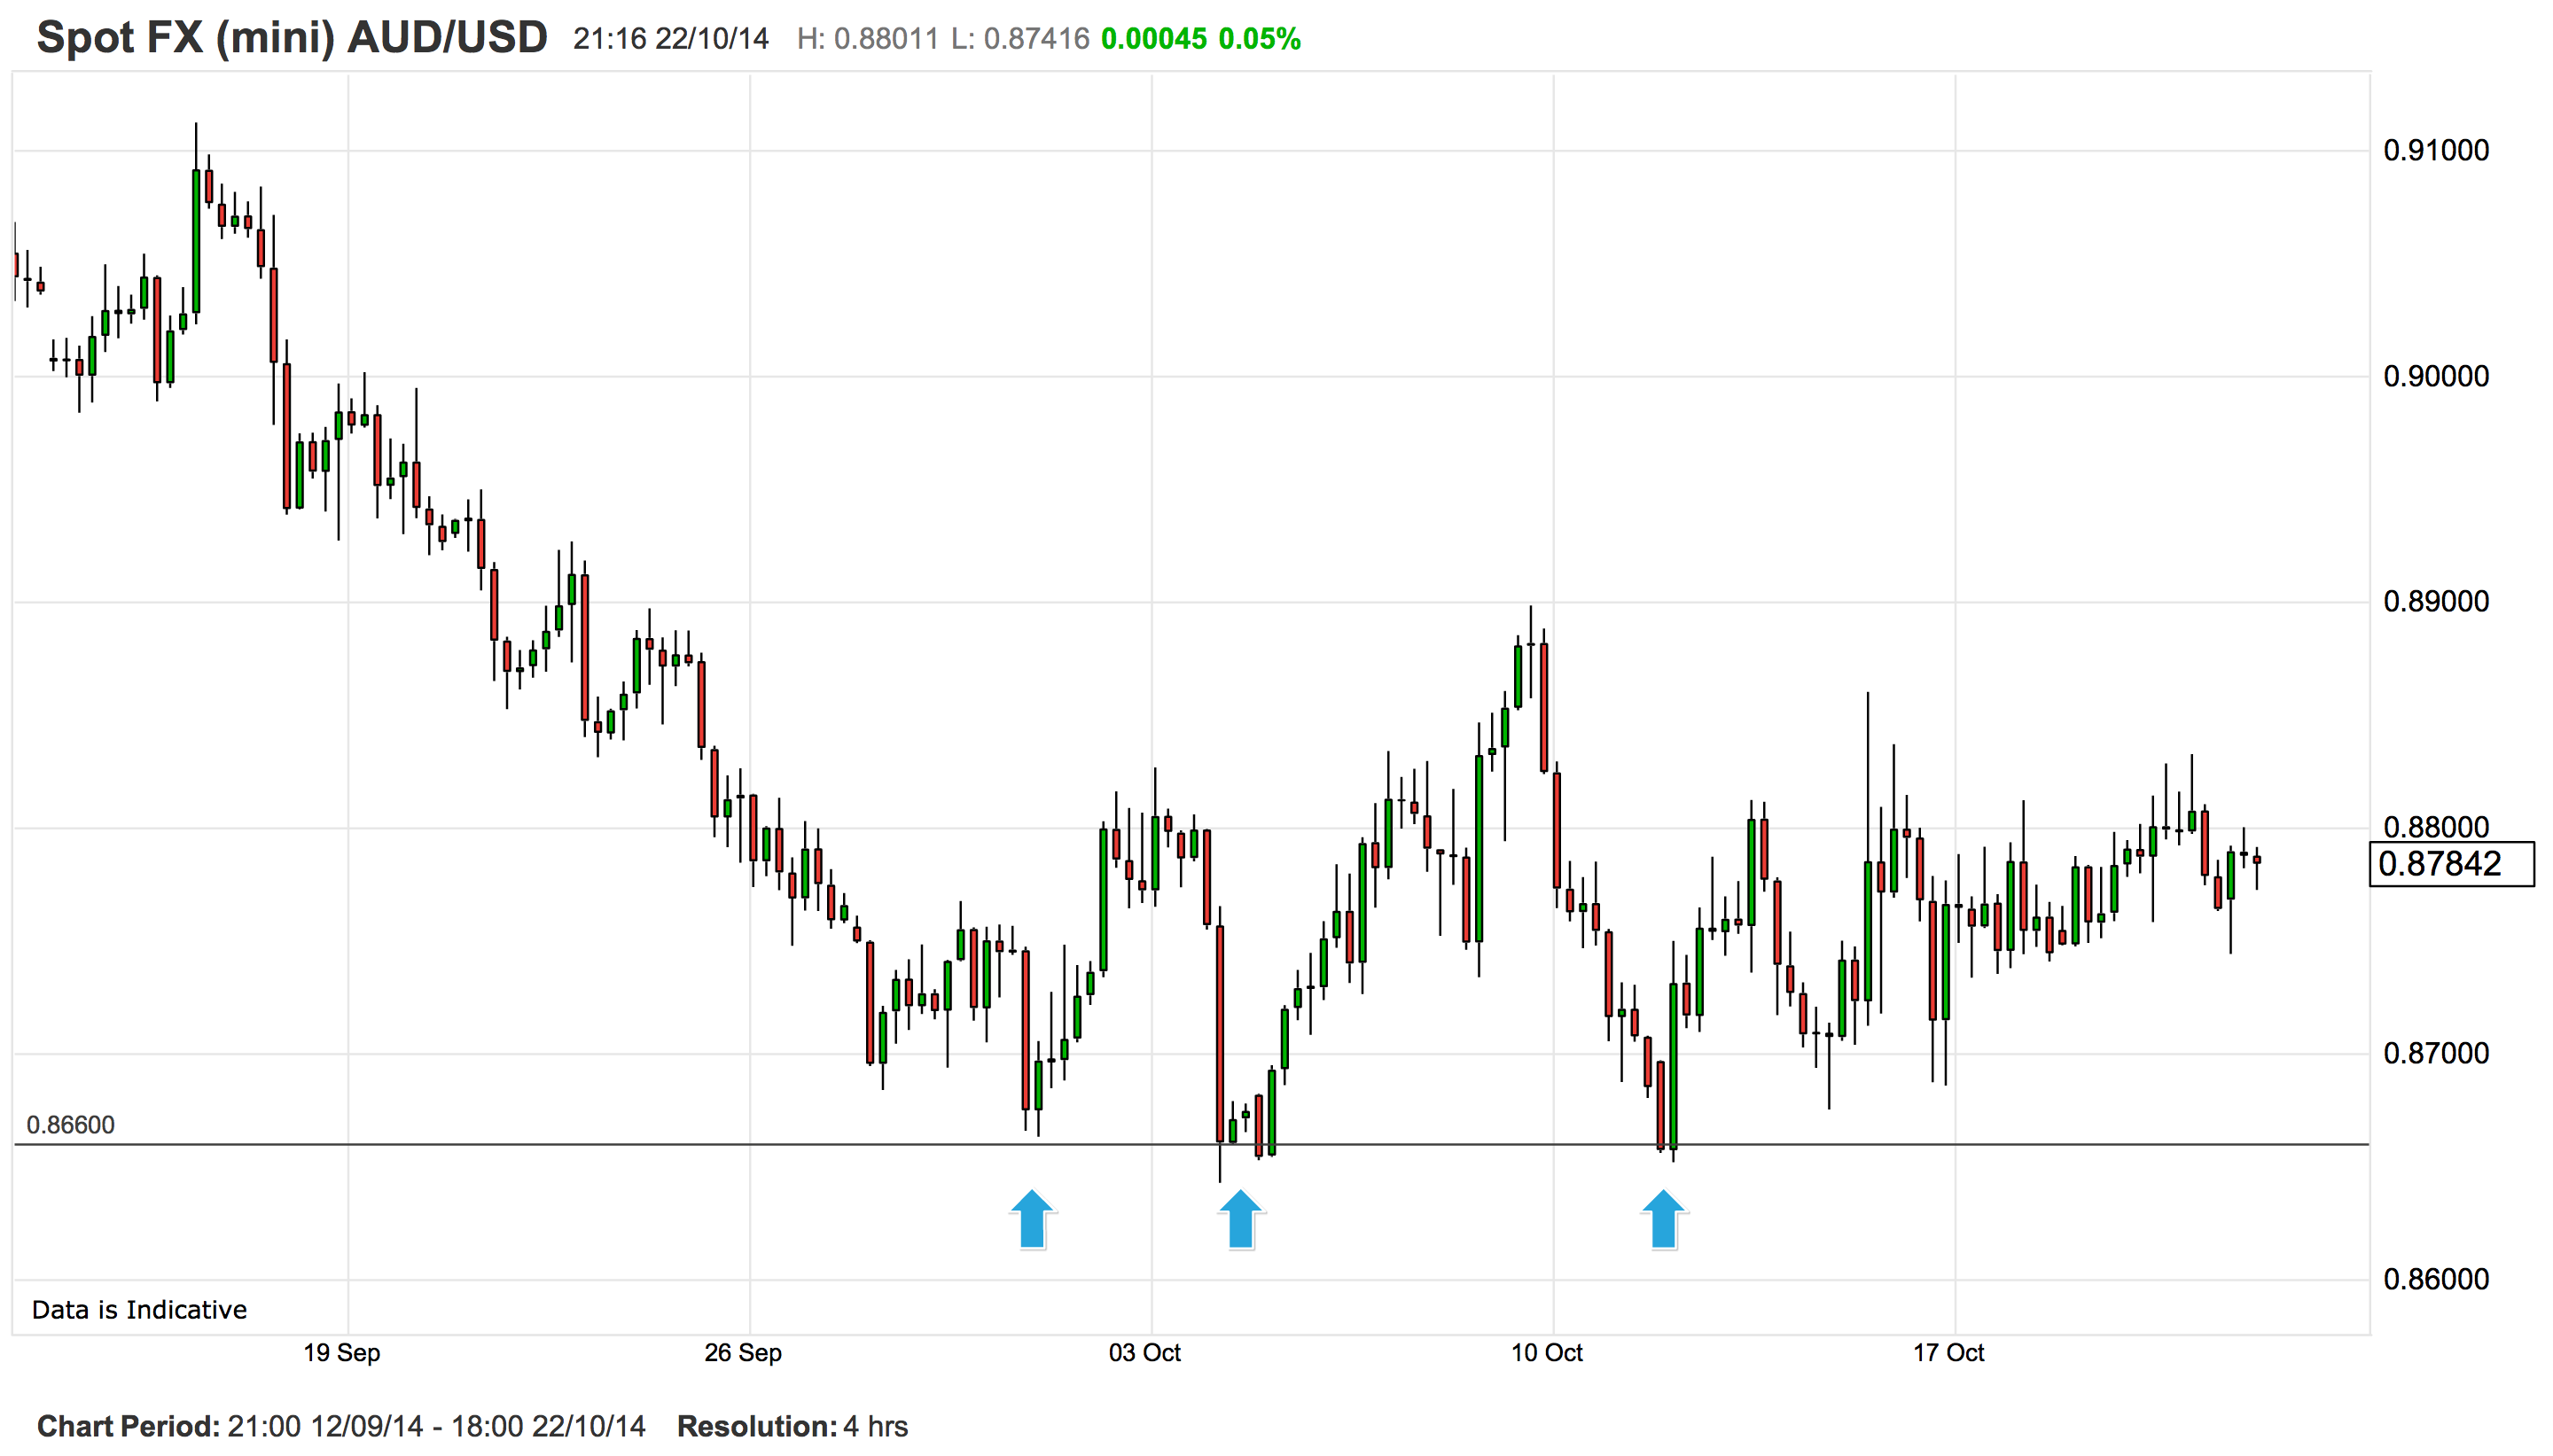
And indeed, there’s been a welcome decline in the Australian dollar in the last few weeks.

These moves have been driven in part by a gradual recognition that rates will need to fall in Australia. What this means is that if the RBA does not eventually cut rates, or fails to signal that they will, the Aussie dollar’s drop will be probably limited. I can see it moving to .8000 now without too much trouble, on a technical basis it is looking quite sickly, but I cannot see it falling hard enough to negate the need for rate cuts.
Conclusion
It remains very difficult to see the RBA hiking rates in light of the ongoing structural headwinds. The cyclical boosters are still supporting activity, but by their very nature these growth drivers require continual monetary easing to be maintained in the current environment. Therefore, if rates do rise, the Australian economy will quickly lose its only propellants, and this will necessitate lower rates again in fairly short order. I continue to expect rates to remain on hold for another 3-6 months before the RBA cuts in Q2 next year.