Category Archives: Uncategorized

Straya At The Moment – Part 1

Australia is the West’s last best model.

Such was the declaration of George Megalogenis in his book, The Australian Moment, published in February 2012.

There’s little question that Australia has had a good run over the past quarter of a century. We graduated from an middling developed economy to be one of the most prosperous nations on Earth; from 1991 through to 2014, Australia’s income per capita rose from 20th in the world to 6th. We boast an educated, multicultural workforce, sound institutional and regulatory frameworks, and a great abundance of vital natural resources. As with all economies, Australia has weaknesses, but surely these were put to the ultimate test in 2008/09 as financial crises ripped through the global economy? And yet still our recession-free run remained unbroken.

The central thesis of The Australian Moment is that Australia distinguished itself from its developed-world peers through a pragmatic commitment to economic rationalism; deregulation and global engagement without financial sector debauchery. For the most part it’s a worthy book. Drawing on the recollections of past prime ministers, and insisting that they focus on the merits of their successors and/or predecessors (a request Keating simply could not abide), Megalogenis presents a sound history of Australia’s post-Menzies reform agenda and the reorientation of Australia’s key economic partnerships away from Europe and North America, and towards Asia.

When he reaches the new millennium, Megalogenis is correct, in my view, that Howard and Costello failed to advance the cause of reform beyond the GST and handed out too great a share of windfall tax revenues, embedding a structural deficit in the federal budget. He also recognises that household debt ballooned excessively, and that our infatuation with property is a wasteful use of capital. Nevertheless, instead of concluding that Australia squandered much of the boom, which seems the logical result from his analysis, Megalogenis reaches the opposite conclusion: Australia is the West’s last best model. 

This honour, this Australian moment, is bestowed by Megalogenis mainly for what he sees as our finest hour: a vigorous and rapid deployment of government stimulus to beat back the menace of global recession in early 2009. This left Australia the stand-out among wealthy nations; a model to be emulated.

The recession we didn’t have to have

The question everyone asks us is: ‘How did you guys do it?’

According to Megalogenis, this was what Australia’s politicians and officials heard in the aftermath of the crisis, as shellshocked policymakers from less nimble nations tried to make sense of the carnage.

In fact, as articulated by Treasury Secretary Ken Henry, the magic formula was not especially esoteric: ‘Go early, go hard and go households’. Rudd went harder. In October 2008, a day short of a month after Lehman Brothers filed for bankruptcy, the first wave of stimulus was announced. It consisted of a $10 billion ‘cash splash’ to get folks spending through Christmas, a doubling of the first homeowners grant for existing homes, and a trebling for new homes. This was followed by a second round of cash payments in February 2009 and a $28 billion commitment to public investment, with the largest initiative being the school buildings program. In addition to fiscal stimulus, Australia’s monetary authorities responded decisively. Between March 2008 and April 2009, the RBA slashed the cash rate from 7.25% to 3%. Partly because of this, the Australian dollar went into freefall, losing close 40% of its value against the US dollar between June and October 2008.

Australia dodged a technical recession in 2009, and recorded much stronger growth and lower unemployment in subsequent years than most developed economies.

DevEcUE

Despite this performance, the economic sense of the Rudd/Swan stimulus packages has been the subject of intense (and intensely politicised) debate. This isn’t my primary interest here. The question I’m addressing is: Was the stimulus of such importance to Australia’s economic performance that it set the ‘Australian model’ apart internationally? Was Australia’s success mainly due to something Australia did that other nations didn’t do? Or was it something the global economy did to Australia which is didn’t do to others?

Crash or splash 

With regards to household behaviour, the stimulus basically achieved its ends. In 2009, when consumer spending was sliding across much of the globe, Australian retail sales registered a comparatively healthy bounce. The cash was splashed.

AusRetailSalesNational

The boost to the first homeowners grant also produced the desired effect. Australia has expensive houses and highly leveraged households, making us vulnerable to housing shocks. For a few fretful months it appeared that local house prices might follow America’s into the dirt. Thankfully it was not to be.

Aus_US_HousePrices

Along with the first homeowners grant, the massive reduction in interest rates obviously added substantial support to house prices in 2009. Which was greater in overall effect I cannot say, but the fact that we avoided material falls in house prices, and instead notched up solid gains, further buttressed consumer confidence and spending, particularly in NSW. Therefore, I do think it’s fair to say that the stimulus shielded the economy in the immediate aftermath of the 2008 crash, particularly in light of the decline in the terms of trade, which continued through to September 2009. (The terms of trade is a ratio of export prices to import prices; how many Hondas we receive for a shipload of coal, basically.)

AusToT

That the terms of trade was a drag on national income during 2009 leads many commentators, Megalogenis among them, to reject the argument that the external sector was Australia’s true saviour after the crash. From his book:

One of the myths that has developed since, and which is reinforced by public opinion polls, is that China saved us. But China had a bigger slowdown that the United States in the first half of 2009. Australia’s terms of trade fell for four quarters in a row from the December quarter 2008 to the September quarter 2009. The quarry was’t as important as people thought.

Not for a few months in 2009, perhaps. But what would have happened if the terms of trade continued to nosedive? What would have happened if the resource sector slashed capital expenditure? It may have subtracted from growth in 2009, but the resource sector very quickly reapplied the throttle. And of course, this turnaround owed little to the recession-fighting prowess of Australia’s policymakers.

Examining our key export commodities in further detail, we get a deeper impression of their contribution.

AusMerchExportValue

Clearly iron ore became the stand-out performer from 2009 onwards, far exceeding its pre-crisis contribution to the economy. China’s response to contracting global trade didn’t just consist of a sizeable central government stimulus package; more importantly the government (by way of the central bank) flooded the economy with credit to fund a gargantuan infrastructure and property boom. This was big enough to cover the decline in foreign demand for Chinese exports, and then some. To pull this off, China sucked in raw materials voraciously. Thus the spot price of iron ore exploded, sending our terms of trade and export earnings up with it. (Note: the following chart doesn’t capture the large jump in spot prices shortly before to the 2008 crash, which contributed to the spike in iron ore earnings in 2008. Spot prices are only depicted from 2009 on.)

LTIOprice

Even more significant than the swift rebound in export earnings, I would argue, was the arrival of an investment boom in the resource sector. As late as 2007, Santos, Oil Search and ExxonMobil were intending to pipe gas from PNG into the Australian market. As coal seam gas emerged as a substantial source of domestic supply, this plan was abandoned and reworked into an LNG project (which was switched on a few months ago). This decision, and of course the promise of robust Asian demand, triggered something of an LNG arms race. As far as I know, at its peak there were 13 projects planned across Australia (some of which have since been shelved), valued at around $220bn. A flurry of capital spending began to take effect in 2010, shortly after the terms of trade turned higher. In addition, substantial investment took place in iron ore capacity expansions.

Screen Shot 2014-11-17 at 10.54.36 am

The timing of the investment boom was impeccable, greatly adding to private business investment at a time when it was all but dead across the developed world. Business investment is typically the most volatile aggregate spending component, and usually exacerbates business cycle fluctuations, so bucking this trend was critical to Australia’s post-crisis performance.

Capex

Had neither of these fortuitous developments occurred, there’s little that Australian policymakers could have done to ward off a much more painful downturn. Although domestic demand was successfully supported during 2009, Australia could not have leveraged its public balance sheet to fund private consumption indefinitely, nor could we have got by on higher house prices for all that long if our export earnings were tanking and our labour markets suffering. (We’re testing the practical limits of this strategy right now, actually!)

We must also consider that the Australian economy’s fundamentals were relatively healthy when the crisis hit. Unlike the US or the UK, where leverage and housing bubbles were the chief propellants of economic activity, Australia was at least riding a legitimate terms of trade boom. This meant that aggressive measures to stimulate consumption spending and invigorate the housing market were far more effective in Australia than they were in economies which for years had already been almost entirely reliant domestic bubbles for ‘growth’. Moreover, the level of the terms of trade and the Australian dollar in 2008 meant that Australia’s currency depreciation was particularly potent, supporting profits and jobs without delivering an overly traumatic shock to household purchasing power (since the nominal exchange rate had reached such a high level before it fell).

So while I don’t deny that the stimulus had an impact, more important forces took precedence in fairly short order. The stimulus probably wasn’t bad policy at the time, no one really knew how bad things were going to get in early 2009, but Australia’s economic performance over the past 5 years has been overwhelmingly driven by international trends beyond the control of its policymakers. The Australian moment identified by Megalogenis simply wasn’t replicable in most developed countries (Norway and Canada are probably the only close analogues).

So if we’re to uncharitably deprive Australia’s technocrats and politicians their a moment in the sun, should we discard the notion of an Australian moment altogether?

Clearly not, for two reasons. Firstly, the boom was one of the biggest, if not the biggest commodity boom we’ve experienced. It was a hell of a moment! Secondly, a complacent confidence that the boom would underwrite Australia’s long-term prosperity pervaded both industry and policymaking circles, and for that reason we should pay heed to the siren song of Australian Exceptionalism.

Golden Relief

I’ve focused a fair amount of attention on gold in the past fortnight, as it first approached, then hammered through, support around $1180. The effort to break that level and manage some followthrough had left gold quite oversold. Last night we saw a strong response from the market confirming this, with gold rallying around 3%, closing just under previous support.

gold3

The proximate excuse for the rally was a minor miss on the non-farm payrolls release, coming in at 214k vs expectations of 235k, down from 256k last month. The unemployment rate ticked down to 5.8% from 5.9% last month. It wasn’t a bad report all in all, although average hourly earnings missed again, reminding us of the absence of wage pressures or inflationary pressures in general.

Equities held up fairly well, as did the USD, which pulled back from its recent (stretched) highs, but did not fall out of bed by any means.

USDindex

Gold’s rally was therefore largely on its own back. A widely-held view says we’re in the final stage of the bear market for precious metals, with buying opportunities likely to present themselves soon. Short Side of Long has a good piece making the case today.

It’s fair to say that on most indicators precious metals were looking too heavily beaten down. This didn’t phase me a great deal, as I was looking for those indicators to get truly extreme (with gold approaching $1000) before the bounce. You can never be sure about the market’s psychology until after the fact though, and last night was instructive: good buying interest, coupled with skittish short-covering.

So was that the bottom? Can we discount the possibility that gold will test $1000 as has been my stated target?

Firstly, there’s the short-term question of whether gold has further to sell-off on the back of its technical breakdown. Secondly, there is the broader issue of whether we are actually in the final stage of the bear market. Is a sustained reversal in direction approaching in a matter of months not years? Or are we looking at long, multi-year bear market ahead of us?

On the first point, last night’s rally was the first sign of solid buying interest we’ve seen in over a fortnight, and a positive for gold. It’s failure to close above $1180 suggests a lack of conviction however, and my inclination is to read last night as a short-covering relief rally, with more falls to come. Nevertheless, it would take some cojones and disciplined risk management to opening new shorts at this point.

The second question is much deeper and relates to the performance of the USD over the next few years. The performance of the USD in turn depends on relative macroeconomic trends in major economies (or more accurately, the reactions of various central banks to those macro trends). I’ve written about my thoughts on the dollar in the last post, but I’ll return with a more detailed look at its historical relationship with gold when I’ve got a bit more time.

Welcome to the Ice Age?

ice-age-3-1

Having had the weekend to digest the Bank of Japan’s shock decision to increase its quantitive easing program, I’ve a few thoughts on what this might mean for the globe.

Permafrost of a permabear

Back in 1996, hyper-bear Albert Edwards unveiled his ‘Ice Age’ thesis, arguing that the West would find itself beset by the same deflationary forces that had seen Japanese equities persistently trade far below the bubbly peaks of the 1980s. This ‘Ice Age’ entailed equities under-performing both in absolute terms and relative to bonds (falling inflation makes fixed-interest securities more attractive, since in real terms the income received rises).

Even with the wild spasms of recent decades, his extreme bearishness towards Western equity markets has been a big loser.

US5001

This hasn’t discouraged him; you can see one of his latter-day howlers on the chart below.

US5004

The bond market, however, has been considerably more sympathetic to his thesis.

10yeartreasuries1

One of his key claims was that the US 10-year government bond yield would spend a long time below 2%. It spent some time below this level in 2011 and 2012 (something many would have considered impossible a decade ago), but news that the Fed was planning to ‘taper’ its QE program sent yields sharply higher in 2013. This, along with signs of growing strength in the US economy, had analysts and institutional desks calling a continuation of the bond sell-off in 2014 (rising yields). Quite the opposite has happened. In fact, as shorts stopped out en masse last month, the 10-year yield sunk briefly below 2%. (This isn’t captured on the chart below as it only plots daily closes).

us10year1

Despite the conclusion of the Fed’s QE program, markets have been anticipating a passing of the baton to the European Central Bank (ECB) as it initiated its own asset purchase program. This has been highly EUR-negative, and the cycling of funds out of EUR exposure into USD has likely supported demand for US bonds. This strong demand for the USD, as the outlook for relative monetary settings began to clearly favour the greenback, has driven back inflationary pressures.

USCPI1

Falling inflation is uncharacteristic of an economy in an upswing, and has kept demand for bonds healthy even as equities marched higher this year. Indeed, the general absence of inflationary pressures is, to my mind, a central feature of global economy today. As I have said before, “from the US to the UK to China to Japan to Europe and even Australia, the spectre of deflation looms large over the global economy.” So although I tend to ignore Edwards’ hysterics regarding the ever-looming equities Armageddon, his Ice Age thesis, at least the deflation foundations on which it rests, is worth paying attention to.

Bank of Japan’s boreal blast

White-walker
BOJ Governor Haruhiko Kuroda

It was into this environment, of persistently low global inflation, that the BOJ dropped its QE bombshell on Friday. This chart from the Financial Times illustrates the magnitude of the monetary stimulus afoot in Japan.

bankofjapan

The movement of foreign exchange rates, which signify the nominal value of a currency against its peers, basically maps out the relative monetary policy trajectories of the institutions that issue those currencies (central banks). When a central bank is loosening its monetary policy (or rather when markets expect that this will be the case in the future), the currency it is responsible for tends to depreciate, ceteris paribus. Conversely, when the market anticipates monetary tightening, the tendency is for the currency to appreciate. It is useful to recognize then that although currency changes hands when international trade in goods and services takes place, the ‘goods market’ has very little influence on exchange rates in the short- or medium-term, when set against the influence of the ‘capital market’. Which is to say, money changing denominations happens primarily for investing and speculative purposes. (Note: when the euro crisis was raging, currency markets oscillated primarily on a risk-on/risk-off dynamic; the EURUSD being the axis of the market’s risk temperament. After mid-2012, currency markets drifted back to a relative monetary policy dynamic.)

It is scarcely surprising then that the Japanese yen has undergone a massive depreciation since late 2012, when it became clear that the BOJ would embark on a radical expansion of the money base, or that the announcement of further easing on Friday sent the yen into freefall. (USDJPY rising indicates the yen is falling against the USD.)

USDJPY

The reason I have mentioned Albert Edwards is that back in September he received a fair amount of attention for his call on the USDJPY (from Bloomberg):

A divergence in U.S. and Japanese monetary policy — with the Fed slowing stimulus and the Bank of Japan expanding the money supply by record amounts — may have started the exchange rate moving. Now that the yen is past a tipping point, Edwards says the psychology of traders is likely to take over and turn the currency into a runaway train.

“Now we’re heading to 120, which is the 30-year support,” he said. “You break through that, and you can see it moving to 140, 150 very, very quickly indeed.”

Edwards found the yen’s price graph so compelling, he devoted an entire client note to it last week. He called it: “Presenting the most important chart for investors.”

I shared his view towards the yen wholeheartedly, although I certainly wasn’t expecting the BOJ to move this early on further stimulus, nor, consequently, that the yen would move so fast so soon (and remember that it was only by a 5-4 majority that the BOJ decided to increase its QE program on Friday).

So, with the USDJPY now on track to breach 120 within the next 6 months or so, we best reflect on some of the possible implications of this move, remembering, as always, what Aristotle may or may not have said: It is the mark of an educated mind to be able to entertain a thought without accepting it.

Currency chills 

A currency devaluation is akin to a tax on domestic consumption and a subsidy for domestic production. When the currency falls, it reduces the purchasing power of domestic households. This tends to cause fall in demand for imported goods, which are now more expensive relative to local goods, and an increase in demand for locally-produced goods. Total consumption tends to decline as the wealth effect dominates the substitution effect. On the production side, firms can now lower the foreign currency price they charge for their exported goods, since a lower foreign-currency price can provide them with the same revenue in domestic-currency terms. Straight away, therefore, we can see that this tendency to reduce consumption and increase production is inherently disinflationary for trading partners. The bigger the economy is, the greater the international impact of the devaluation.

(Of course, the BOJ is easing because it is trying to increase inflation in Japan. A currency devaluation raises the prices of imported goods, and it is hoped that this contributes to sustained gains in domestic prices, especially wages, and in so doing negates the need for perpetual currency depreciation. Whether this domestic goal is met is uncertain; the export of disinflationary pressures as a side-effect is not.)

Currently Japan is the third largest economy in the world. A big depreciation in the yen will therefore have important global consequences, and indeed these are likely to be playing out already.

Glacial creep

China undertook a significant currency intervention earlier this year, which has no doubt contributed to the rise in net exports in recent national accounts data.

USDCNY

This fall has been partially retraced in recent months, despite pronounced USD strength, as the People’s Bank allowed its foreign reserves to decline. Recent moves in the USDJPY, and the likelihood that it will devalue to 120 in fairly short order, therefore represent a jump in China’s real exchange rate. By and large, China still produces lower value-add products for export than Japan, for instance fully assembled automobiles and vehicle components remain Japan’s largest exports by a long way, whereas China exports few fully assembled cars (though it has developed a stronger presence in vehicle components). Nevertheless, China has been rapidly closing the gap in this regard, and therefore Japan’s currency devaluation will make it more difficult for China to compete in those higher value-add industries which Japan currently enjoys a lead.

Moreover, Japan is China’s third largest export destination (8.3% of total), and China’s largest source of imports (10%), so the sharp depreciation of the yen against the renminbi will place substantial pressure on China’s competitiveness with a very significant trade partner.  This will add to what are already difficult times in China’s economy, and if it’s not offset by stronger credit growth and a rebound in property (and there are tentative signs of both) then the PBOC may well judge it necessary to place further weight on the renminbi. Any depreciation in the renminbi would amplify China’s exporting of deflationary impulses, which has arisen from domestic overcapacity. We should therefore keep a close eye on Chinese factory data, and remain alert to any signs of a policy shifts.

There has been some improvement at the margins in Europe over the past year, with Spanish unemployment falling to 24.4% from high of 26.3% early last year. Clearly, this is still a monstrously high figure, and celebrating the fall requires a certain sadistic sense of humour. And sadly, more important than any signs of life in the periphery this year has been the weakening of the core, namely Germany. There is a risk that the Q3 national accounts will show Germany in a technical recession, and inflation has been falling (as it has across Europe). Similar to Japan, Germany’s export engine is heavily skewed towards cars and vehicle components.

Japan’s assault on the yen therefore represents a stiff challenge to Germany, whose economy has been consciously engineered to be hugely reliant on export competitiveness. So far this year the EURJPY has been largely flat, as the EUR sold off heavily in anticipation of ECB easing.

EURJPY

Now that the yen is getting hammered, a bold monetary response from the ECB is assuredly required to prevent further deterioration in Europe. Whether we get this in the near-term is debatable; there is still staunch opposition to large-scale quantitative easing from Germany. We’ll have to wait and see if Japan’s devaluation forces a capitulation from the Teutonic hawks. If the ECB stops short of a significant easing program, there is ample room for a EUR rally, which has hit the single currency area hard. Conversely, if they do deliver, it will provide yet more support for the rampaging USD rally.

The frozen core

Evidently, the discussion so far has centred on how affected countries might respond to the threat of increased competition from Japanese exports in the event that the yen continues to sell off sharply. The threat, of course, is to the production base of those countries. As Japanese production rises and consumption falls, real global aggregate demand falls and supply rises, unless the shifts in Japan are offset with less supply and more demand in other countries. But if China decides its shift to internal consumption demand entails too great a slowdown, and rescinds on its commitment to undertake structural reforms (say by devaluing the renminbi or funding more investment spending); and if Europe moves to protect domestic production by easing monetary policy, further devaluing the EUR against the USD, then clearly the international adjustment will fall upon the only economy with the wherewithal to absorb such a burden: the USandA. (Note: this is why commentators are, or should be, so interested to see China and Germany rebalance their economy towards internal consumption, not just for their own sake, but for the global economy’s.)

As exchange rates are priced in terms of other currencies, one currency’s loss is another’s gain. Given the weakness in yen, euro and sterling in the second half of the year, it is no surprise that the trade-weighted USD index has seen brisk gains. (This is not to say that the USD has been rising solely due to others weakening; it has been the divergent outlooks for monetary policies in the respective regions where each currency is used, that has led to these moves.)

Screen Shot 2014-11-03 at 12.59.53 pm

There are a few ways the US economy can react to this development, and these adjustments become more pronounced the greater USD revaluation. Essentially, a rising currency provokes the opposite responses in the home country from when it is falling. So a higher USD tends to increase consumption demand amongst US households, since their purchasing power has increased. Likewise, there is a marginal substitution away from locally-produced goods in favour of imported goods, which are now cheaper. Therefore, a rising USD exerts disinflationary pressures on the domestic economy.

A currency devaluation typically raises a country’s trade surplus, or reduce its deficit, whereas an upwards revaluation reduces the deficit or increases the surplus (speaking generally). If the US allows its currency to appreciate strongly over the next few years, the inclination will be for the US trade deficit to increase, as it responds to higher foreign production and lower domestic production, and lower foreign consumption and higher domestic consumption. But if the US is consuming increasingly more than it is producing, it must borrow the difference from foreign lenders. Luckily, higher foreign production and lower foreign consumption necessarily entails higher foreign savings, which can be lent to the US to fund its trade deficits. In fact, this process is just about automatic in the modern international system. Since the US issues the reserve currency, there is very little it can do to impede the flow of capital into or out of the USD.

This increase in capital flows into the US economy can either be directed to investment, be it productive or unproductive, or consumption. During the US housing bubble last decade, the US found itself accumulating massive foreign liabilities which were funnelled into speculative (unproductive) housing investment and consumption. Without the government stepping in and running big deficits, the private financial sector was left to allocate the capital, and did a spectacularly bad job of it.

This brings us to one of my core arguments concerning the present state of the global economy; a sustained USD bull market likely means the US must experience another private credit boom, funding unproductive investment and consumption, or that the government needs to run big deficits. (it is no use arguing that private business investment ought to rise; a strong USD reduces US competitiveness and more or less automatically crimps private business investment). If neither of these conditions are met, then the US economy will experience a prolonged period of weakness and constantly flirt with frigid deflation.

Some qualifications 

The Federal Reserve could respond by loosening monetary policy further, and in so doing quash the USD rally and negate the debt-or-deflation trade-off. I examined the possibility of more QE last month, and felt that there was far more likelihood of an extension of zero interest rates than more asset purchases. Nevertheless, the risk of more QE rises the stronger the USD gets and the further inflation falls. More QE from the Fed would then mean an (unintentionally) coordinated global monetary stimulus, which would reduce the necessary adjustments in goods and capital markets from currency movements (since the movements would be less pronounced). This would be fine, except that owing to the nature of modern central banking, this stimulus would almost certainly feed asset bubbles long before it fed general goods and services inflation, setting the global economy up for another crash at some point in the future.

Another consideration pertains to developments in energy markets. When the US was running monster trade deficits during the housing bubble last decade, the most important surplus nations were the East Asian economies (China especially) and petroleum exporters. (See chart below.)

As an aside, there is a school of thought, to which I subscribe, which argues that these global imbalances were a fundamental condition of the various bubbles leading up to the crashes of 2008 and then the Euro crisis. (Although, arguing that they themselves were the cause of financial crises merely demands an explanation of the causes of the global imbalances.)

globalCA

The shale gas and then oil booms have therefore been of signal importance to the US economy’s reduced susceptibility to large trade deficits.

US oil

Whenever we generalise about the mechanics of economic adjustment, such as when we assert that a currency appreciation forces a deterioration in a country’s trade balance, we must be alert to the myriad of real-world nuances that could prevent such a response. There is no doubt that cheaper oil, should it be sustained, provides a significant boost for the US economy, even with the shift towards domestic production. More to the point, if the US manages to reduce the cost of shale drilling, fend off the challenges from overseas and continue pushing its oil production higher at a rapid clip, then this phenomenon could dominate the effects of a stronger dollar. In which case the trade balance may not worsen, and the debt-or-deflation trade-off I believe would arise from such a development may not be a meaningful consideration. All it would mean is that part of the burden of adjustment from the various currency devaluations around the world would shift to petroleum exporters (hardly an unwelcome prospect).

In summary, in the absence of a renewed preparedness to deploy monetary stimulus from the Fed, the appreciating USD could well force upon the US a choice between rising indebtedness (again) or stagnant prices and labour markets. As I see it, the manner of this adjustment will depend heavily on developments in the crude oil market, and the degree to which other major economies take upon themselves the burden of consumption. Most importantly, if China suddenly started running big trade deficits owing to higher domestic consumption demand, this would lessen the need for the US to choose between debt or deflation.

One final point bears mentioning. It may seem odd to be mulling over the global economy’s polar prospects in an era of mass money printing. Surely this is all going to be madly inflationary at some stage? However, it is important to remember the delivery channel of quantitive easing. When central banks wish to expand the money supply, the attempt to inject money into the economy by purchasing financial assets (mainly government bonds) from financial institutions. In modern experience, the money those financial institutions receive in exchange for their assets is overwhelming left idle as reserves deposited with the central bank. Hence the extraordinary monetary stimulus of recent history has left little in the way of an inflationary legacy. This could all change if for some reason banks embarked on a mad lending spree, pumping those idle reserves into the economy. For now though, there seems scant chance of that.

‘Strayan connection

As usual, Australia would be tossed about like flotsam in the surf were all this to play out. First and most obviously, a strong USD typically hurts commodity prices. Much of this would be offset by a weakening Australian dollar, and there are obviously much more pressing concerns with say iron ore than a strong USD. The long suffering coal industry would come under further pressure, as US exports directly compete with Australian coal (all the more so after the shale gas and oil booms displaced coal as a power source in the US). However, of much greater concern to Australia is the risks that the yen devaluation poses to our emerging LNG industry.

In March 2011, Japan was devastated by a tragic triple-disaster of earthquake, tsunami and nuclear meltdown. One understandable consequence of this disaster was the shutting down of all Japan’s nuclear reactors, which required an immediate switch to imported fossil fuels. This drove Japan’s trade balance into deficit, where it has remained in spite of the massive currency depreciation from late 2012.

Japantradebalance

One reason why this has happened by been the inelastic nature of Japan’s demand for energy. With few available alternatives, Japan has needed to import the same amount of oil, gas and coal to meet its domestic needs, and all this imported fuel has become more expensive following the yen depreciation. There was already concern within certain segments of corporate Japan that the costs of higher energy were offsetting the competitiveness improvements from the lower currency.

If the USDJPY is indeed on its way to 120 and beyond, I find it hard to see Japan weathering this depreciation in the yen without turning the nuclear reactors back on. It is true that there is strong community opposition to this, but the more expensive energy becomes, the less sway this sentiment will hold. There have already been moves to restart some reactors lately. Should this occur on a large scale, it will pile pressure on to Australia’s gold-plated LNG industry, which is already facing challenges from US and Russian gas, and the slump in crude oil prices to which LNG contract prices are linked.

Further reading

For a more detailed discussion of the mechanics of international trade and capital flows, and the issue of global imbalances generally, see Michael Pettis’ book, The Great Rebalancing, and/or his blog, China Financial Markets.

There was a spirited debate last decade, prior to the financial crisis, concerning the sustainability global imbalances, dealing especially with the question of the US current account deficit. One influential school of thought argued that the US current account deficit was a natural and healthy feature of the international economic system, largely explained by the inability of immature financial markets in developing countries to fully allocate their savings domestically, which entailed no painful adjustment. This view was exemplified by Dooley, Folkerts-Landau & Garber (2003) and (2004), but was evident also in Chinn & Ito (2005), Bordo (2005), and Backus, Henriksen, Lambert & Telmer (2009).

On the other hand, some authors did recognize the risks building up due to ballooning global imbalances, and sounded warnings accordingly. Examples include, Obstfeld & Rogoff (2005), Edwards (2005), and Roubini & Setser (2004).

It should come as little surprise that I side wholeheartedly with the latter camp.

Going, going…. gold!

Breakdown. 

gold2

As I discussed this morning, gold had well and truly rolled over after its equities rout-induced bounce, and was again staring at vital support at $1180, with an abyss beyond that.

breakdown

It’ll be interesting to see if it does capitulate from here. The swan-dive below support has come in the wake of the BOJ announcement that its increasing its QE program. This has seen risk assets (equities) fly and gold sell-off.

A gold rout on the back of tightening US monetary policy is a fairly straightforward affair; but one which took its immediate catalyst from looser Japanese monetary policy is a bit more uncertain from where I’m sitting. The outlook for US monetary policy of course not at all favourable to gold, so my expectation would be for a continuation- there’s nothing but air below 1180- but we’ll have to wait and see.

The Lords giveth…

…and the Lords giveth again

Just as you were thinking the central bankers’ levitation elixir was looking a little drained after the conclusion of the Fed’s QE program, the Bank of Japan has come out with a big surprise, adding to its own QE program. Full release. Basically, the recovery is lumbering along but price pressures remain weak, and so the BOJ narrowly voted to raise its asset purchases.

Naturally, the yen went berserk and equities roared.

yen1

nikkei1

And, of course, not just in Japan, with the S&P surging right to its all-time high before easing back.

sandp1

A persistent theme on this blog has been the absence of any significant inflationary pressures globally. Japan has more experience with the challenge of deflation than any other major economy, and in 2012 decided it would at last meet this head on with a vigorous quantitive easing (money creation) program. The mere promise of this sent the yen tumbling (USDJPY rising means the yen is falling against the dollar).

yenLT

And the Nikkei to the moon.

nikkei2

In April 2013, the BOJ announced the details of its much-anticipated easing initiative, and did not disappoint. It committed to doubling the money base, adding around 130 trillion yen over 2 years, with the aim of pushing the inflation rate above 2% within that timeframe. This announcement provided the impetus for a continuation of the moves in currency and equities markets, but then over the subsequent 12 months the yen was mostly flat against the dollar, settling at the 102 level this year (until the resurgent USD broke the tranquility).

This massive currency deprecation managed to drag price changes into positive territory, but persistent and sustained inflation has nonetheless remained a challenge. Japan introduced a sales tax hike this year, as part of a reform agenda to improve the government’s dire fiscal position, which obviously added to price pressures. After allowing for this artificial boost to consumer prices, the inflation rate is barely half of the BOJ’s target, which explains today’s decision.

Never a dull moment!

Golden Trouble

The barbarous bears are bearing down upon the barbarous relic.

I’ve had a negative view on gold for some time, which stemmed naturally from an uncontroversial bullishness towards the USD.

Gold threatened support at $1180 earlier this month, but did not break it. At the time, I wrote that this was a “garden variety technical pattern which often would be interpreted as a bullish signal, but that’s certainly not how I’m looking at this market.”

gold1

Despite noting room for a short-term bounce, my negative view of gold was reasoned thusly:

The entire ‘buy gold because the Fed is printing money, stoking inflation and trashing the dollar’ theme has been unraveling since early last year, as it became clear that QE would end with no inflation in sight and the dollar outperforming, rather than collapsing. Depending on the severity of the equities downturn and the follow through on the dollar, I’d be looking for gold to break $1180 by the end of the year, heading below $1000 in fairly short order.

I wavered a little on the timeframe during the last few weeks, as the risk increased of dovish concessions from the Fed. But this week’s Fed meeting dispelled those market musings, and gold has been clobbered accordingly.

golddaily

Looking perhaps a little oversold on the the dailies, but support at 1180 is now firmly in the crosshairs. Should it break, my more aggressively bearish outlook on gold would be in play.

Equities’ gain, gold’s pain

One point I highlighted in that discussion on gold earlier this month was the support which an equities sell-off would provide gold. As you can see, gold moved in inverse lockstep with the S&P this month.

S&P31:10

Spiking volatility, signifying heightened risk aversion, typically favours gold. Thus the emphatic equities rebound (which I should say has so far made a mockery of my concerns of a more turbulent end to QE; question now is if it can establish and hold a new high), and the calming of market nerves, has also hurt gold.

Update (31/102014)

Going, going… Gold!

Update (5/10/2014)

The rout has deepened as the mighty USD dispatches all challengers.

GOLDST

On a longer timeframe we can see that the current breakdown is reminiscent of the 2013 collapse. We shouldn’t read too much into these kinds of patterns but the overall environment for gold is heavily bearish, and obviously I’m looking for substantial downside here.

GOLDLT

The unstoppable dollar makes a gold rally hard to come by. Inflation is going to be turning hard south if the USD holds and extends its recent gains (bearing in mind that its looking rather overbought against the yen). Yields will remain subdued. The only friend gold has really is the Fed; a decidedly more dovish tone from the Fed is required to rescue gold in the near term, and the prospects of that appear remote.

Retail Details

It may not be apparent from its serene outer appearance, but a constant battle rages at Strayanomics between thoroughness and brevity. I would like any argument I make to be as well-supported as possible, but the detail this demands can be excessive. Unfortunately, attempts to keep a post as short and timely as possible risk inaccuracies, especially as this blog is a personal learning exercise as much as anything.

So it was with my shallow treatment of consumption spending in the interest rates update for October. In it, I wrote:

A large part of the why the housing boom has not had the wider economic impact one might have expected is that households have been reluctant to respond to higher net worth in the usual manner of saving less and spending more.

Whatever the cause, consumers have chosen to remain stubbornly parsimonious in the face of rising wealth. Until they throw caution to the wind, there is little in the outlook for consumer spending to recommend higher interest rates.

I based this observation on two pieces of evidence: the national savings rate and retail sales data, which at first glance wasn’t unreasonable. The savings rate remains elevated:

Screen Shot 2014-10-22 at 6.54.48 pm

And, notwithstanding a jump into Christmas last year, national retail sales growth has been notably weaker than in previous periods of strength in the housing sector (2001-2004, for instance). Momentum has also clearly been lost in 2014, despite ongoing strength in housing.

RetailSales

The problem was that I extrapolated out some mysterious shift consumer behaviour from these data, which wasn’t really justified.

I have highlighted a number of times that the housing boom has largely confined itself to Sydney and Melbourne.

Screen Shot 2014-10-20 at 8.19.19 pm

It should have come as little surprise then that consumption spending in NSW and Victoria has outpaced the nation as a whole. NSW has seen the largest increase by a long shot, mirroring the outperformance of house prices in Sydney.

RetailsSalesNSWVIC

In contrast, the mining states, along with perennial laggard, SA, have drifted below the national figure.

RetailSalesRest

If we take a longer-term view of spending in NSW, we can see that the housing boom in that state has indeed had the impact one would expect.

RetailSalesNSW

There really isn’t anything mysterious about the apparent frugality of Australian households, nor what looked like their reticence to spend out of rising housing wealth. The national figures merely mask regional differences. In states that are experiencing the winding down of the mining boom first-hand, households are considerably more sparing in their purchases. In NSW and to a lesser extent Victoria, the booming capital city housing markets are raising consumption spending, pretty much in line with what you’d expect. Thus, the reason the housing boom has not had “the wider economic impact one might have expected” is simply because the boom has not been especially wide

I might add, this doesn’t alter my narrative on interest rates, at least not at this stage. Firstly, it reinforces the picture of our bipolar economy (cyclical strength versus structural weakness, as outlined in the October rates post). Furthermore, it reminds us that low interest rates are critical to keeping Australia from sliding ever-closer to recession (or what will feel like a recession; substantially higher export volumes may shield us from recession in a technical sense). If the RBA hikes, we not only lose the momentum of housing construction, but we’re also likely to see growth in consumer spending cool materially as housing slows. Such is the bind our monetary technocrats find themselves in.

Was that it for volatility?

A couple of weeks ago I posted a piece which was mostly concerned with the re-emergence of volatility in markets.

In it, I noted that the S&P500 had breached what was surely the most-watched trend line in the world, and looked poised for a deeper sell-off.

sandpLT

A deeper sell-off we got, but a prolonged one we certainly did not.

S&P500

That violent whipsaw has seen S&P reclaim the trend, if only just. The VIX has accordingly been smacked down just as quickly as it rose (though it remains elevated relative to recent extreme lows).

Screen Shot 2014-10-27 at 7.00.38 pm

So, was that the little vol episode over and done with? Can we get on with the smooth rally again now?

We shouldn’t be quite so hasty. As you can see on these charts from Elliot Clarke of Westpac, the aftermath of the previous conclusions of QE ushered in significant volatility.

Screen Shot 2014-10-27 at 7.09.48 pm

Screen Shot 2014-10-27 at 7.10.15 pm

The title of that second chart, I might add, speaks a most important truth. Quantitive easing is colloquially known as money printing. For something to be considered money, it requires certain attributes, most commonly that it’s a store of value, a unit of account and a medium of exchange. The last of those is where the QE hits a snag. The Fed cannot legally create money and exchange it for anything other than financial assets; it creates liquidity and uses it to purchase government bonds and asset-backed securities from commercial banks. In so doing, those banks see a decline in bonds on their balance sheet and an increase in reserves. The Fed would like those commercial banks to then lend those reserves out into the economy and stimulate economic activity, but for the most part they have not.

Much of this new ‘money’ being created by the Fed through its QE programs is therefore sitting idly in its virtual vaults. That being so, how does QE affect asset prices aside from those that the Fed is actively transacting in? (Government bonds and ABS.)

The main channel is the suppression of volatility. Through its Permanent Open Market Operations (QE), the Fed becomes a giant, regimented provider of liquidity in bond markets, thereby reducing interest rate volatility. This naturally then flows into other markets. Part of this process is direct, by virtue of the Fed’s participation in markets, and part of it occurs as a result of the general shift in market psychology: participants believe that the QE lowers volatility, meaning they transact less, driving down volatility further. Participants believe that others believe this, and so on and so forth.

In my view, it is the decline in volatility that is the critical channel through which QE supports asset prices, especially equities; more so that lower yields. Risk is not confined to the variance of returns, but that is a key measure used in the market. Lower variance of returns encourages risk-taking, driving up risk assets such as equities. (The steady rally in equities is of course itself reflected by even lower volatility, so the process is self-reinforcing. This works in reverse when volatility starts to rise.)

The key now is whether the S&P can hold on the trend line, and carry global equities in the process. Recommending equities this time around is that the US economy is in unquestionably better sharp than it was at the end of either of the last two programs, and that the fed funds rate isn’t actually going to rise for some time yet. Nevertheless, rather than signalling an abrupt end to this latest volatility episode, I’m still of the view that major asset markets will experience significant ructions over the next few months, unless the Fed surprises on Thursday by delaying the end of its bond buying program or substantively prolonging the expected timing of its first rate hike. Likewise, a big surprise from the ECB with respect to its own QE program would also be supportive of more relaxed market conditions.

A bond bear market or a dollar bull market?

There was one other thing I wanted to discuss, which is the likely trade-off between a bear market in bonds and a bull market in the USD. The former was widely expected to arrive with the end of QE, the strengthening of the US economy and the eventual normalisation of short-term US interest rates. The Fed buys US government bonds as part of its QE program, thus the providing demand. When this demand is removed from the market, so the common view held, bond prices would decline and yields rise. Supporting this view was the violent sell-off in bonds that accompanied the announcement last year that the Fed would ‘taper’ its bond-buying program (in late May).

US_10year

Alas, this year, and in spite of clear indications of economic improvement in the US, especially in the labour market, yields have been trending down. In the last couple of months this movement was especially pronounced. The chart above significantly understates the intraday volatility the week before last, since it only captures daily closes. At one point, yields fell below 1.9% as bond bears stopped out en masse.

Part of the reason for this slump in yields (rally in bond prices) has been the ongoing absence of inflationary pressures globally, which if anything seem to be abating further. Economic recoveries are typically associated with rising inflation, which makes bonds less attractive. Tepid inflation has therefore supported bonds. Europe is flirting with deflation, Japan is battling to maintain what little inflationary momentum was generated by its sizeable currency depreciation, and China’s chronic overcapacity encourages to its ongoing export of ‘disinflationary’ pressures (see steel, for instance). Adding to this has been the sharp decline in oil prices, which is inherently disinflationary, although not of the sort that demands a monetary response.

Throw a strong USD into this mix and the US is going to find it extremely hard to lift inflation into a range that warrants ‘normal’ interest rate settings. So if the USD continues to rally, I find it very hard to see a trending bear market in bonds. The only thing I can really imagine that would facilitate a simultaneous USD bull market and bond bear market would be another credit boom, to support US demand and prices (particularly wages, which are more or less flat real terms), to such a degree that the strong dollar does not completely quash inflation.

There’s probably something I haven’t considered there, but it’s an interesting scenario to ponder, I reckon.

Strayan Rates – October Update

The Australian cash rate is one of the focal points of this blog. In my first post on ‘Strayan rates, I wrote:

Picking the path for the RBA’s cash rate is a prime task for any would-be economic forecaster, as it’s both a key indicator of economic conditions as well as a critical determinant of them.

Whenever the RBA next adjusts the cash rate, it bears acknowledging that the 25bp move isn’t likely to be the critical determinant of economic conditions at that point in time. It will have an impact, but my focus has more to do with what the move will intimate about the state of the economy.

With this in mind, my first series on rates sought to sketch out a portrait of the Australian economy. My conclusion was that the evidence pointed to a greater probability that rates would fall with the next move, rather than rise.

Each month or so, beginning with this post, I’ll provide an overview, of varying detail, of the most important economic indicators for Australia, and update my view on interest rates accordingly.

Onya, Timmy!

Before I begin I want to mention the work of Tim Toohey, head of Macro Research for Australia and New Zealand at Goldman Sachs. I intentionally singled him out in that first post two months ago, as the loss of his rate cut call at the time left blanket agreement across institutional research teams in Australia that the next move in the cash rate would be up. (What better moment to dive in and swim against the tide, I thought!)

He abandoned this call with considerable reluctance, and last week he reiterated why that was the case:

A feature of our research over the past 18 months has been to break away from the guide posts that have served us well in obtaining a read on the future direction of economic activity over the past decade. Historically we had looked to easing financial conditions, rising confidence and rising wealth as important touchstones for a future acceleration in economic activity. These were indicators that had proved their worth over the prior 30 years. As such, our decision to adopt a far more cautious view than the consensus over the past two years was not born of the idea that these indicators were suddenly of less worth. They were born from the idea that there were other forces that were likely to be more powerful, namely the likely sharp decline of the terms of trade, the likely sharp decline in mining investment and a lack of economic incentives to drive a pickup in broader business investment, the likely persistent challenge of fiscal consolidation and an uncompetitive production base relative to Australia’s trading partners.

As will be clear to anyone who has read Strayanomics in any detail, this matches my own view of the economy with precision. (The most prominent voice advocating this view has long been David Llewellyn-Smith of Macrobusiness, to whom I owe much. Lately, Stephen Koukoulas has also joined the merry men, and is the only economist of 27 surveyed by Bloomberg who expects the next move to be a cut. For a longer-term perspective on why those of us calling rates lower are doing so at this time, see Ross Garnaut’s Dog Days, an immensely insightful book.)

Back to that first ‘Strayan rates post:

In a country like Australia, changes to interest rates tend to be quite effective in influencing economic conditions. Lower rates stoke borrowing, asset prices and consumption, giving way to higher rates, and vice versa. Why then are we drifting across a calm blue ocean of low interest rates?

Primarily due to the uneasy schism that has emerged in our economy. On the one hand we have the descent from what has almost certainly been the biggest terms of trade/investment boom in our nation’s history. On the other we have a raging house bubble boom. Which force prevails in this struggle will determine the short- to medium-term direction of interest rates.

As the rest of that series made clear, I have based my forecast for lower rates on the view that the terms of trade decline, the mining investment wind-down, lacklustre business investment ex-mining, the fiscal squeeze, and weak competitiveness would outweigh the impact of rising asset prices, speculative activity and consumption demand that have flowed from the last easing cycle. When Mr Toohey discarded his longstanding rate cut call in mid-August, he was conceding to the power of the latter.

Nevertheless, he has made a strong case for the ongoing possibility that rates could fall further, and his thesis is one that I think deserves attention.

Outline

The rough qualitative model I’ve been using essentially places the terms of trade and mining investment downturns, along with weak government finances and Australia’s poor competitiveness, into the structural basket. On the other hand, brisk gains in house prices, which have been driven increasingly by investor mortgage lending, and the boom in residential construction (especially apartments), I place in the cyclical basket, as they’re directly attributable to the last easing cycle. It’s a slightly clumsy oversimplification of terminology, but it serves its purpose.

Broadly speaking, structural forces argue for lower rates, whereas cyclical forces tentatively argue for higher. This, of course, is exactly the dynamic Tim Toohey and others have been emphasising.
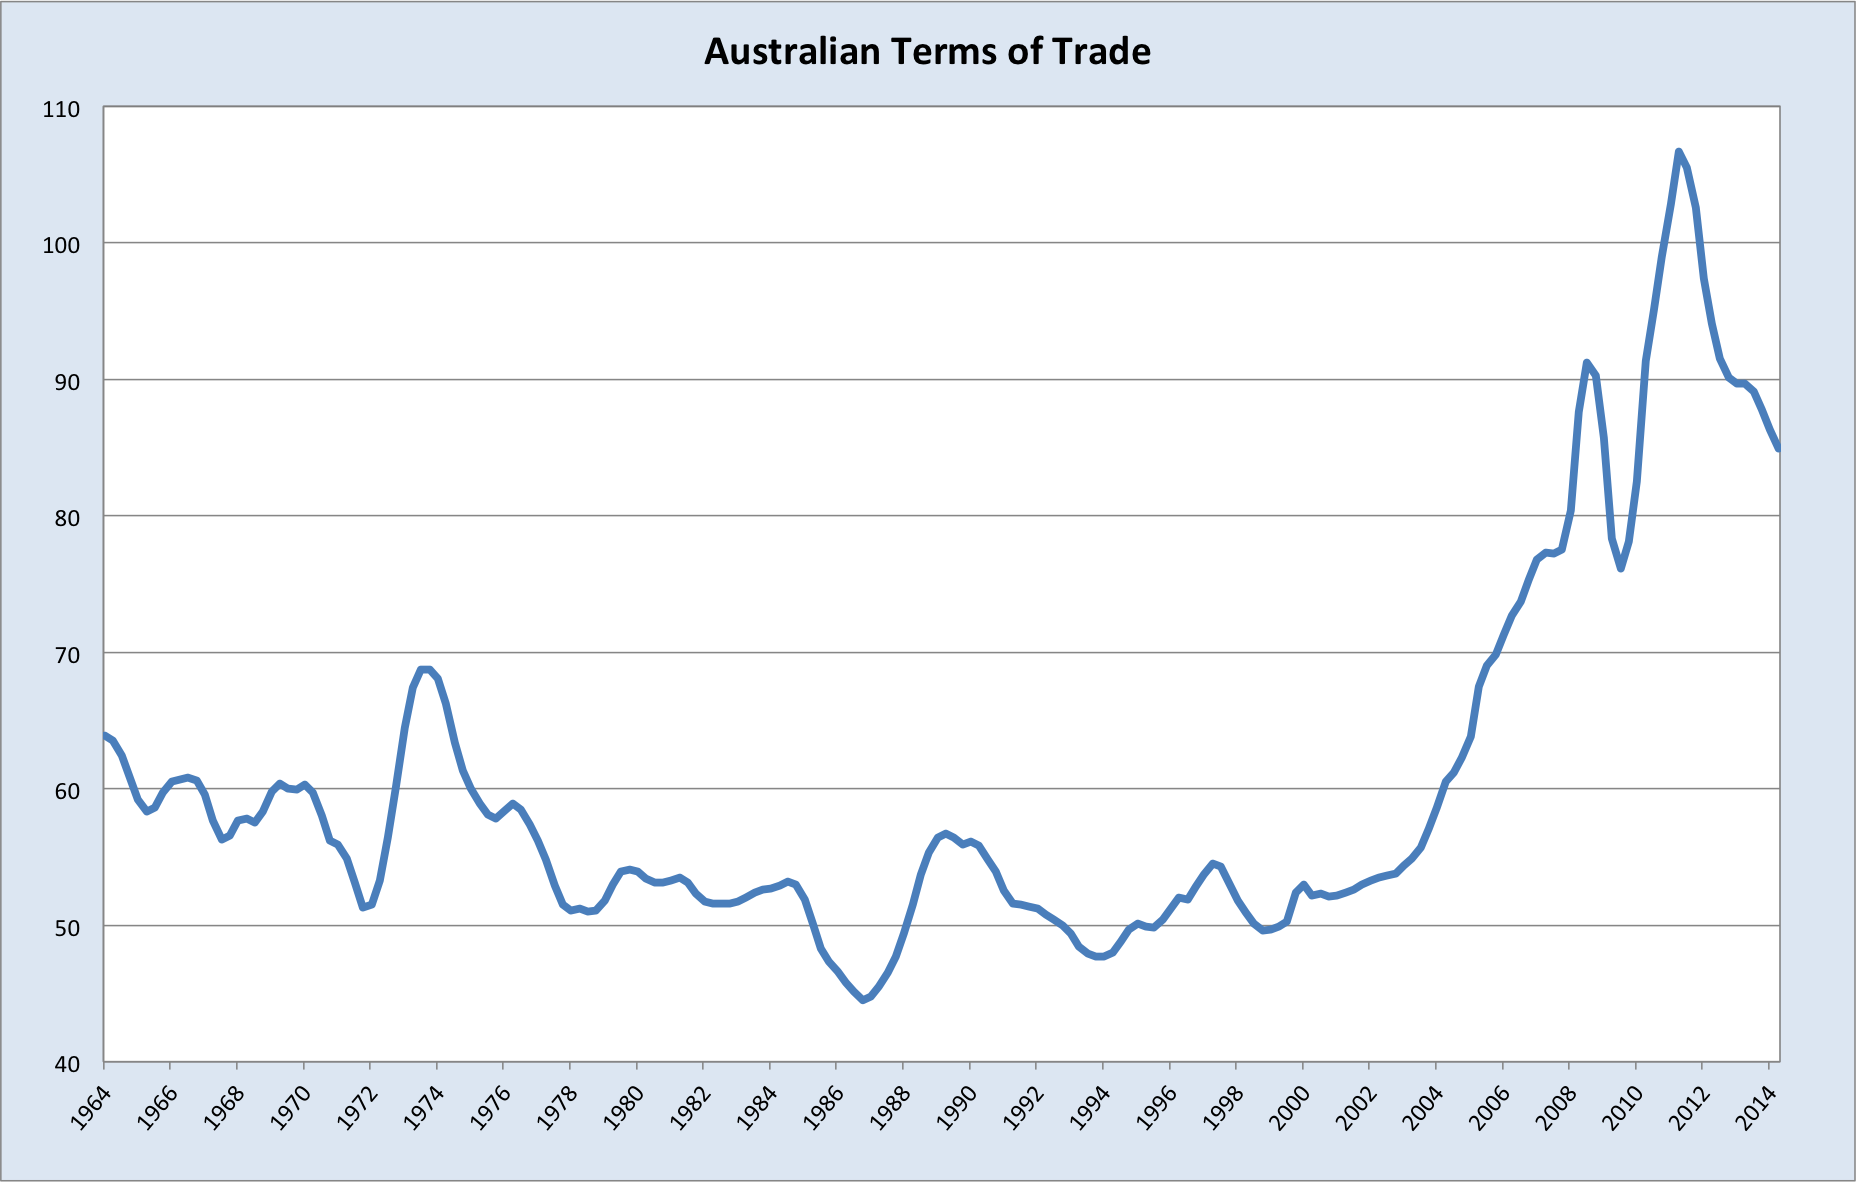
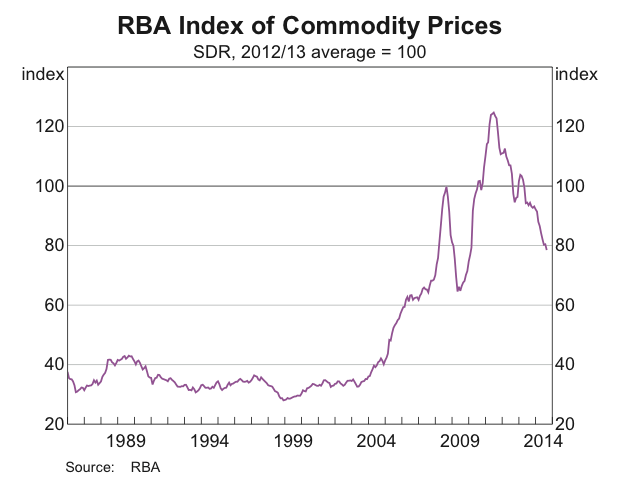
Terms of Trade

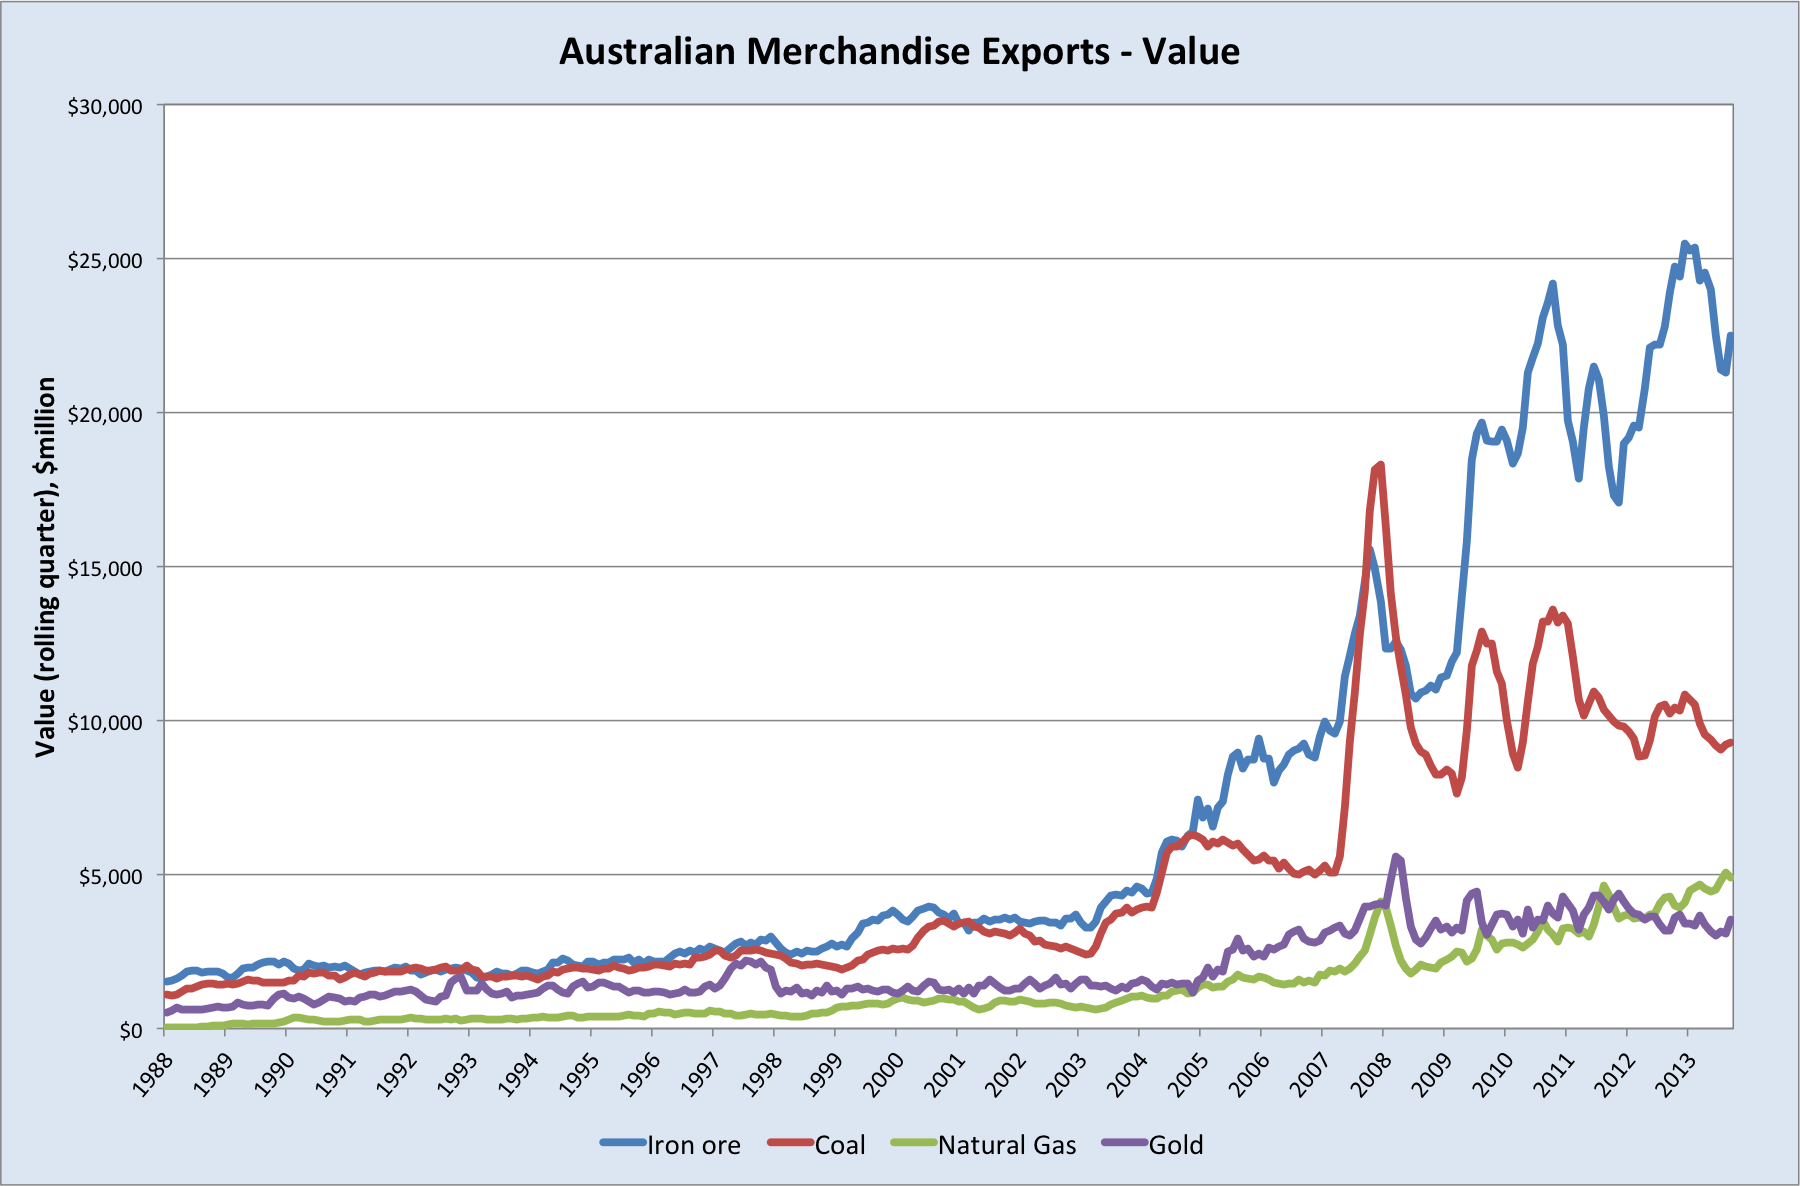
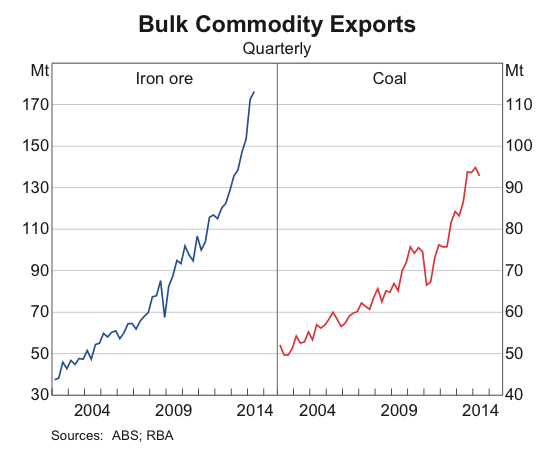
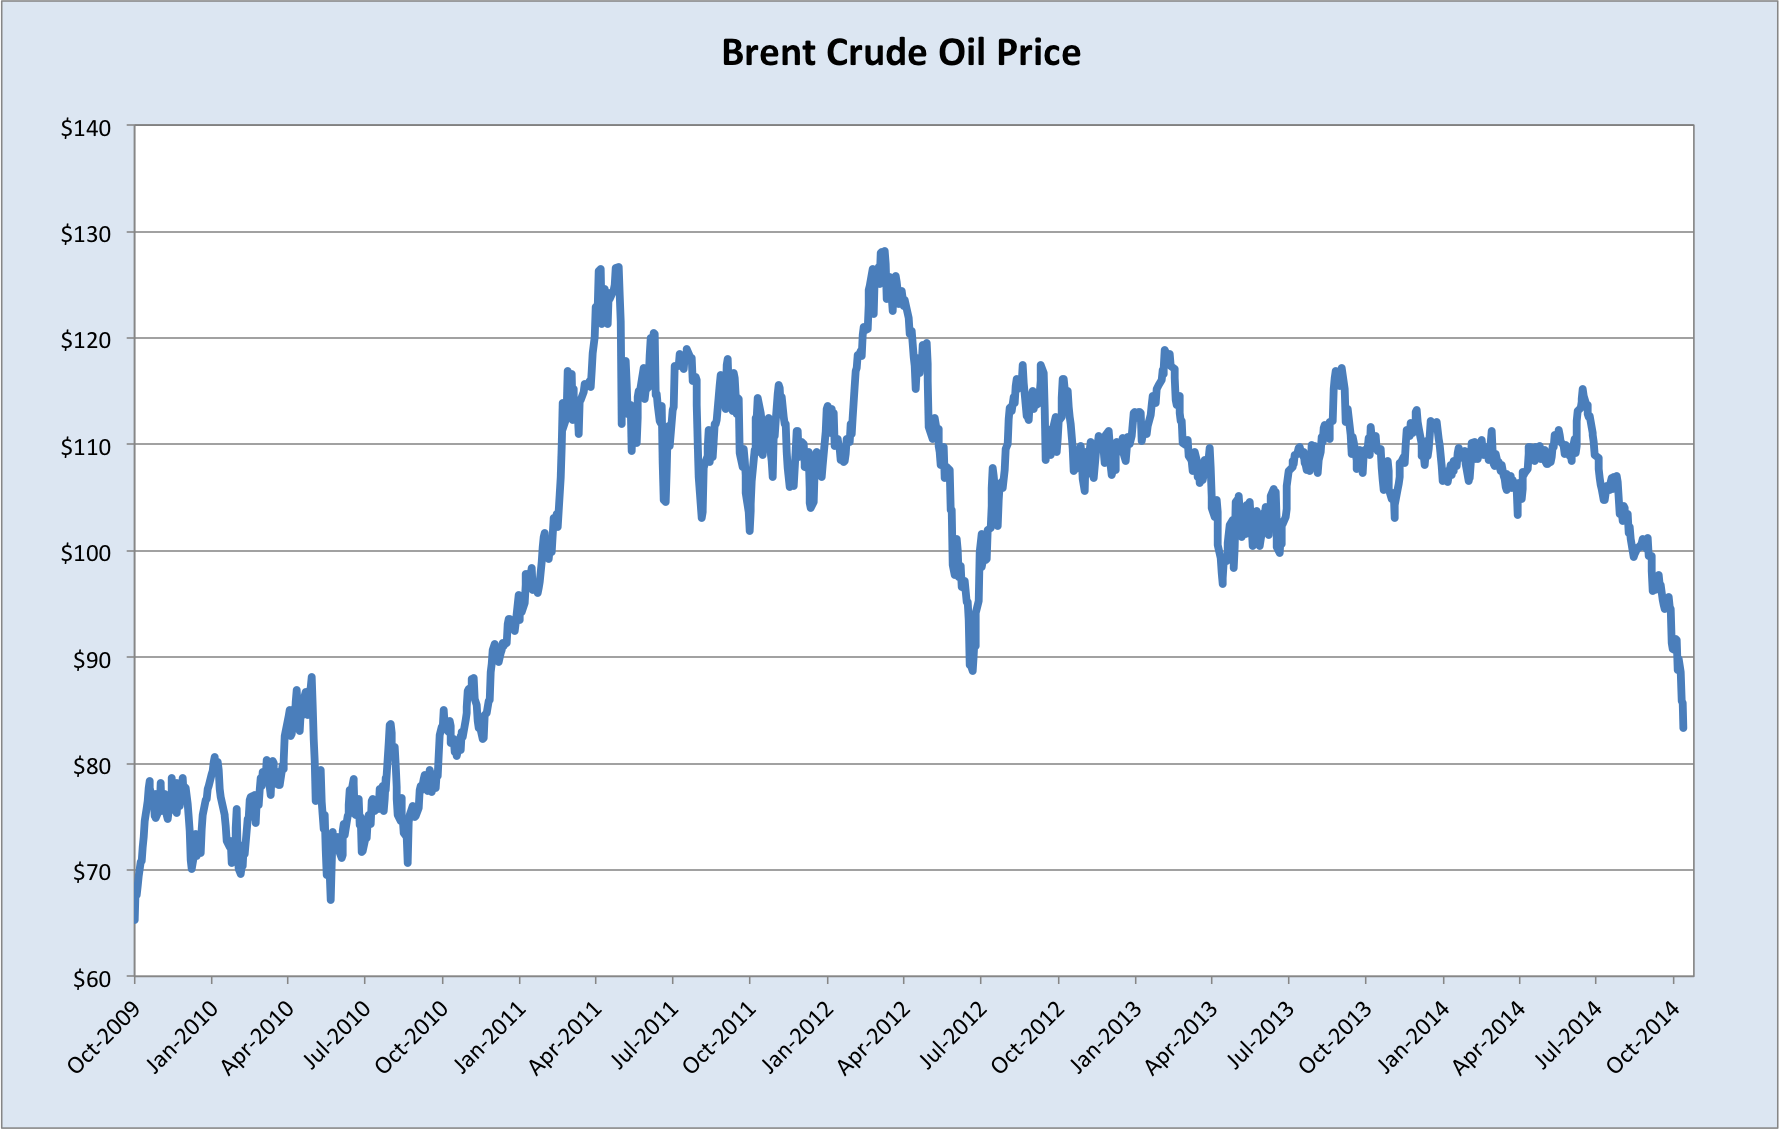
Commodity prices have seen further deterioration in the last couple of months. Iron ore and coal contribute approximately 35% of Australia’s export revenues. LNG contributes much less at present but its share is set to jump enormously over the next few years.

Screen Shot 2014-10-20 at 1.21.07 pm

Screen Shot 2014-10-20 at 1.21.52 pm

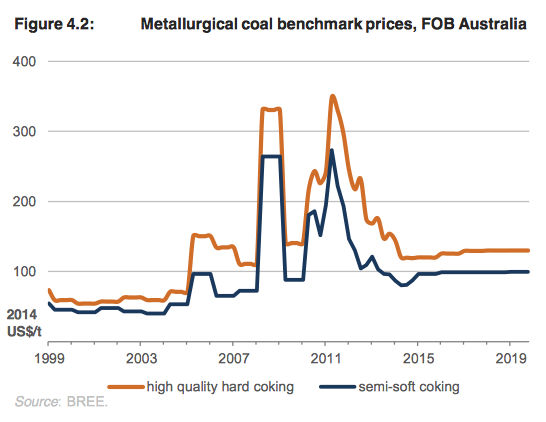
As reported in the Australian, there was some hope of a rebound in coking coal recently.

Like iron ore and thermal coal, prices for coking coal — Australia’s second-biggest mineral export earner — have been hard hit this year, falling by 24 per to $US113.50 a tonne on a spot basis.

But the call has gone out that prices have bottomed and are set to bounce back to between $US130 and $US150 a tonne in the near term, and $US170 a tonne in the longer term.

Unfortunately, this optimism was short-lived, from Bloomberg:

The quarterly benchmark price for metallurgical coal dropped to a six-year low, according to Doyle Trading Consultants LLC, amid a slowdown in Chinese demand for the steelmaking ingredient.

Australian coal producers and Japanese steel mills agreed to a fourth-quarter price of $119 a metric ton, down a dollar from the third quarter, Grand Junction, Colorado-based Doyle Trading said in a report yesterday.

Chinese imports in August were 39 percent lower than a year earlier, according to customs data, amid a glut of domestic steel. Iron ore demand is also suffering, with prices at a five-year low.

May I say, the idea that coking coal is going back to $170 is fanciful for the foreseeable future. Not even the BREE expects this, despite its unimpeachable record of overestimating future commodity prices.

Screen Shot 2014-10-20 at 2.07.53 pm

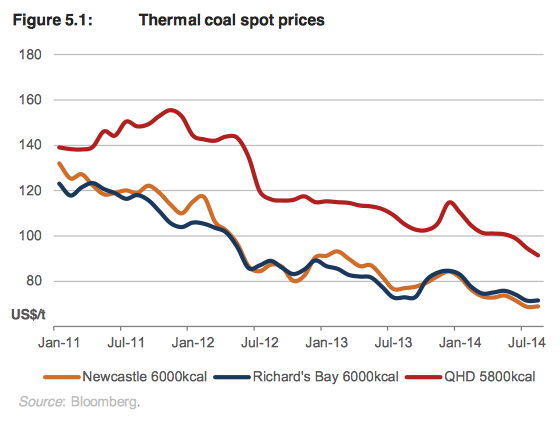
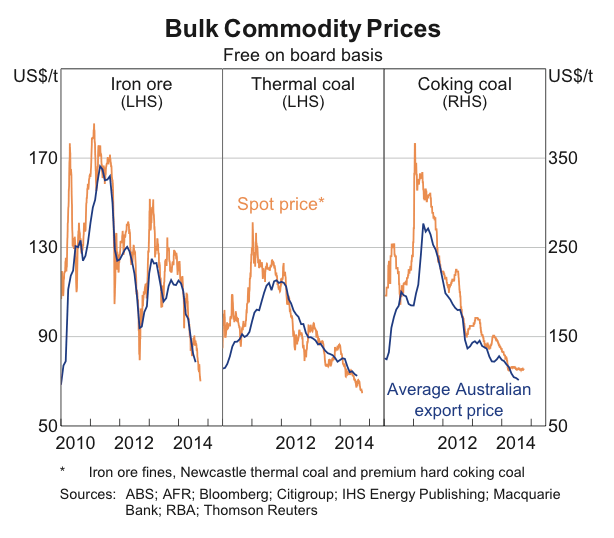
Likewise, thermal coal offers little cause for cheer, squeezed by continued (though reduced) oversupply globally and the shale boom in the US (which has seen gas displace coal as a power source).

Screen Shot 2014-10-20 at 2.18.35 pm

From the BREE:

Coal prices are forecast to remain subdued throughout the remainder of 2014 in response to weaker import demand from China and a continued abundance of supply. At lower spot prices many producers are unprofitable, which is expected to support further cost-cutting measures and signals the risk of more mine closures or production curtailments over the remainder of the year.

While coal consumption is forecast to remain robust in 2015, particularly in the Asia-Pacific, the global supply overhang is expected to persist and contribute to continued softness in prices. Contract prices for JFY 2015 are forecast to decline by 6 per cent to settle at US$77 a tonne. From 2016, the market balance is expected to tighten as import demand continues to increase and lower prices during 2014–2015 reduce investment in new capacity and force less competitive operations to close. The contract price is projected to rise to US$86 a tonne (in 2014 dollar terms) by 2019.

Despite tougher times, coal isn’t going anywhere. Aggressive expansion plans are being tempered, but the industry will continue to make a significant contribution to Australia’s economic output and export earnings. Nevertheless, the days of coal serving up windfall profits and tax revenues are past.

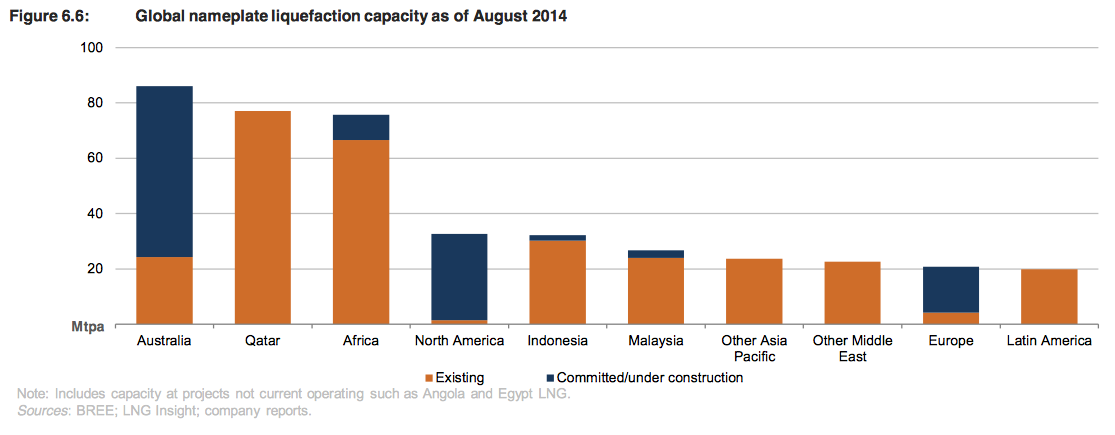
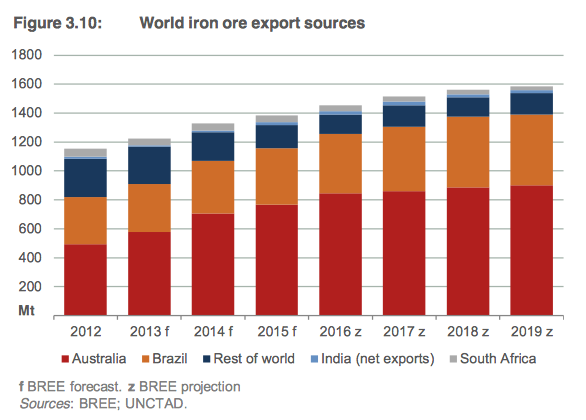
As you can see from the chart below, Australia’s exports of LNG are set to skyrocket over the next couple of years, making Australia the world’s largest supplier.

Screen Shot 2014-10-20 at 2.36.47 pm

This will improve Australia’s trade balance and therefore boost headline GDP, however we’re unlikely to see the kind of boom in corporate profits that characterised the iron ore and (to a lesser degree) coal booms over the past decade. I have written about LNG here. Since the impact on domestic demand will be minor once the surge in exports begins, and may even be negative as local gas price leap and construction workers are laid off, LNG offers little in the way of upward pressure on Australian interest rates.

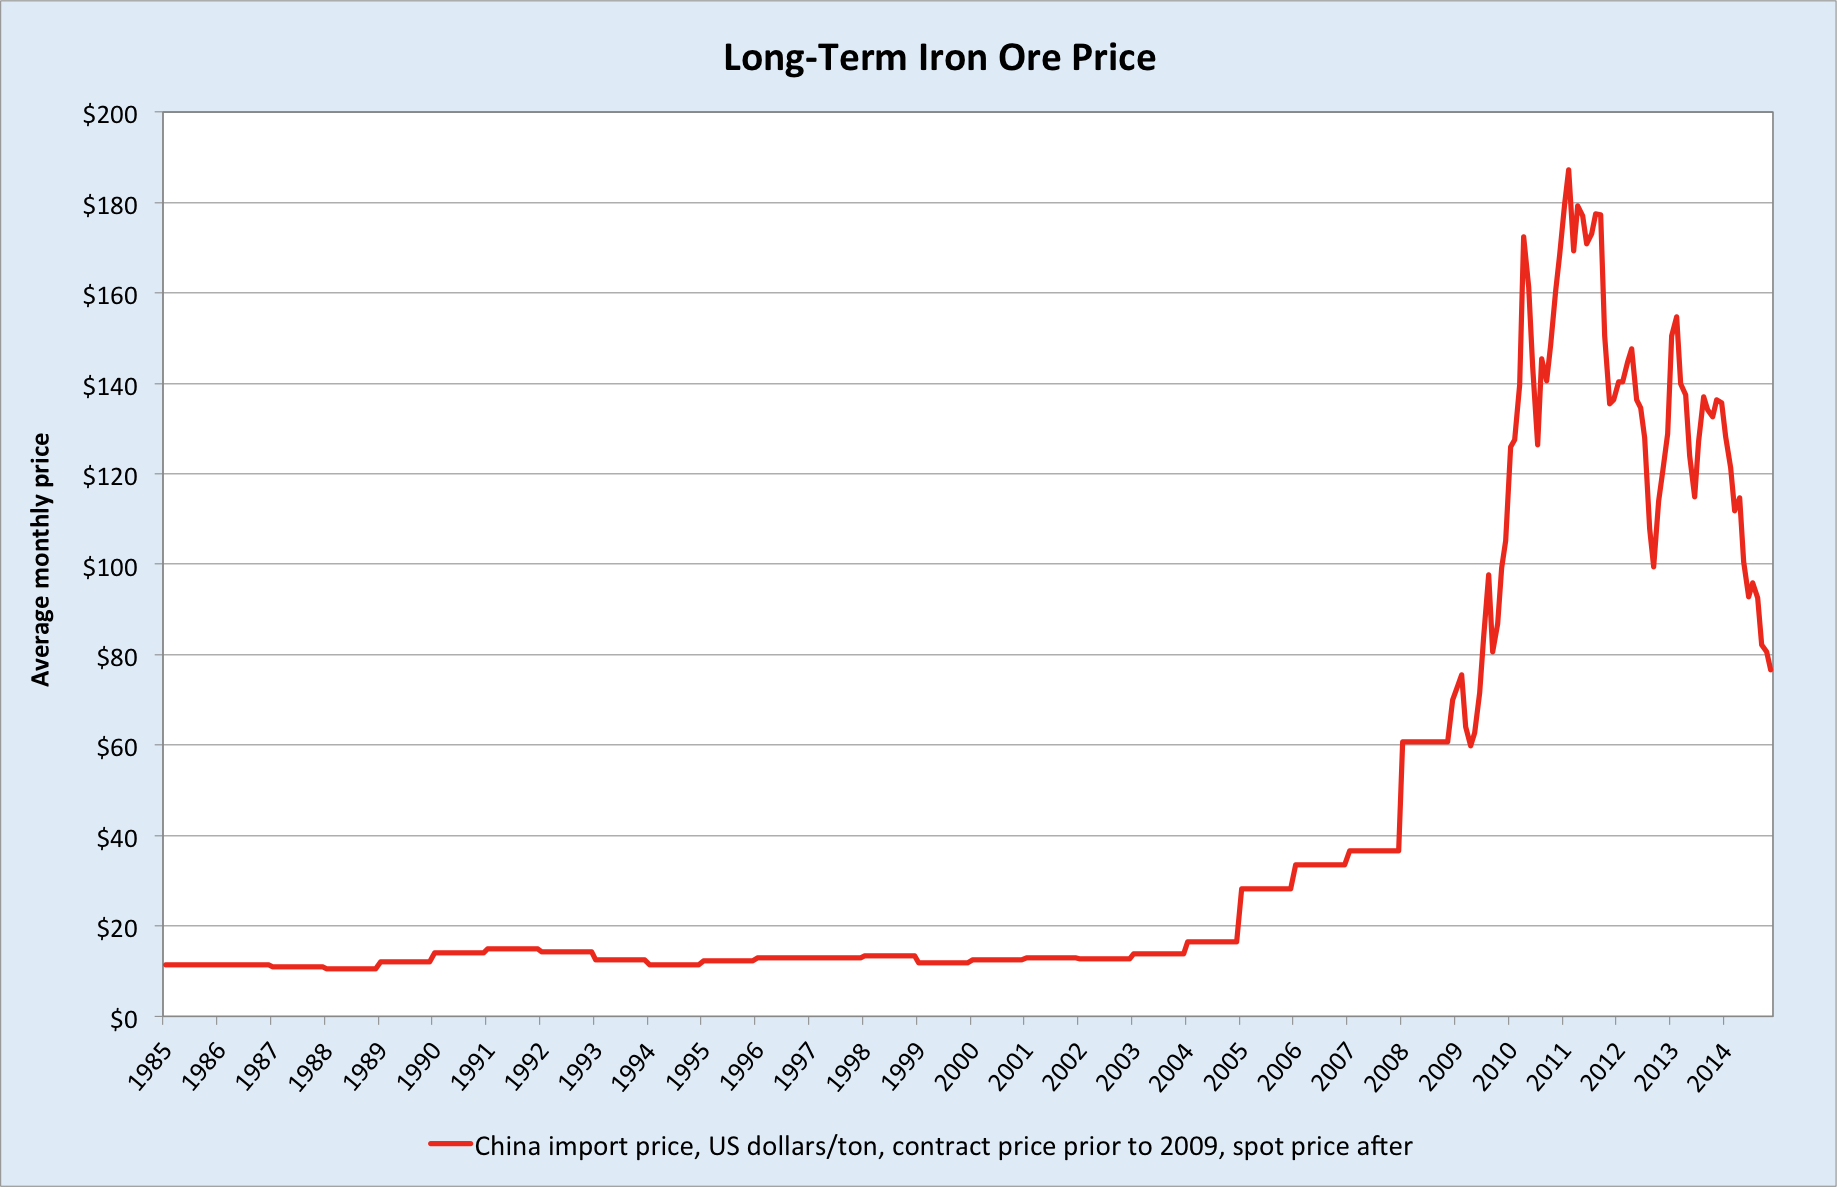
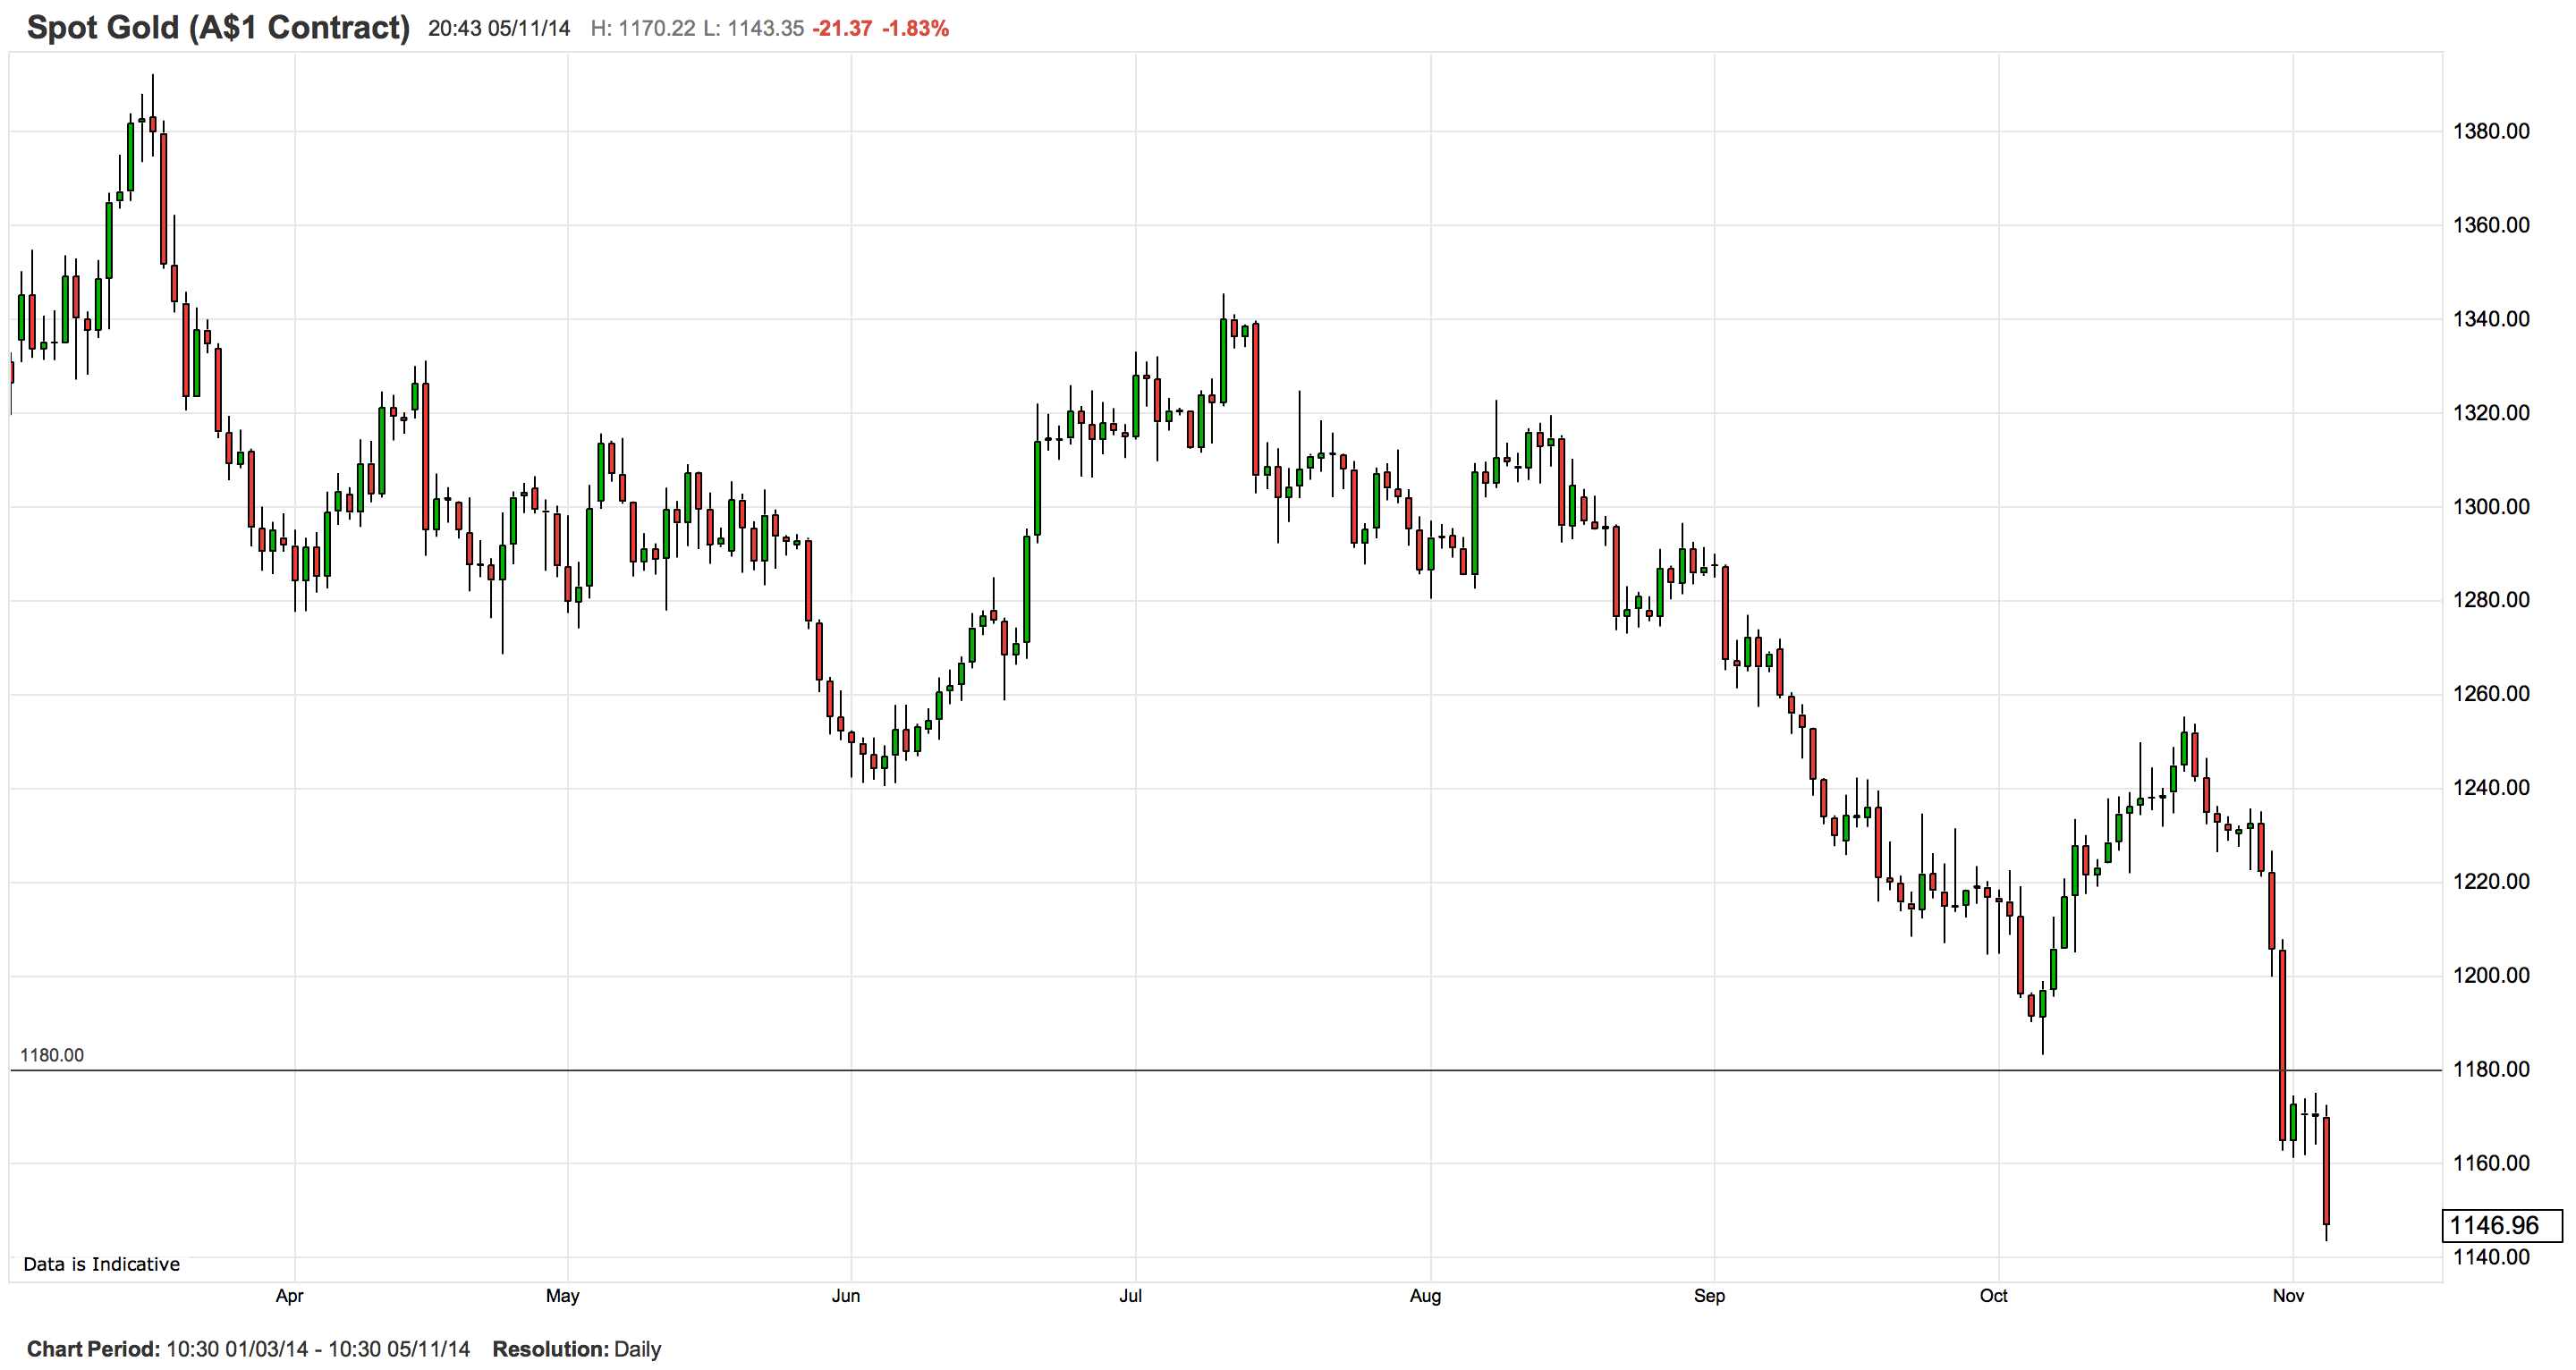
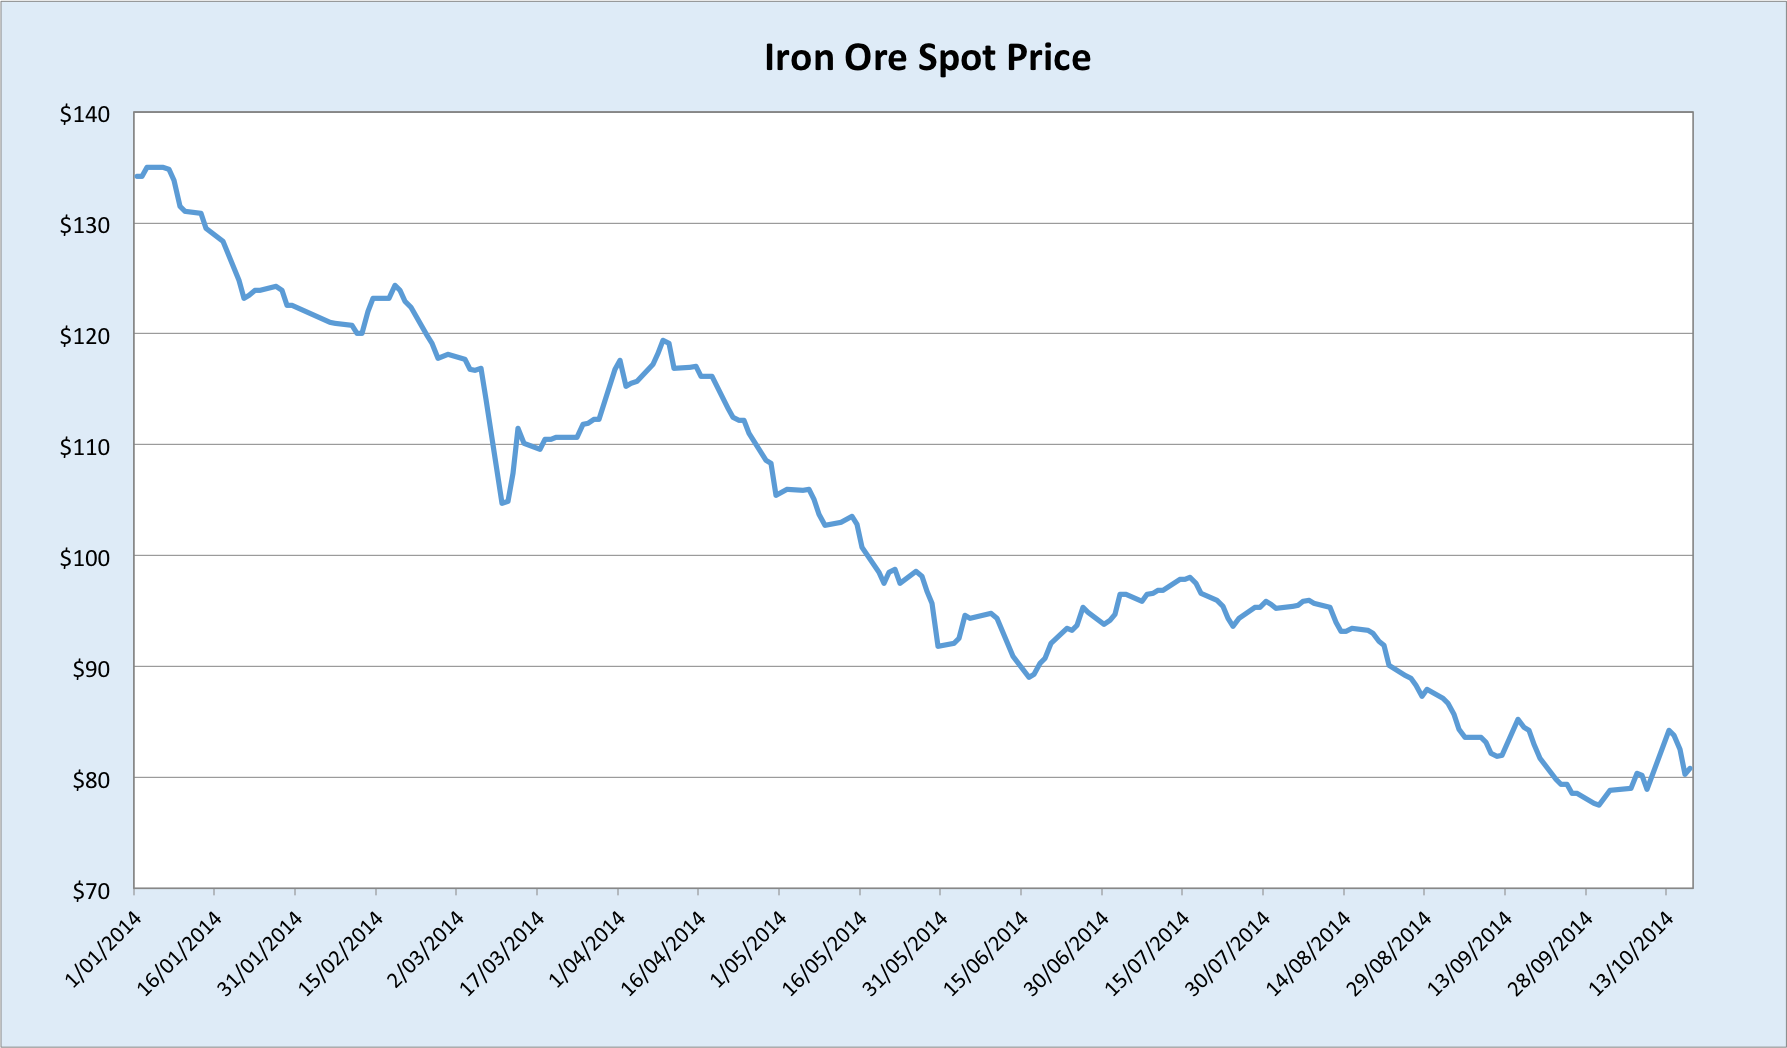
With the glory days of coal long since past, the burden shifted to iron ore to keep the party alive. Sadly, as you can see from the RBA’s chart, iron ore has had a particularly rough ride in 2014. Here is my own year-to-date chart:

iron_ore_

This year’s decline is directly attributable to soaring supply from major producers, especially Australia.

Screen Shot 2014-10-20 at 6.22.01 pm

Screen Shot 2014-10-20 at 6.25.28 pm

Rising volumes are offsetting some of the squeeze on profits margins, but not enough to prevent a big hit to the economy if prices remain at or near current levels.

Recently I noted that the worst may well have passed for the iron ore miners in 2014. Spot found legs for a solid bounce after that, however as you can see it didn’t manage to hold its gains. Still, buying returned at the end of last week around the $80 level, and it looks unlikely we’ll see falls much below this for the remainder of the year, owing to much improved profitability amongst Chinese steel mills, a thawing of credit conditions in China and some degree of seasonal inventory restock into the year’s end. However, without a fundamental shift in Chinese policy settings, the bounce will be short and soft relative to past years. And with no sign of a let up in the pace of supply expansions from the majors, further declines in iron ore next year are virtually baked in.

China

It should be no secret by now that China faces an immediate choice between slower, sustainable growth that is much more biased towards domestic consumption in place of investment, or faster growth that’s increasingly unstable and ultimately unsustainable. The government is more than aware of this trade-off, and has largely opted to curtail the excesses of previous years (without being too aggressive). Should the government’s resolve waver in the face of a more serious downturn, then risks would increase of a ‘big bang’ stimulus that could temporarily elevate demand for raw materials and most likely provide a sufficient boost to Australia to see rates rise, also temporarily, as cyclical influences take precedence.

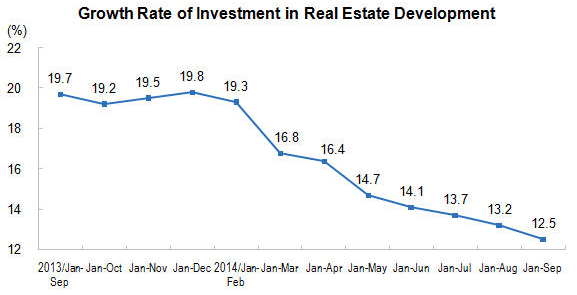
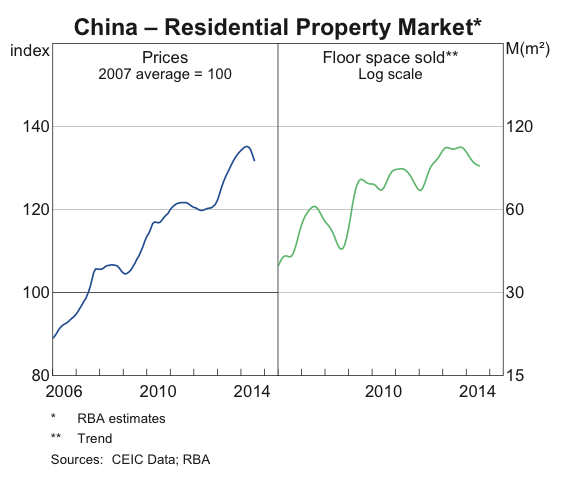
China has witnessed a noticeable slowdown in the property sector this year, which has weighed on growth.

Screen Shot 2014-10-20 at 4.50.42 pm

Along with the usual monthly data indictors, we received China’s national account data this week. As you can see, the growth rate of real estate investment continues to slide.

Screen Shot 2014-10-22 at 12.34.47 pm

This is dragging down fixed asset investment generally, which is by far the most important form of spending for Australia’s economy.

Screen Shot 2014-10-22 at 1.16.33 pm

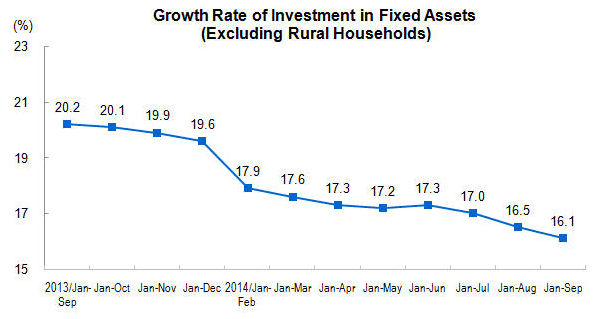
I only have data going back a decade, so all I can say is that this is the slowest pace over the period I can see. But I would be very surprised if this were not the slowest since the Asian Financial Crisis or earlier.

The property-related slowdown has been sharp, and so far as I can discern, only a jump in net exports has cushioned the blow to GDP growth (cynical observers may be less charitable). For a large part the slowdown is the result of policy restrictions on mortgage lending this year, among other measures. However, unlike the previous cooling in 2012, the property market now appears to be structurally oversupplied (and even more overvalued). Looser credit conditions could certainly mitigate the severity of price declines, but it would require a complete abandonment of credit rationalisation to reignite the boom, which the government has long been reluctant to do.

Thus it was to much fanfare that the government eased restrictions on mortgages late last month. This is apparently already lifting activity in tier 1 cities. Credit growth remained subdued in September, and this is going to be the key indicator going forward determining whether the looser policy stance translates to a meaningful resumption of price gains and investment activity. I don’t think we’ll see this, but I wouldn’t be surprised to see the slowdown moderate, or mild gains in prices over the next 6 months. Nevertheless, I’m highly sceptical that this moderation, if it does manifest, will be enough to mop up excess steel supply, and even less so excess iron ore, implying more pain for the latter next year.

It appears that China’s rebalancing (which is a polite way of saying ‘slowing’) is continuing, albeit with the government easing its foot off the break a little. I still do not see a resumption in the kind of frenzied building that delivered Australia’s commodity bonanza and was extrapolated far out to justify surging investment in capacity (and still is). With another wall of iron ore supply careering towards markets next year, policy shifts from China have not yet been substantive enough to change my view on Australian interest rates.
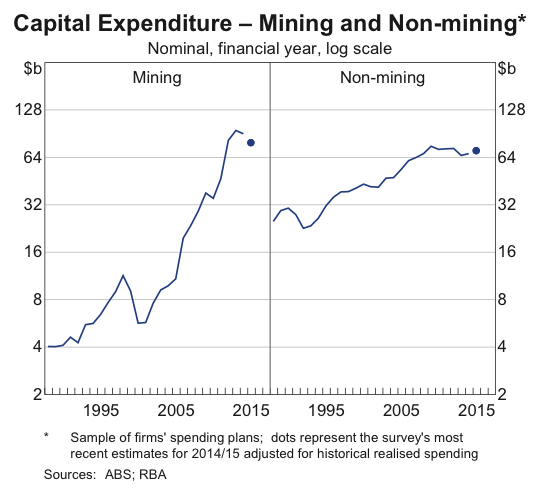
Investment

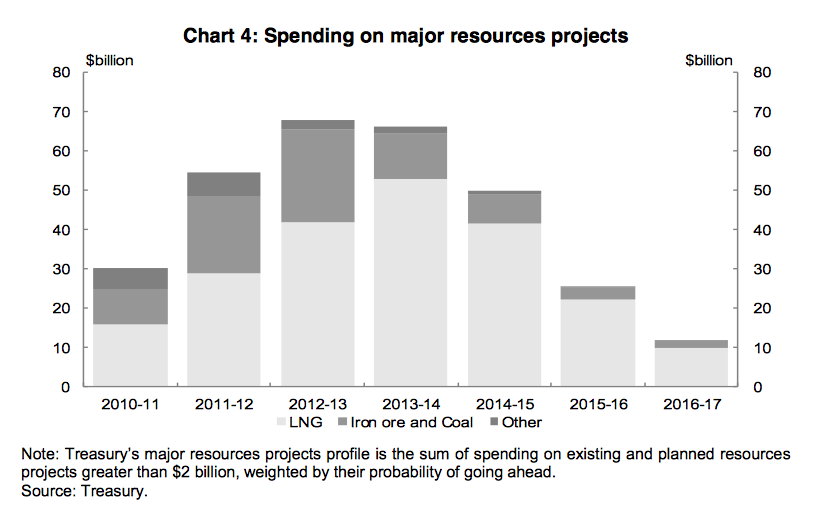
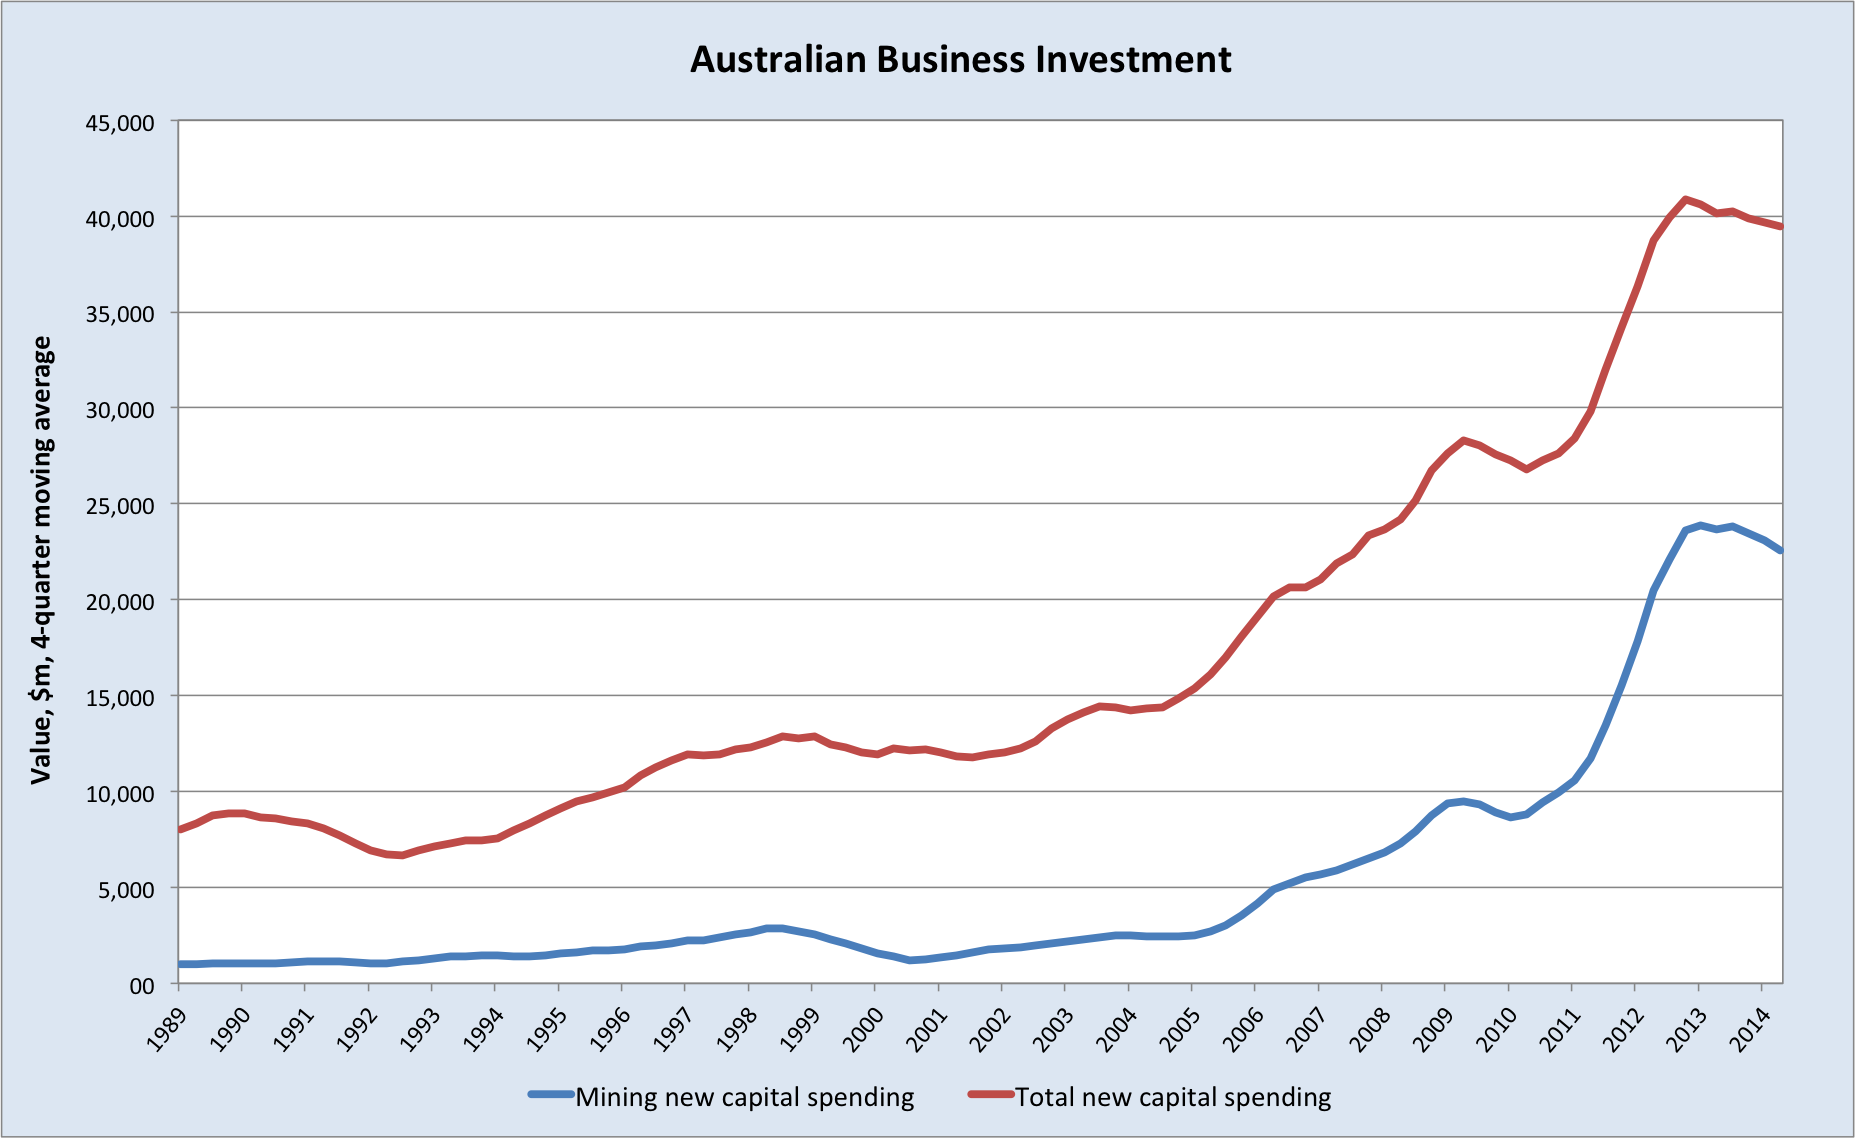
Not much to report here since my post on engineering construction work a couple of weeks ago. The outlook remains soft as LNG mega-projects wind down.

A couple of charts from the RBA help paint the picture.

Screen Shot 2014-10-20 at 7.06.24 pm

Screen Shot 2014-10-20 at 7.26.27 pm

Mining investment is set to decline sharply over the next two years, and non-mining business investment will need to be revived to mitigate this. To do so, the AUD will almost certainly need to come down markedly. In the absence of this, business investment is going to be a big drag on the economy and will argue in favour of lower rates.

Public Finances 

The federal government handed down a tough budget in May in a bid shore up public finances. Partly owing to this effort, the deficit is expected to decline over the next few years.

Screen Shot 2014-10-20 at 7.27.56 pm

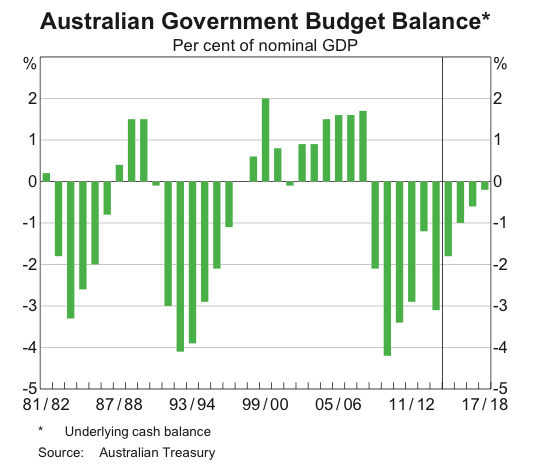
It is very hard to see this happening with iron ore where it is. The AUD is lower than was forecast, but this has not been enough to offset the larger-than-expected decline in the terms of trade. In addition, the government has had great difficulty getting its savings measures through the Senate. Do not be surprised if the mid-year economic and fiscal outlook (MYEFO) in December shows a marked deterioration compared with what the government had intended.

State balance sheets are also under pressure, and it’s only been the property booms in Sydney and Melbourne that have prevented much worse outcomes in NSW and Victoria this year. By their nature, the support from these booms will prove transitory.

Screen Shot 2014-10-22 at 1.47.07 pm

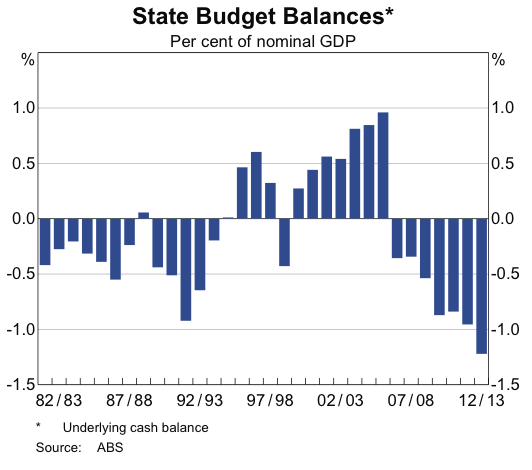
The pressure on public balance sheets will in turn keep the pressure on governments (both state and federal) to search for further savings, which households will not like. The outlook for the Australia’s fiscal settings therefore offers scope for further monetary easing.

Housing 

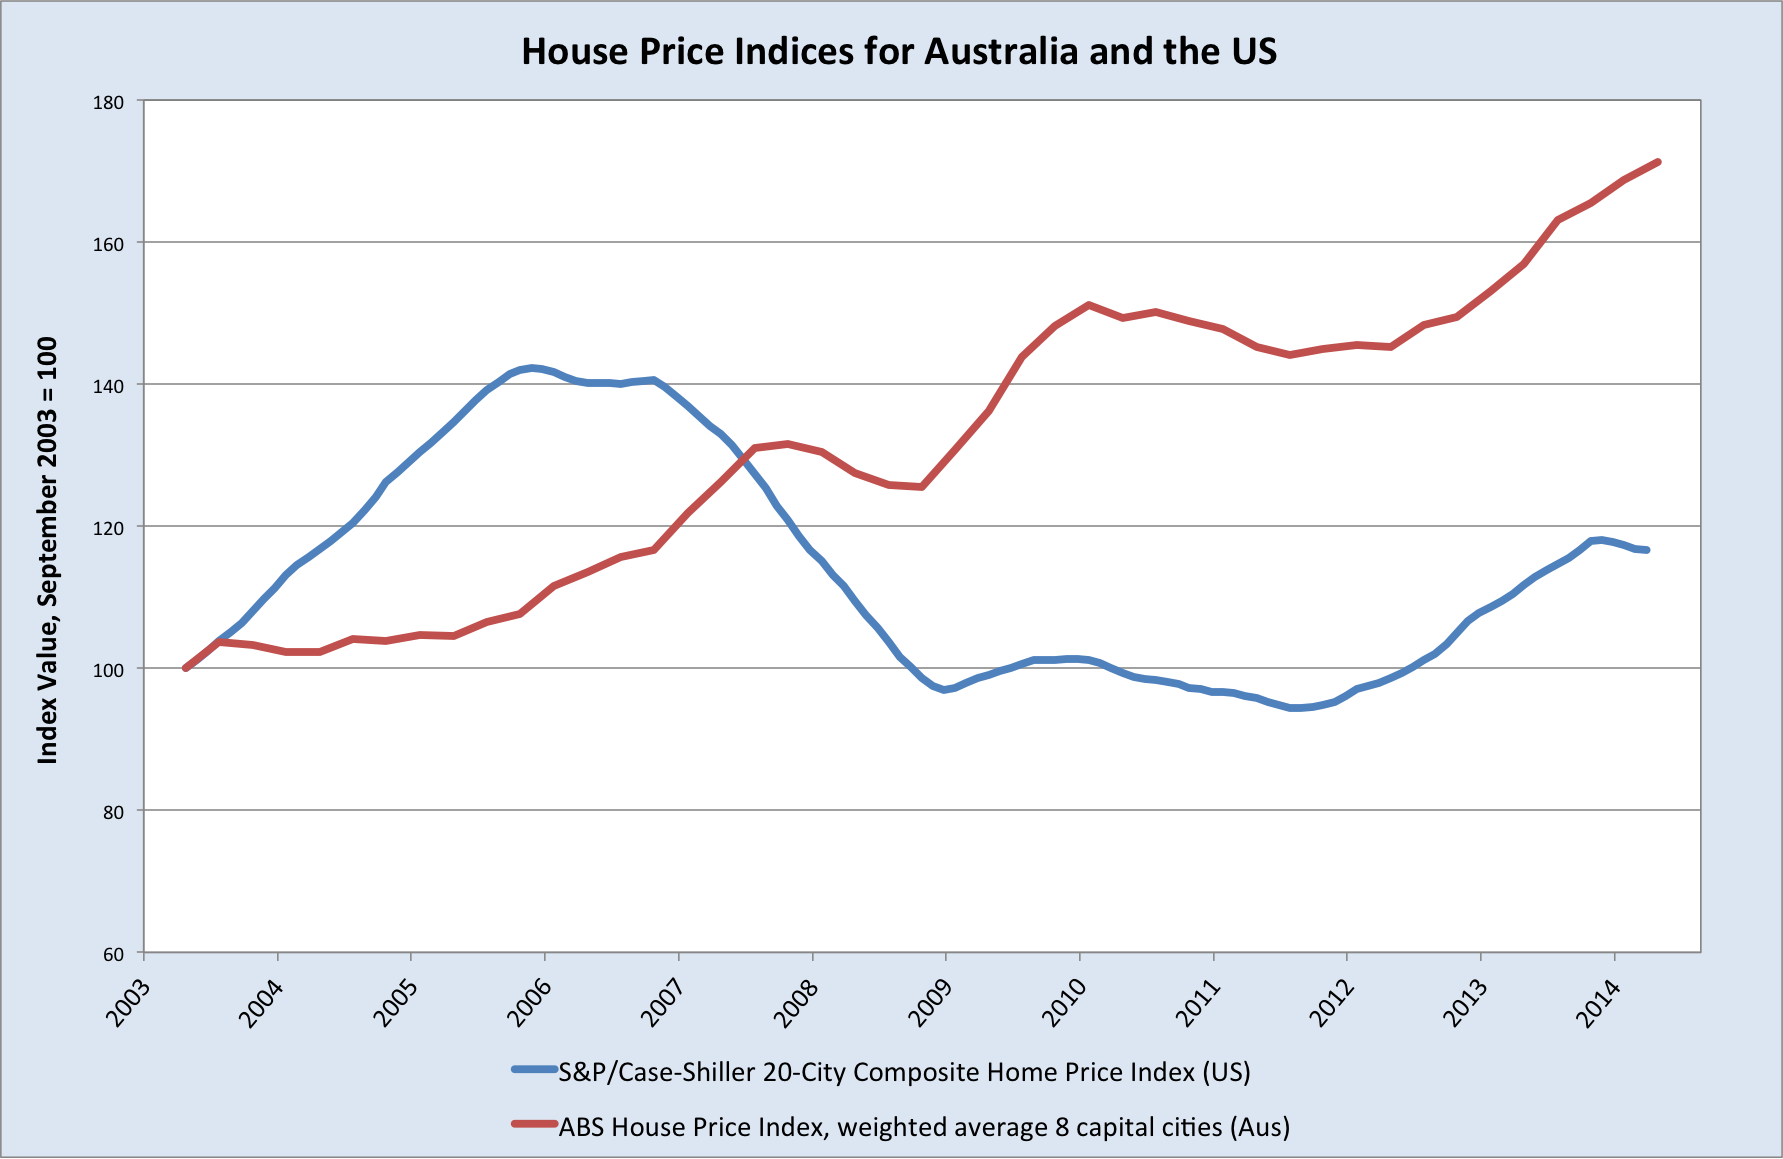
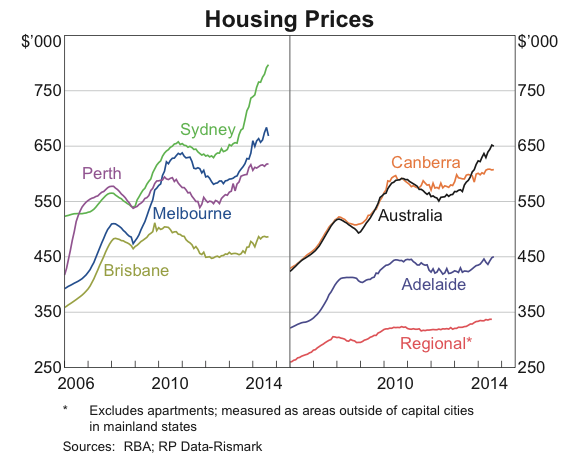
The housing sector remains robust, with no let up in prices over the past month.

houseprices

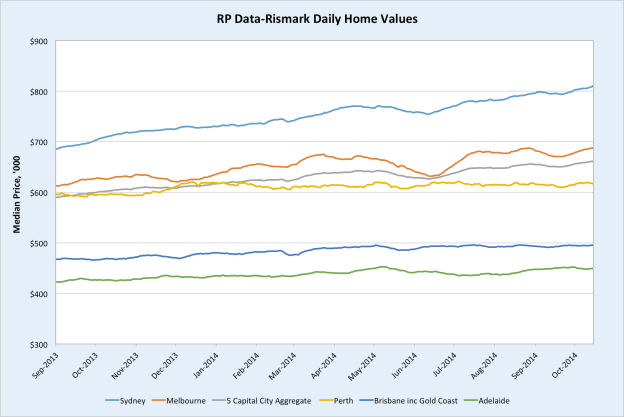
And for a longer term perspective:

Screen Shot 2014-10-20 at 8.19.19 pm

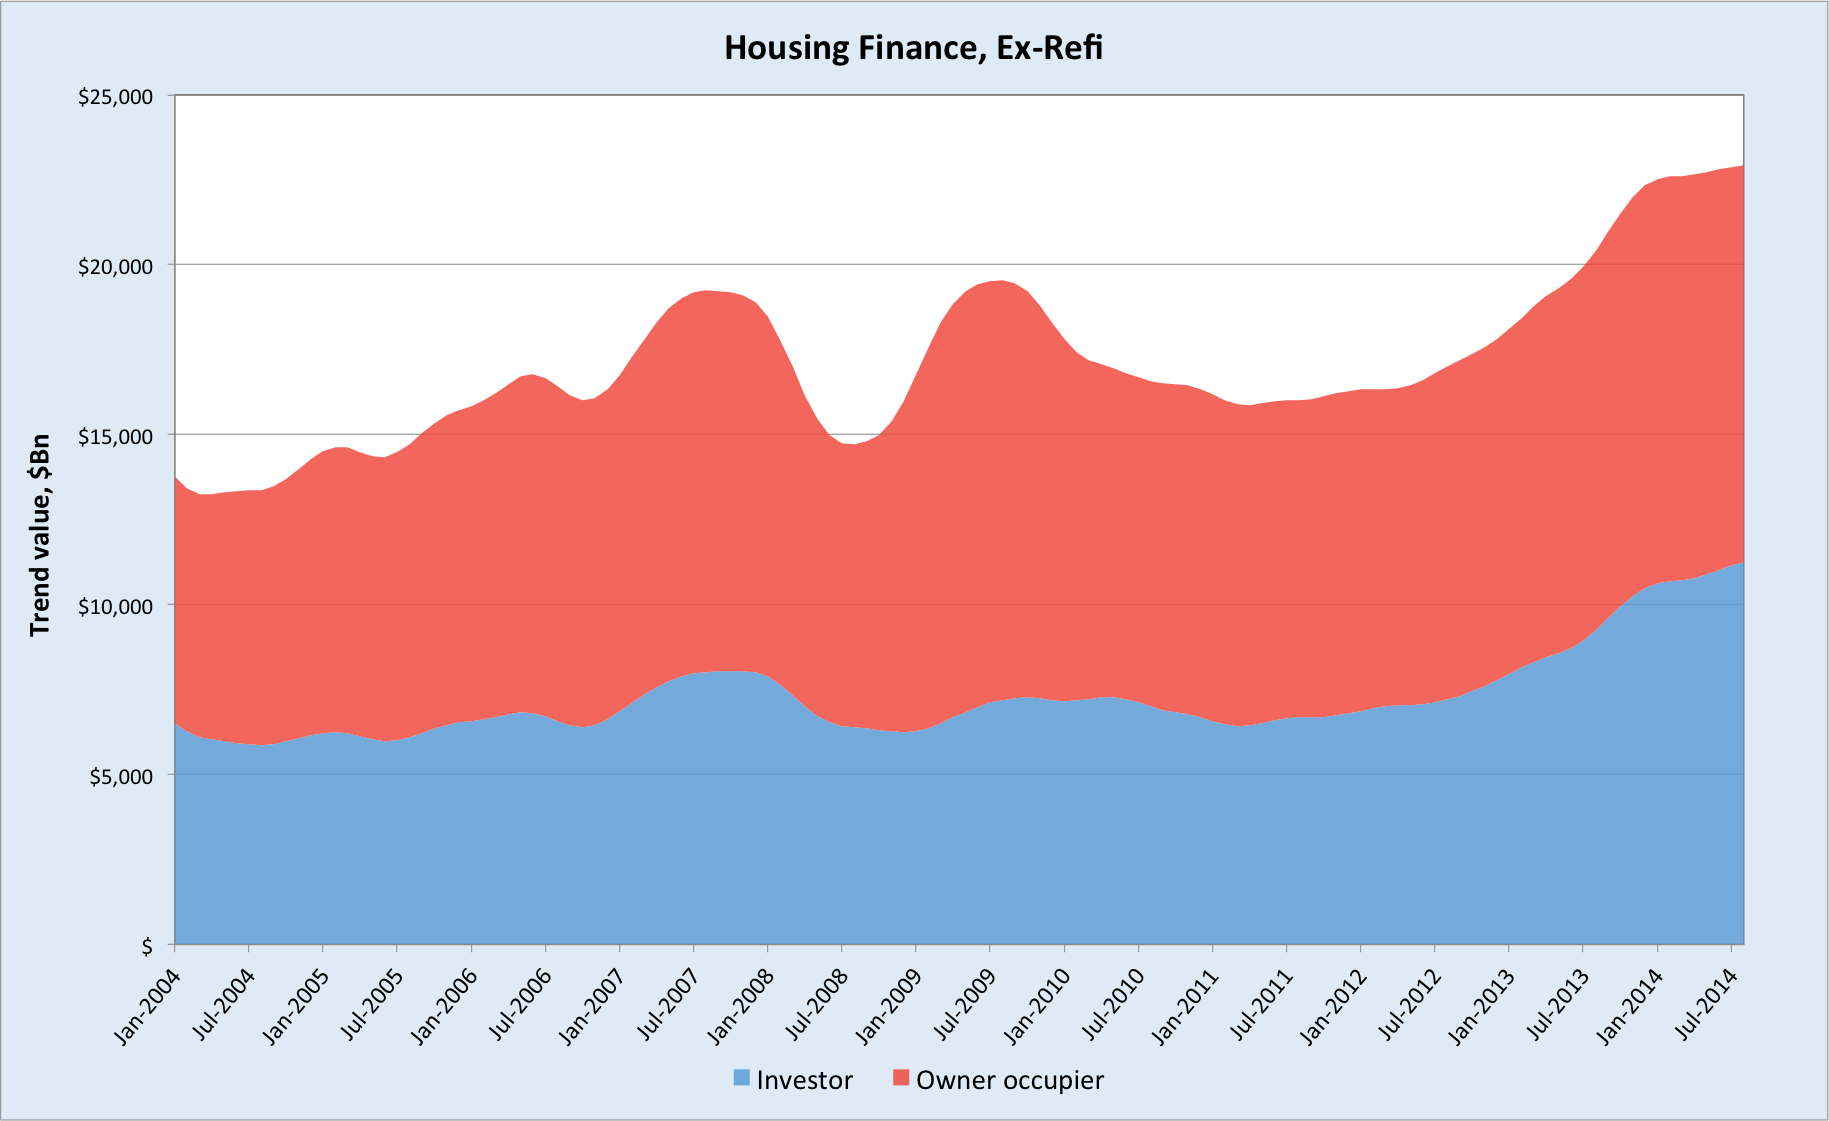
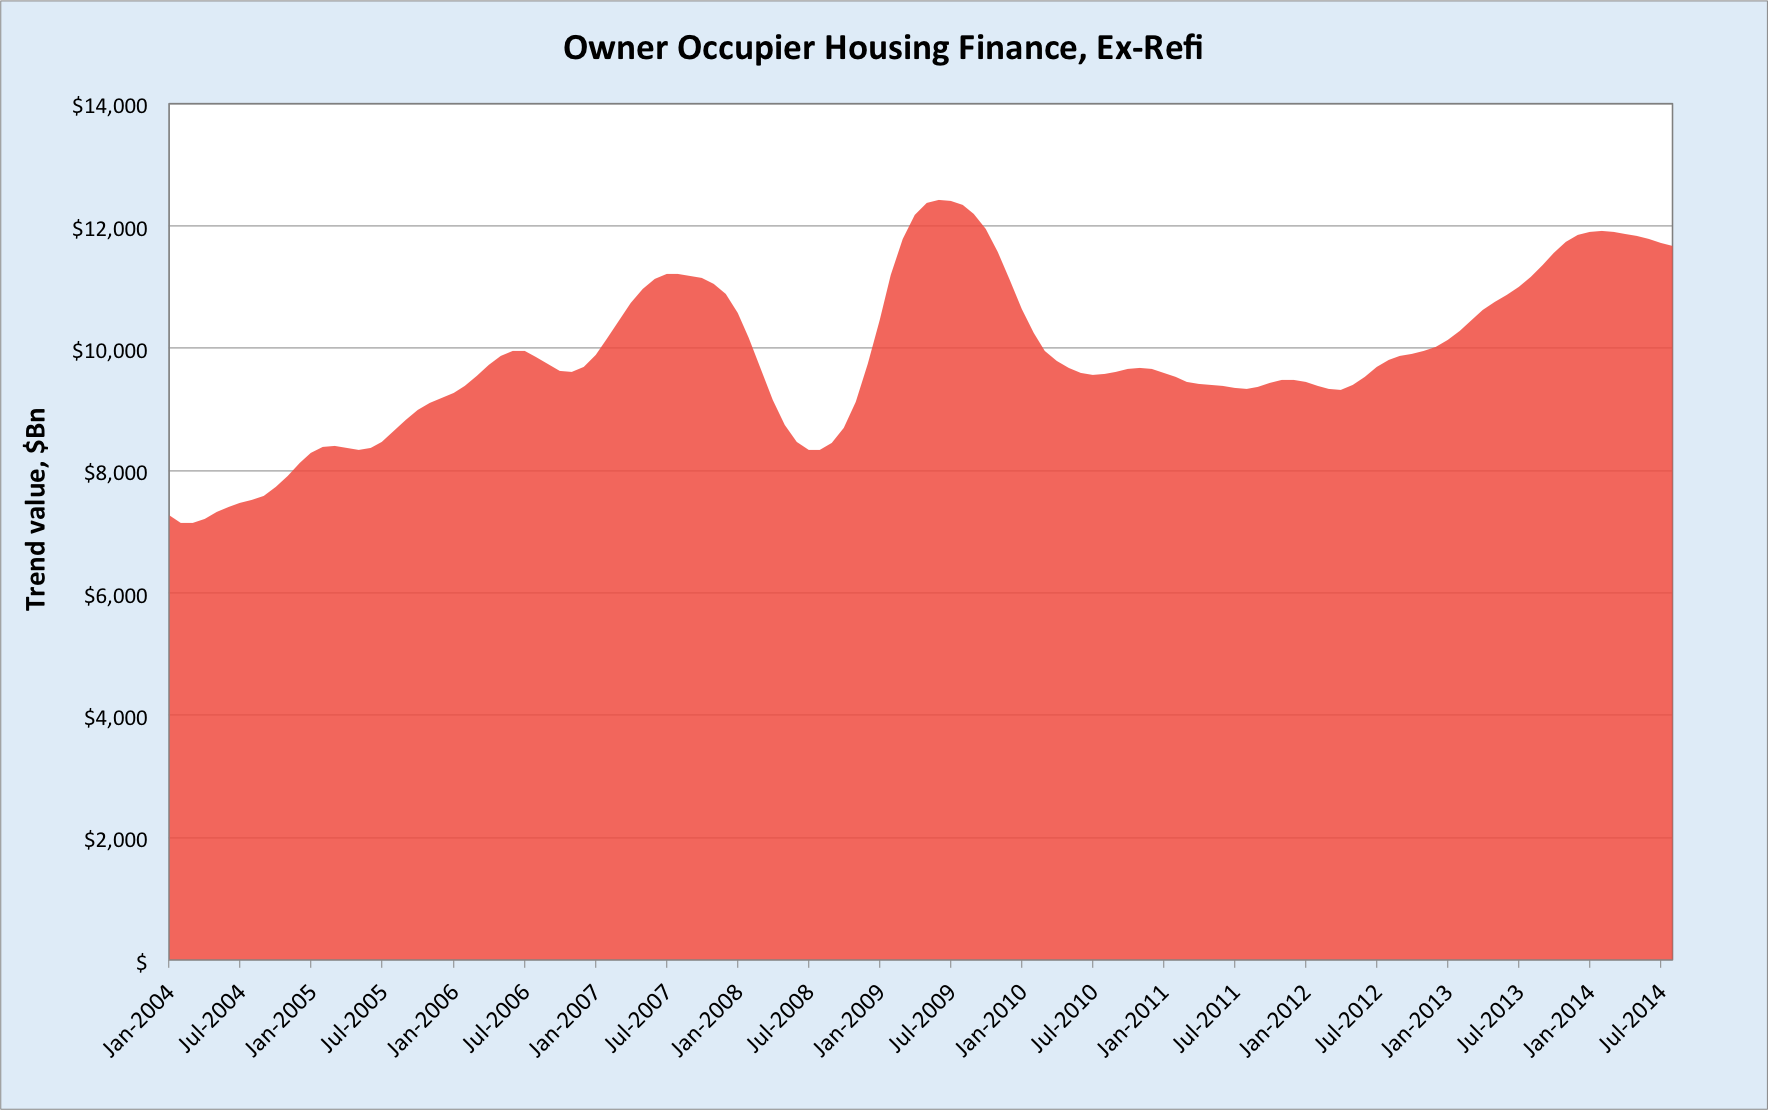
Naturally, this has been driven by surge in mortgage lending over the past 2-3 years.

housingfinance1

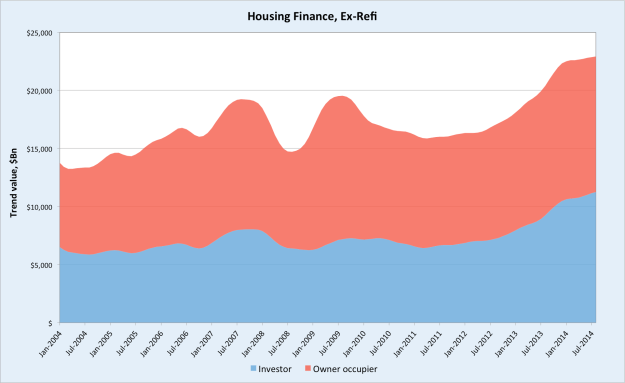
Notably, however, owner occupier lending has clearly flattened out this year, while remaining at an elevated level (the share going to first home buyers has collapsed).

hosuingfinance2

This has meant local investors and, to a degree we can’t fully ascertain, foreign ones, have become increasingly dominant in the Australian housing market, especially in Sydney and Melbourne.

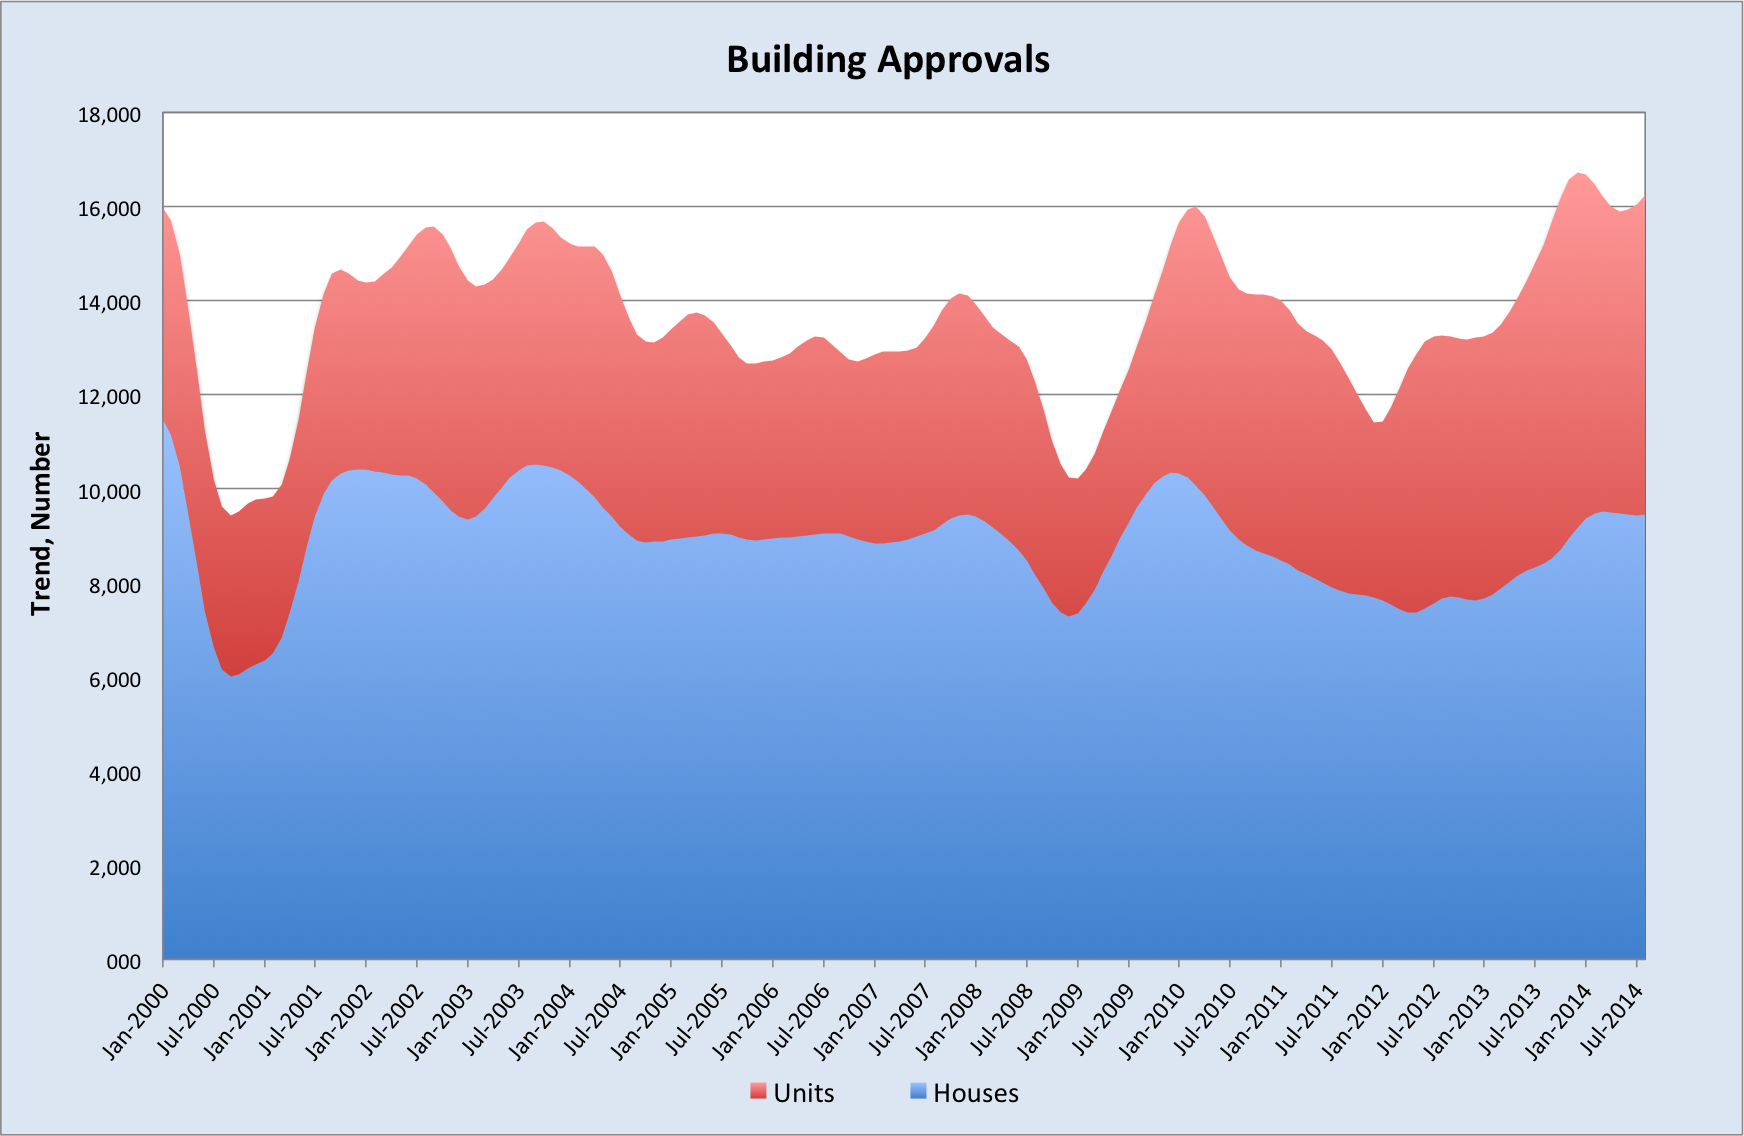
With strong prices in the capitals, dwelling construction is booming, at least relative to recent history. (It is true that Australia has long underinvested in housing, though not the extent that it can fully explain recent price gains.)

buildingapprovals

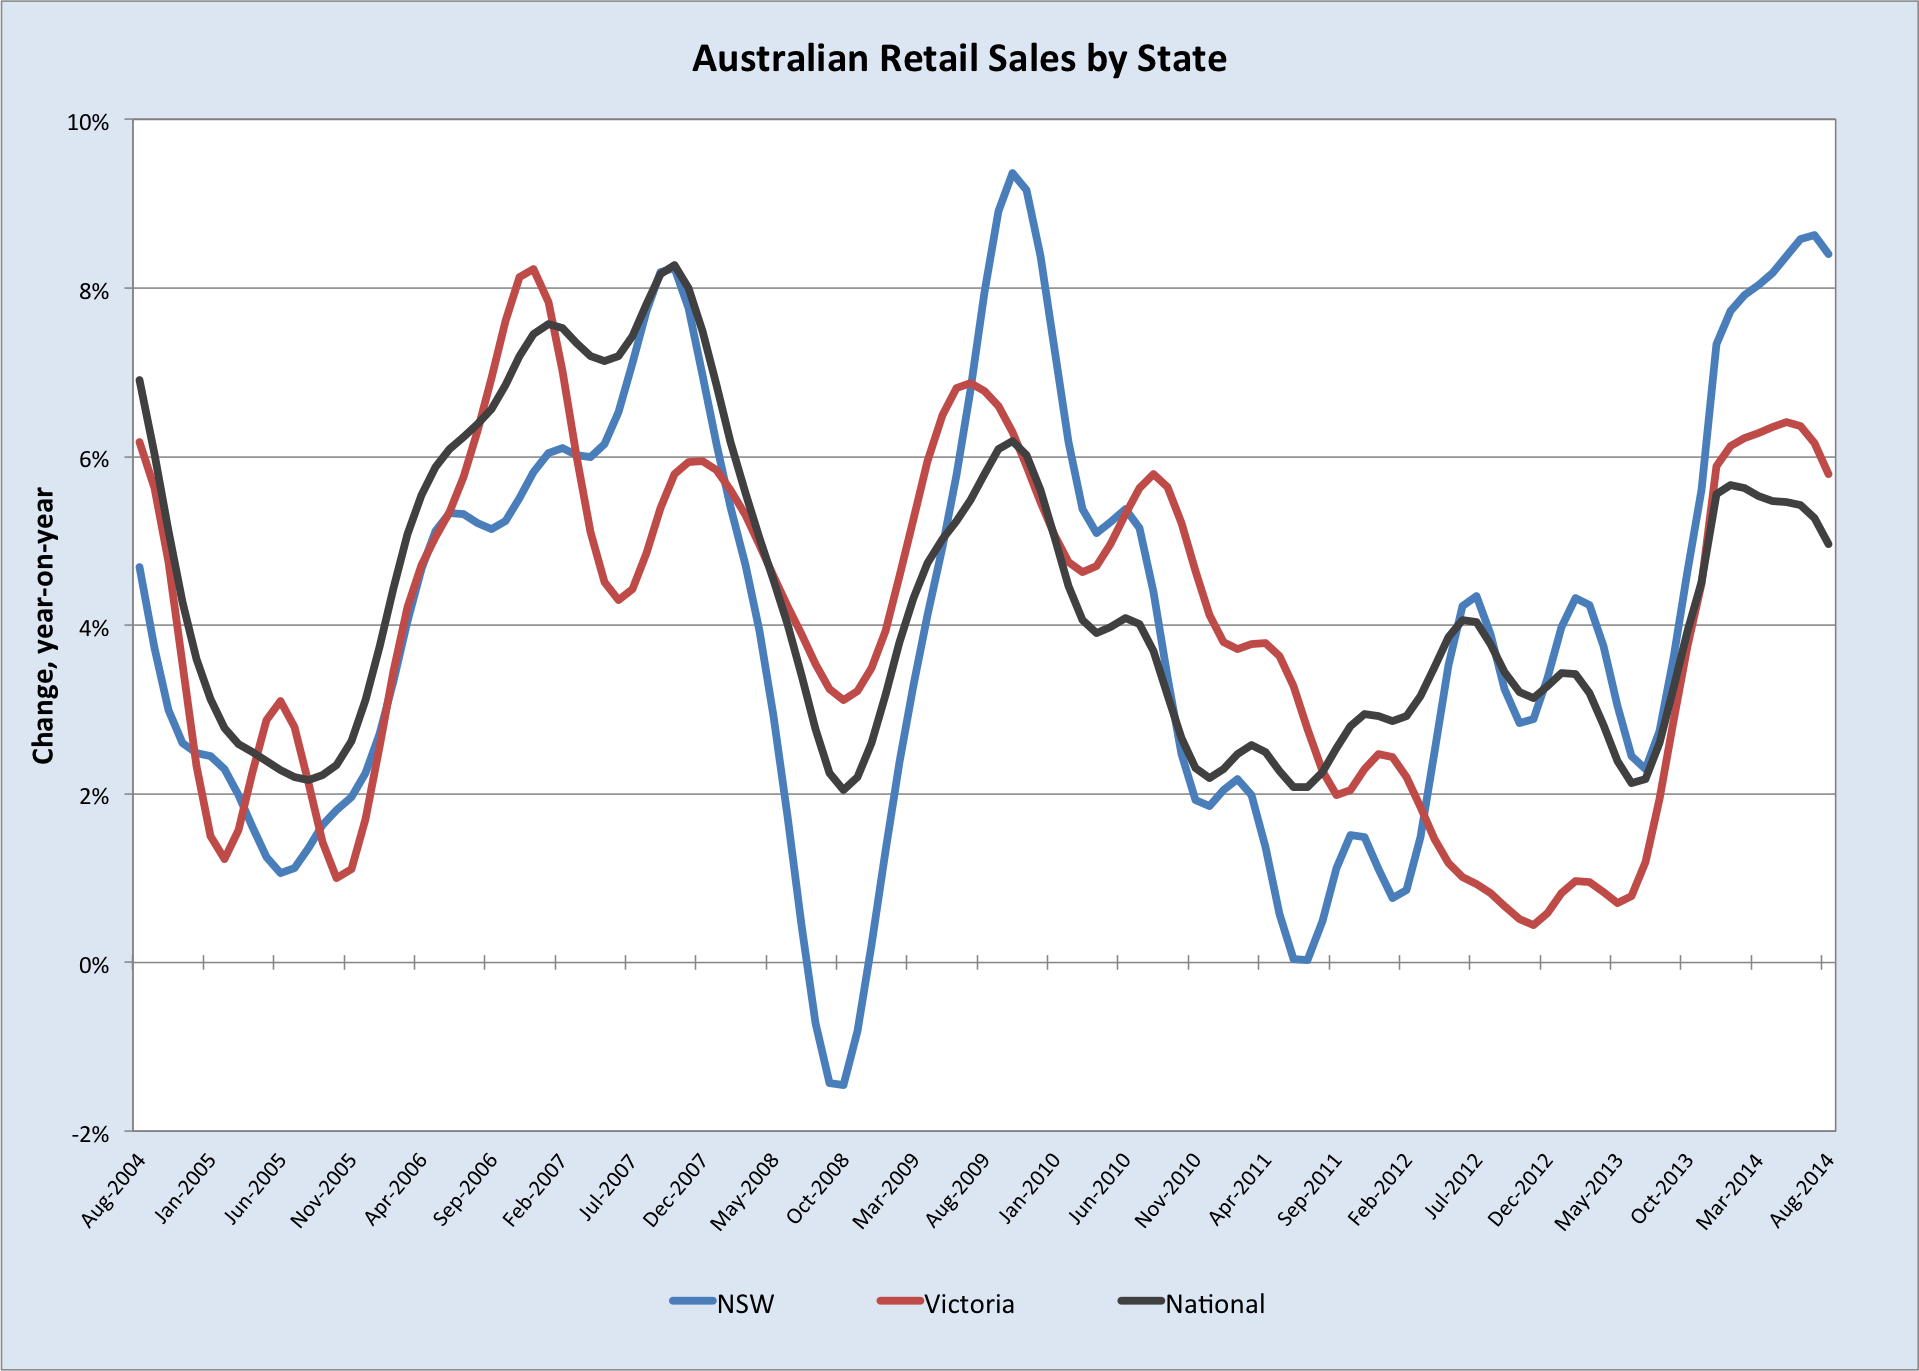
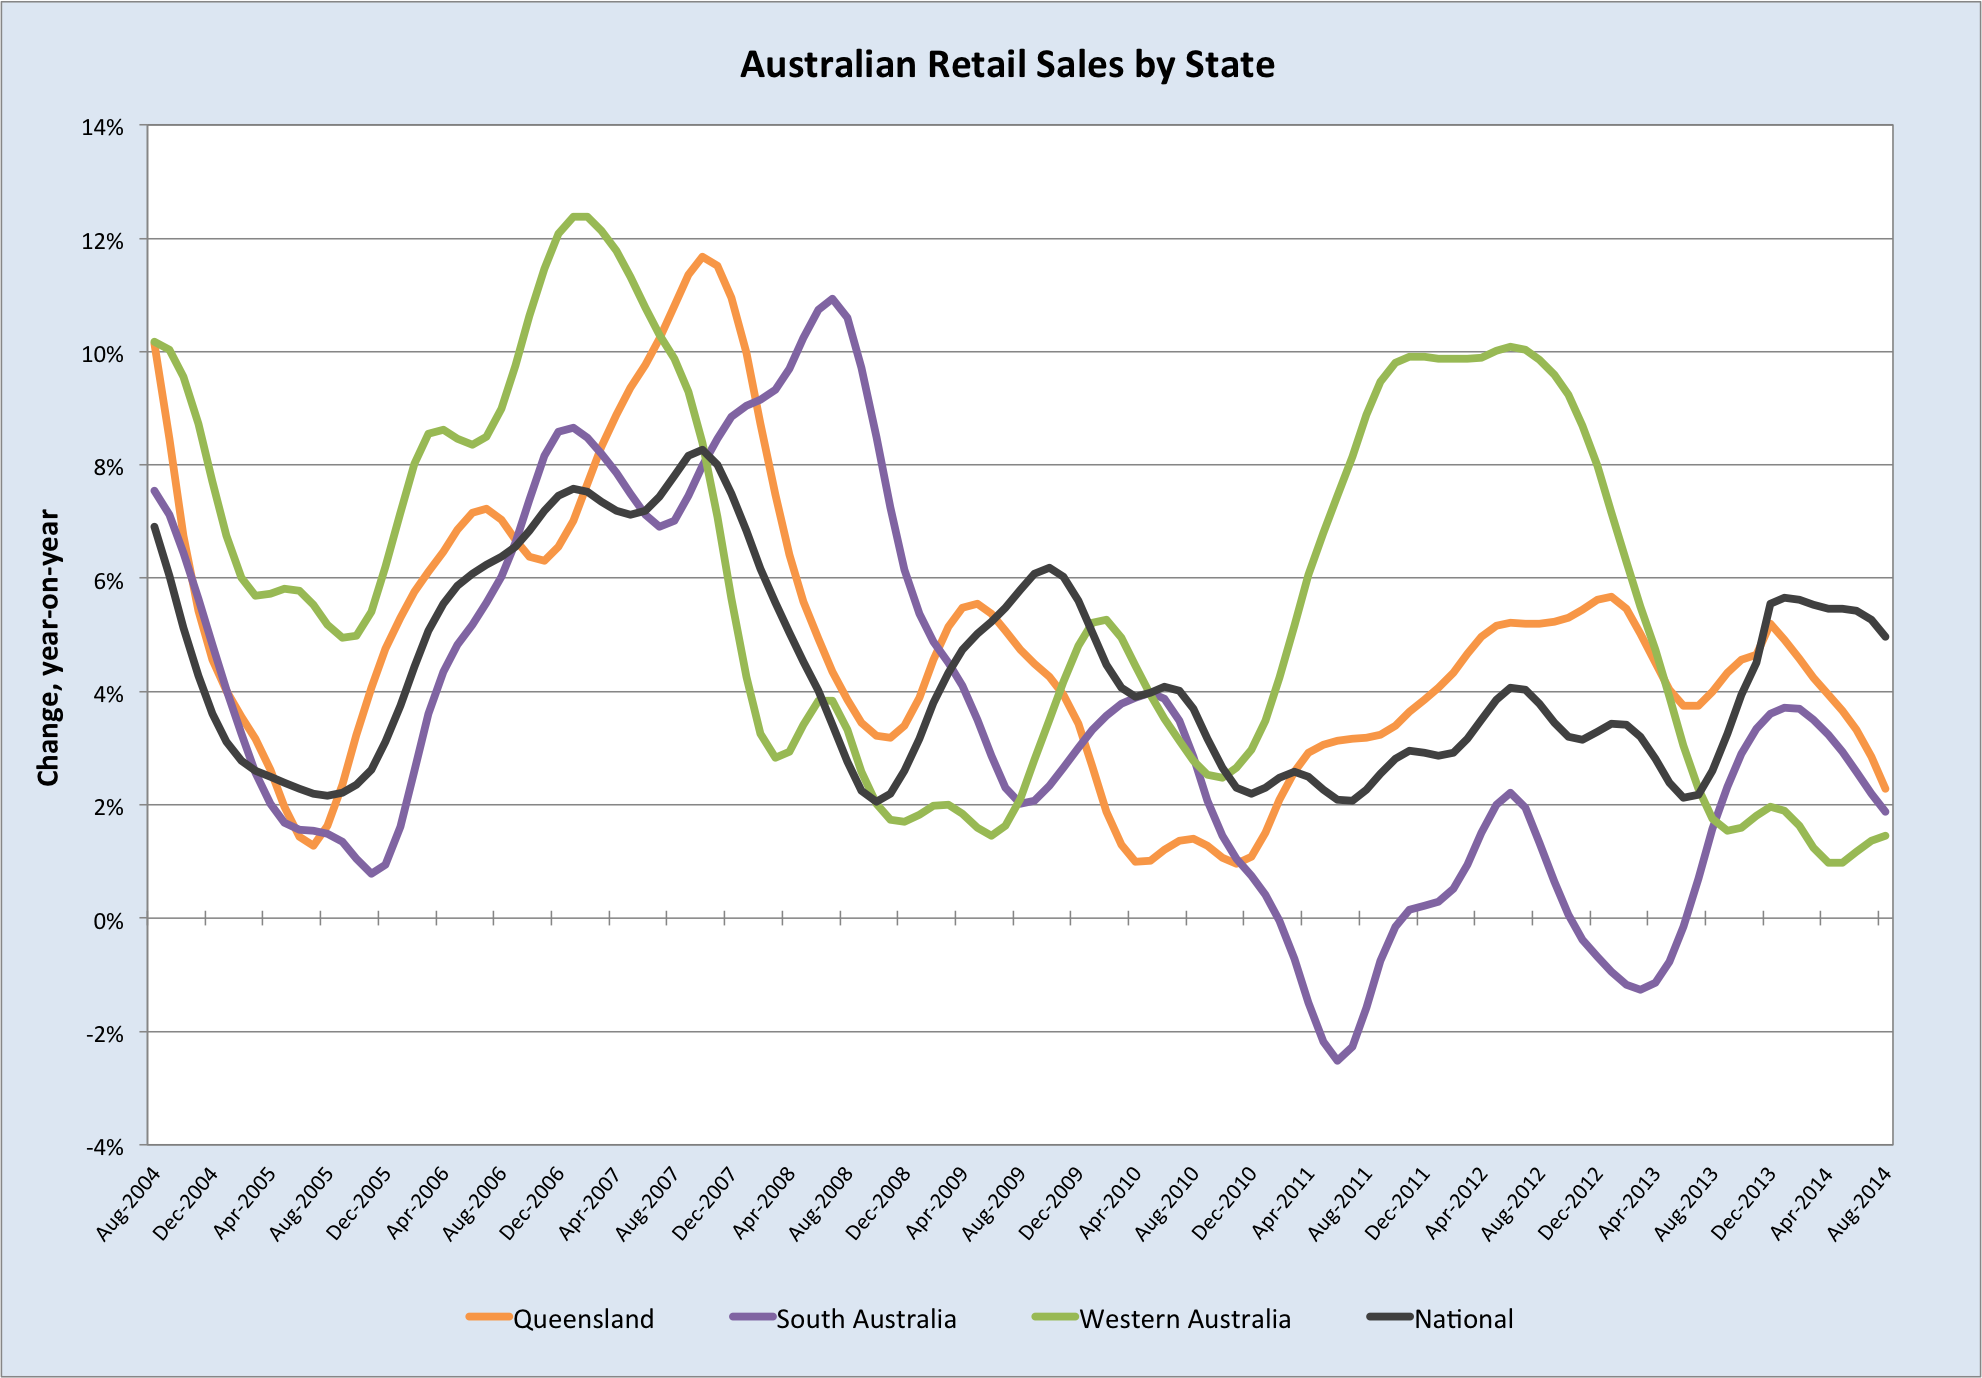
One result of this building boom has been a shift in the relative economic performance of the states. Reversing the pattern of previous years, state final demand has been contracting in Queensland and WA, while being stronger in NSW and Victoria.

Screen Shot 2014-10-22 at 5.13.31 pm

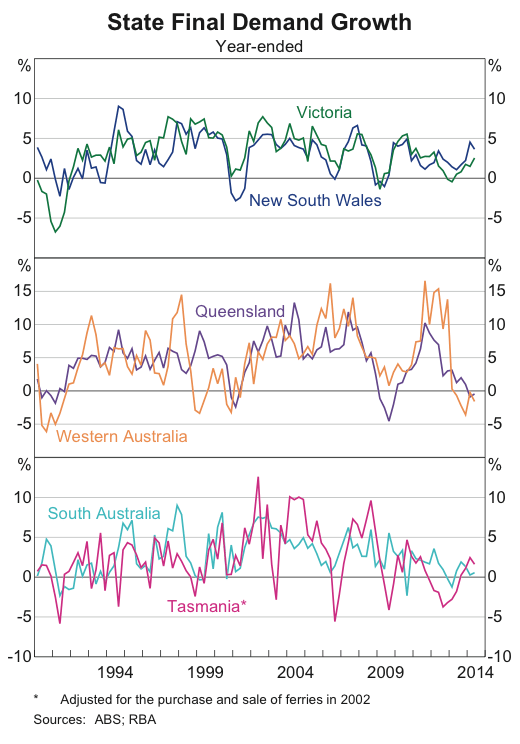
This excludes exports, so it’s misleading to say QLD and WA are in recession. However, foreign purchases of a state’s export commodities don’t necessarily provide much in the way of direct support for local jobs; it was monster profits and hurried investment that had a big impact on local economic conditions. And this is a reality that will be felt more acutely in the coming years as profits continue to fade and investment winds down.

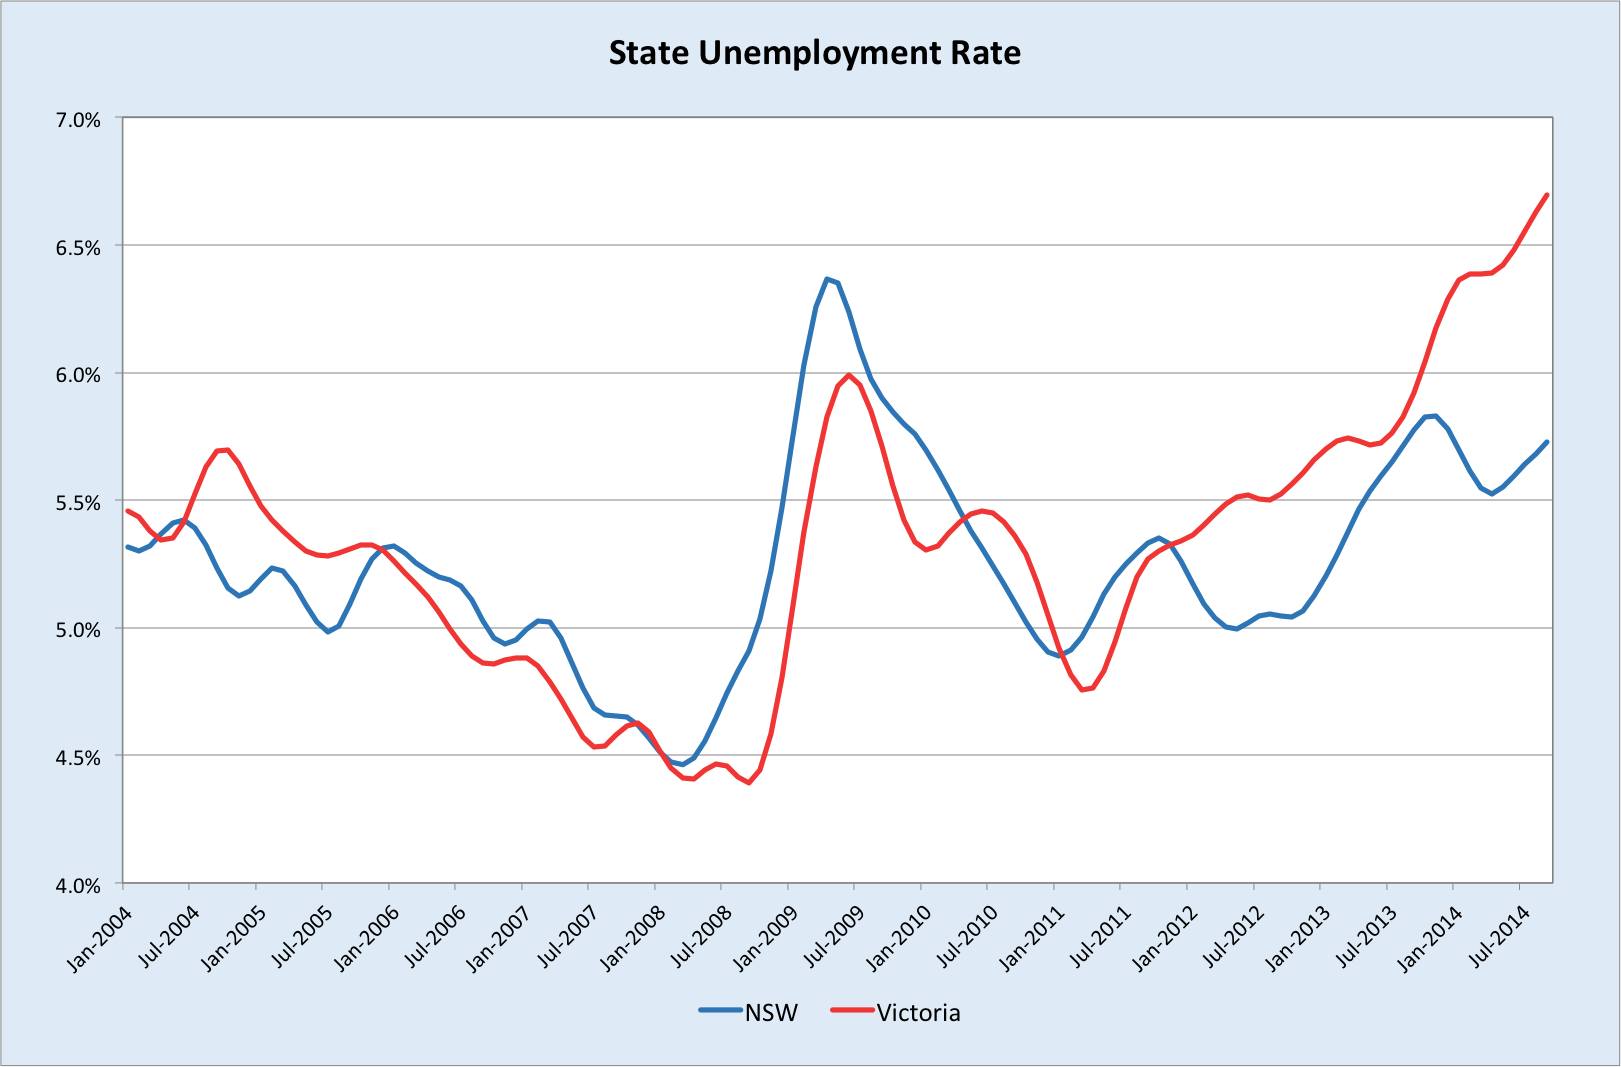
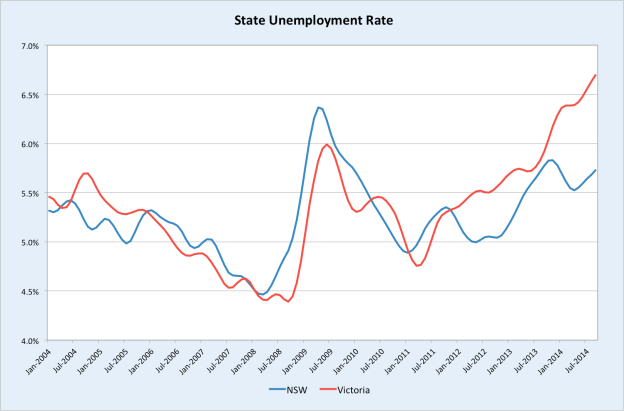
In spite of healthy growth in demand in NSW and reasonable growth in Victoria, unemployment rates remain elevated, with Victoria faring the worse of the two.

stateunemploymentrate

Nationally, rents are now growing roughly in line with the CPI, while house prices are up around four times that. Rental yields have plunged as a result and will of course continue to do so if prices keep rising. It is often argued that high house prices in Australia can be explained by tight supply. Supply has not been as responsive as it could be, but if it really were a central reason for elevated house prices, then renters should be getting squeezed harder than they are. Since it’s prices that are soaring, but not rents, we can conclude that the demand side of the market is the primary driver of house prices.

So we have a hot housing market that is being propelled by investors seeking returns in the form of capital gains, since income produced from these assets is paltry. As more supply hits the market, growth in rents will remain subdued and may even fall. Low income generation can be justified when interest rates fall significantly, since this reduces the cash outflow from the investment. As prices rise, larger mortgages are required to speculate on houses, weakening the economic case for housing investment. Thus there is a limit to how far a housing boom will run on lower interest rates alone (though what that limit is precisely is a matter for the behaviourists). Indeed, recent consumer surveys have indicated that expectations for house price growth have well and truly rolled over.

In addition, we have the RBA signalling it will implement some form of macroprudential regulation by the end of the year, in a bid to cool investor activity in the housing market. Whether or not this has a significant impact in the absence of rate hikes remains to be seen. But I would expect it to hurt at the margin at the very least.

I can see the boom in house prices continuing for perhaps another 6-9 months before running out of puff. If macpru bites hard, then it may wind down earlier. Exactly when this latest investor frenzy for housing cools is immaterial, what matters for our purposes is that this boom is not translating into labour market tightness or inflationary pressures. On the contrary, the boom is barely holding the unemployment rate where it is. Hiking interest rates to deflate the housing boom would therefore necessitate lower rates in quick succession. For these reasons, I continue to judge that the RBA will not feel compelled to hike rates to quell strength in the housing market, which is likely approaching its denouement anyway.

Consumers

See here for a more detailed treatment of consumer spending.

A large part of the why the housing boom has not had the wider economic impact one might have expected is that households have been reluctant to respond to higher net worth in the usual manner of saving less and spending more.

Screen Shot 2014-10-22 at 6.54.48 pm

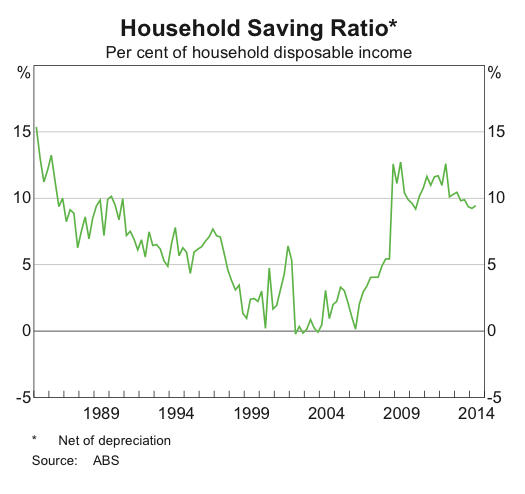
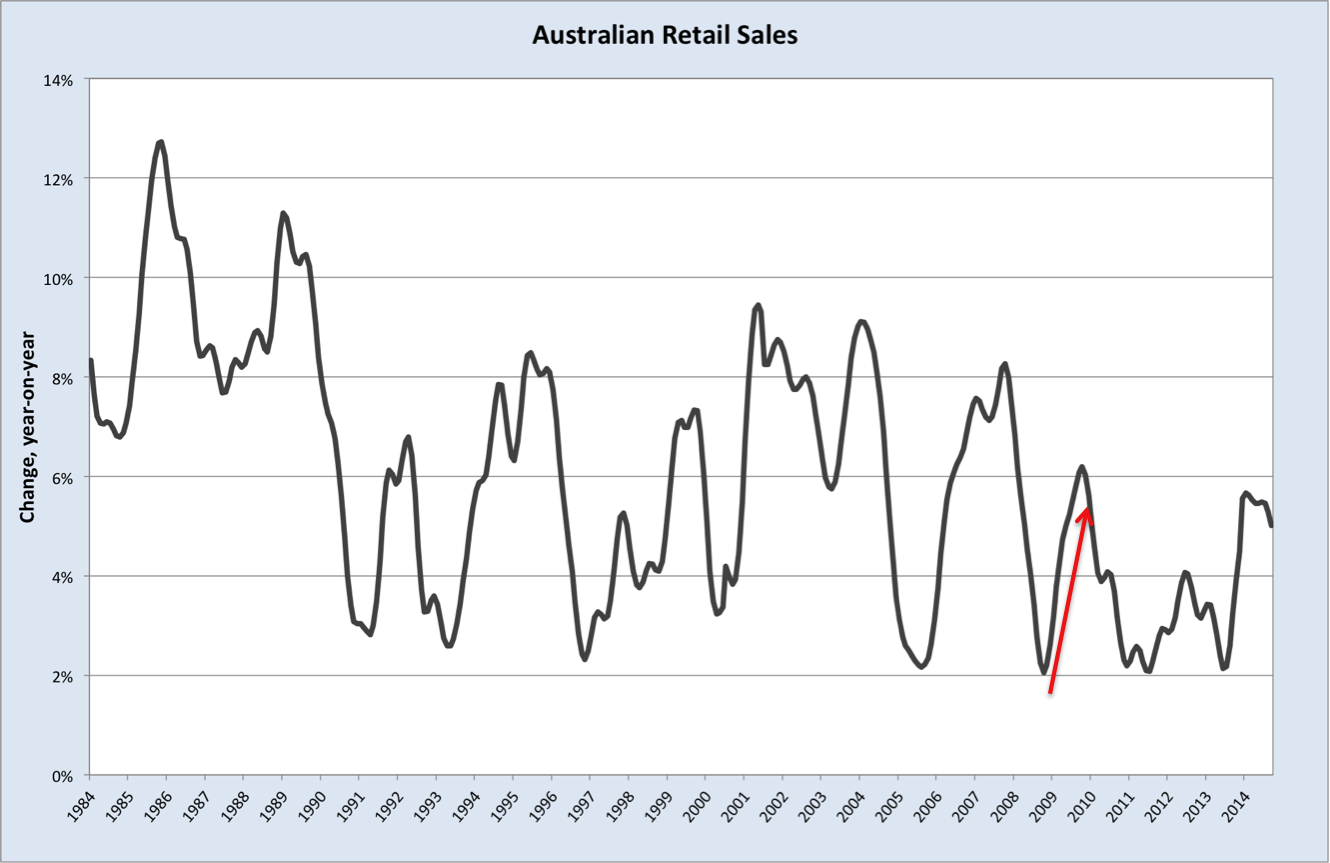
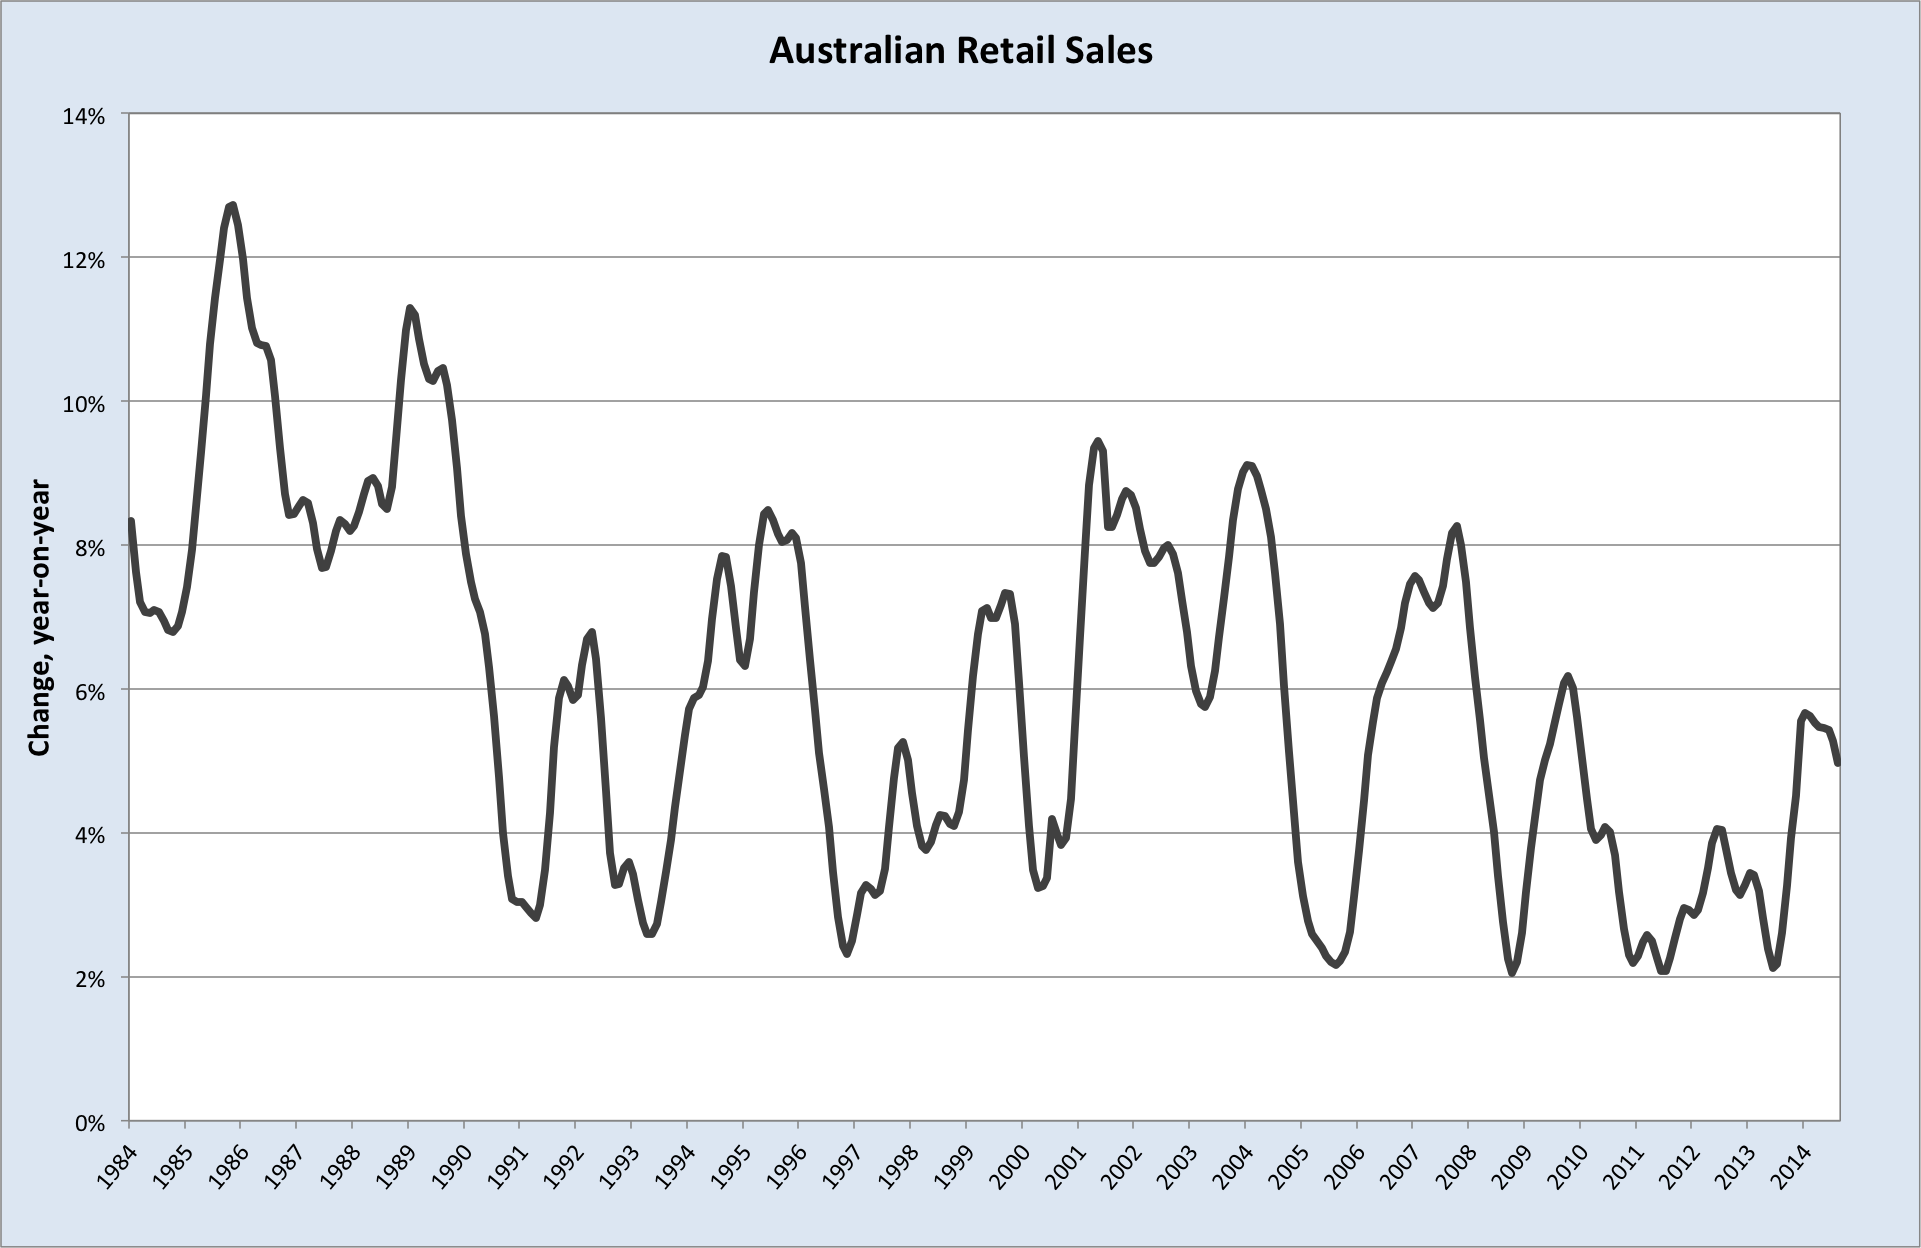
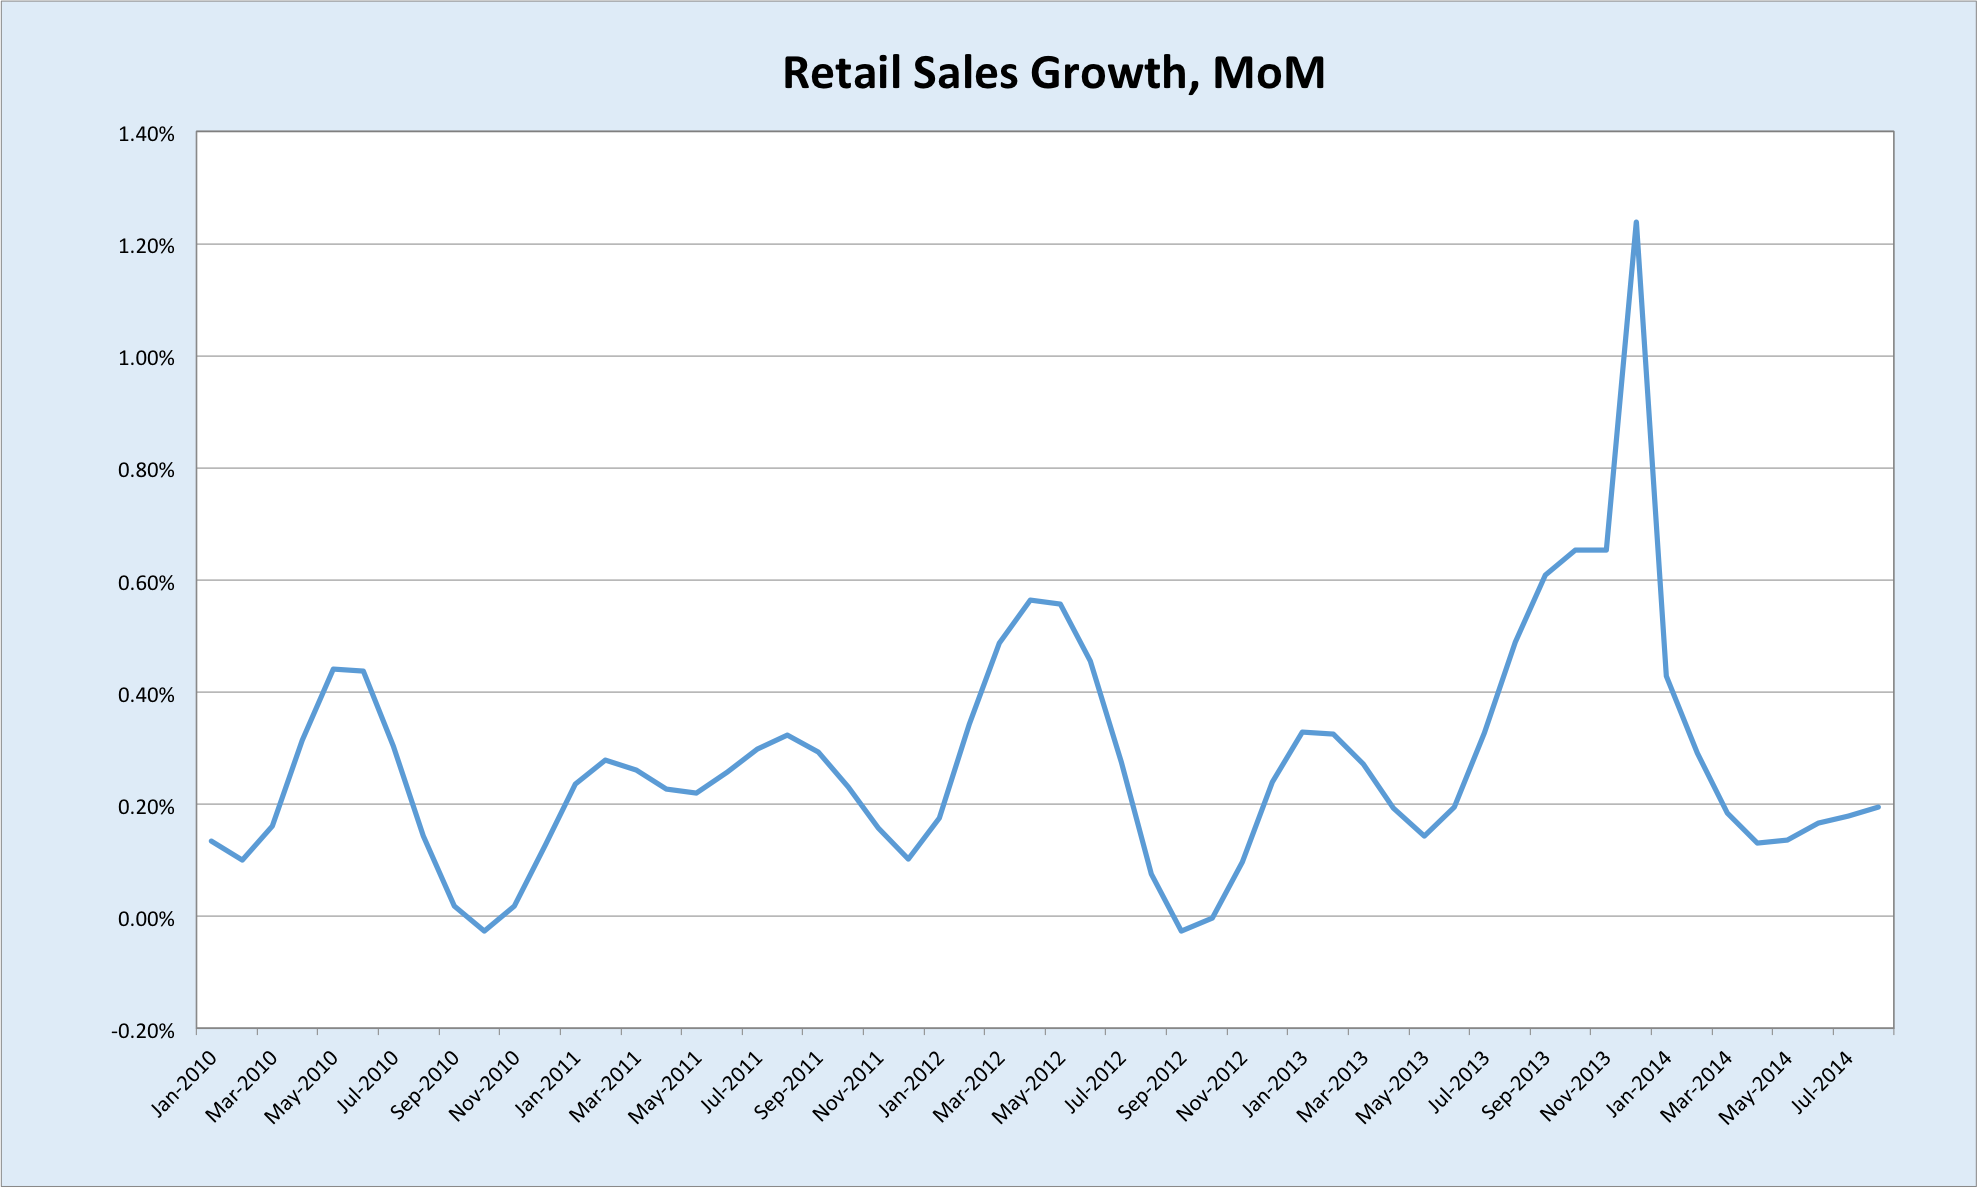
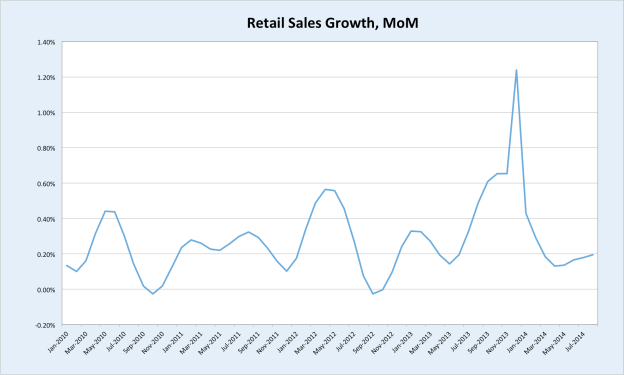
After a jump into Christmas, retail sales growth has been tepid this year; not what you would expect given the ongoing improvement in household wealth.

RetailSalesAug14mom

I cannot be sure exactly why Australian households have altered their behaviour in this way. Watching financial meltdowns and long, deep recessions across much of the developed world has probably endowed us with a greater degree of cautiousness towards gains in paper wealth. The budget undoubtedly damaged sentiment, and the travails of commodity prices will be hurting as well, especially in WA.

Whatever the cause, consumers have chosen to remain stubbornly parsimonious in the face of rising wealth. Until they throw caution to the wind, there is little in the outlook for consumer spending to recommend higher interest rates.

Inflation 

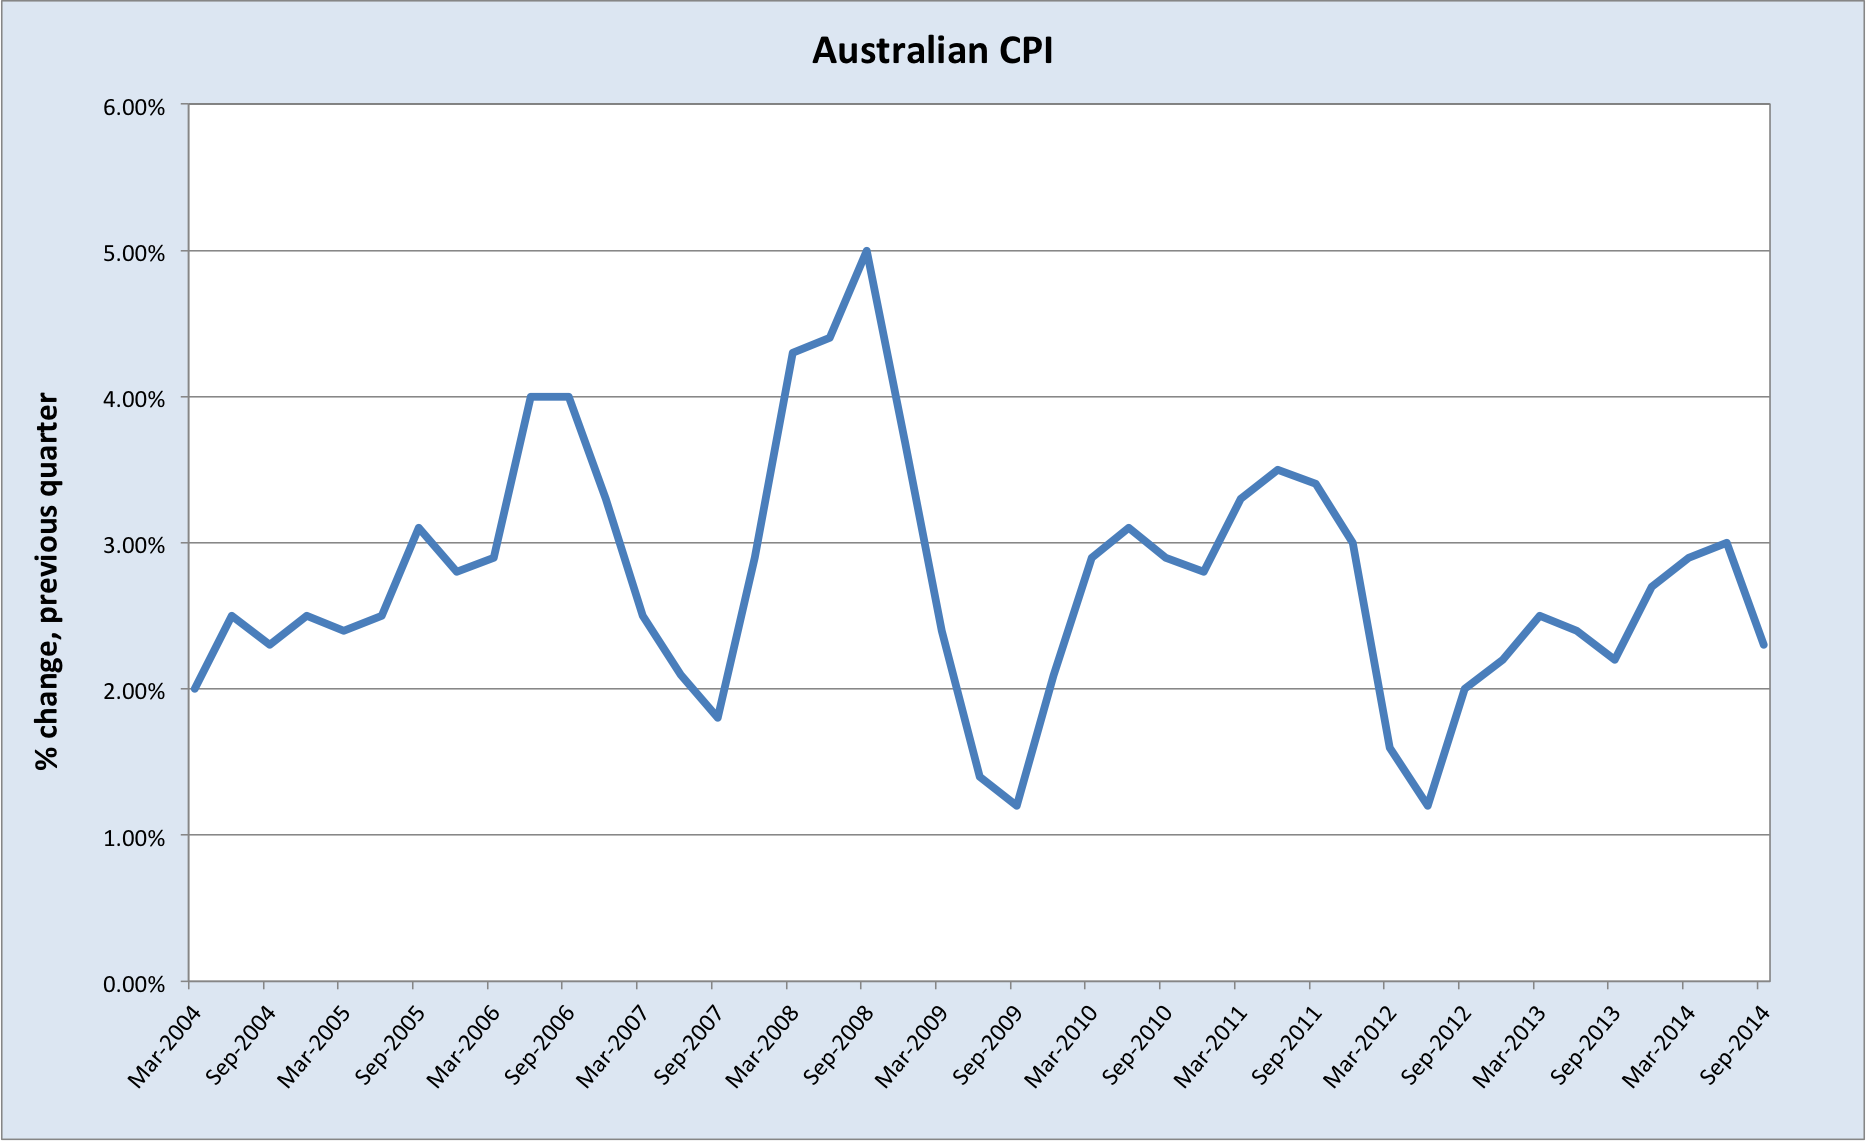
I’ve paid relatively little attention to inflation in Australia in my posts on interest rates, which may seem strange given the primacy of price stability in the RBA’s mandate. The reason I haven’t looked at inflation much is because I don’t consider there to be any serious risk of it posing a problem for the RBA.

cpi

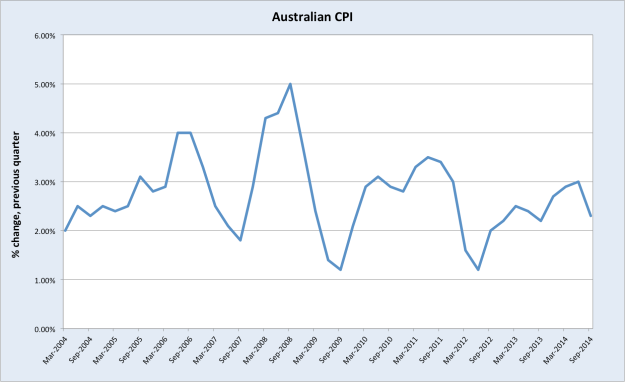
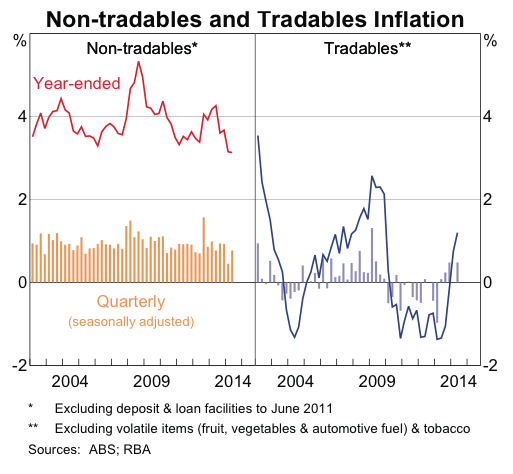
There was some hand-wringing this year among more excitable observers as the CPI bumped up against the RBA’s ceiling rate of 3% (the RBA seeks to contain inflation at 2-3%). For the past year I have steadfastly maintained that this was a temporary occurrence resulting from the sharp decline in the Australian dollar last year (which raised the price of imports) and the introduction of the carbon tax. The effect of ‘tradables’ inflation on the CPI, from rising import prices, was especially pronounced.

Screen Shot 2014-10-22 at 7.59.55 pm

Rising tradables inflation from one-off adjustments in the value of the AUD is not problematic, in fact it is wholly desirable at this time. As I have discussed previously, one of the central economic challenges for Australia is our elevated real exchange rate, which translates to weak international competitiveness and therefore low business investment in trade-exposed sectors outside resources. The least painful way to devalue your real exchange rate is to reduce the value of your nominal exchange rate (the value of your currency against other currencies) and not offset this with higher wages. Wage growth is very low today and the AUD is falling against other major currencies, so progress is being made. By its very definition, a lower nominal exchange rate implies higher import prices; this is what it means to improve Australia’s competitiveness. For this reason, tradables inflation is desirable so long as the depreciation of the currency does not spiral out of control (and there is very little prospect of that today).

Australian Dollar 

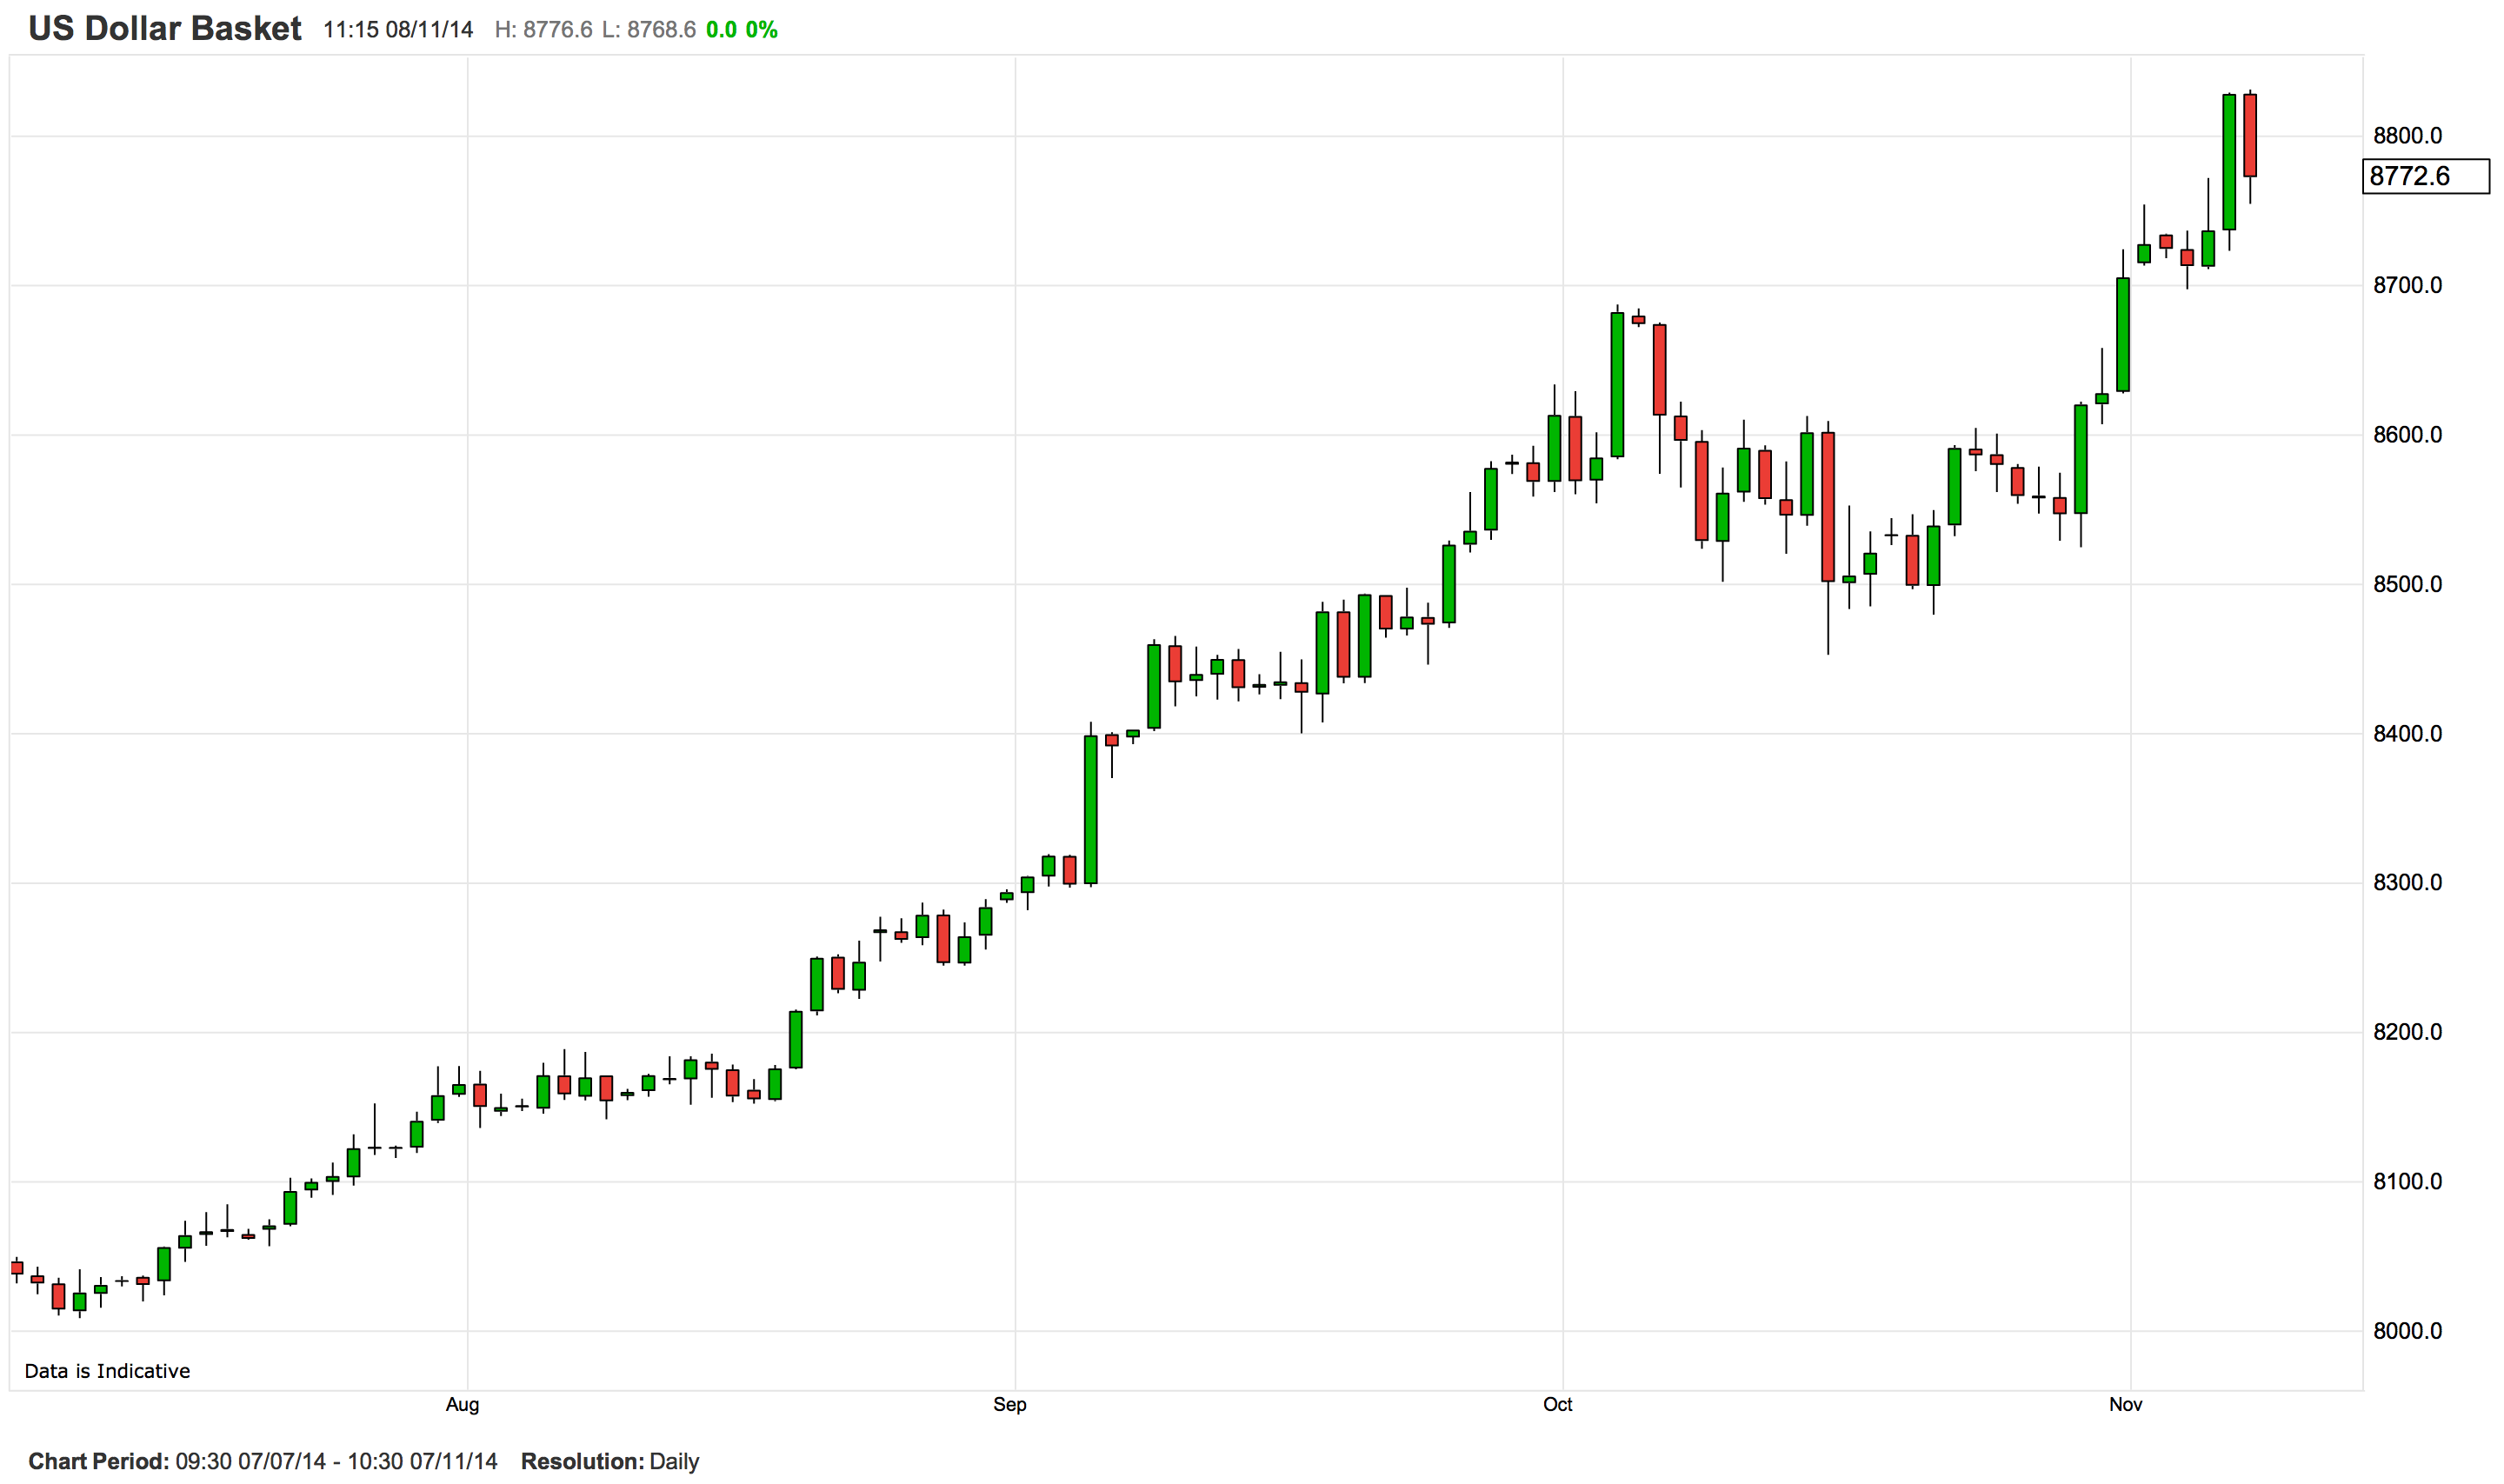
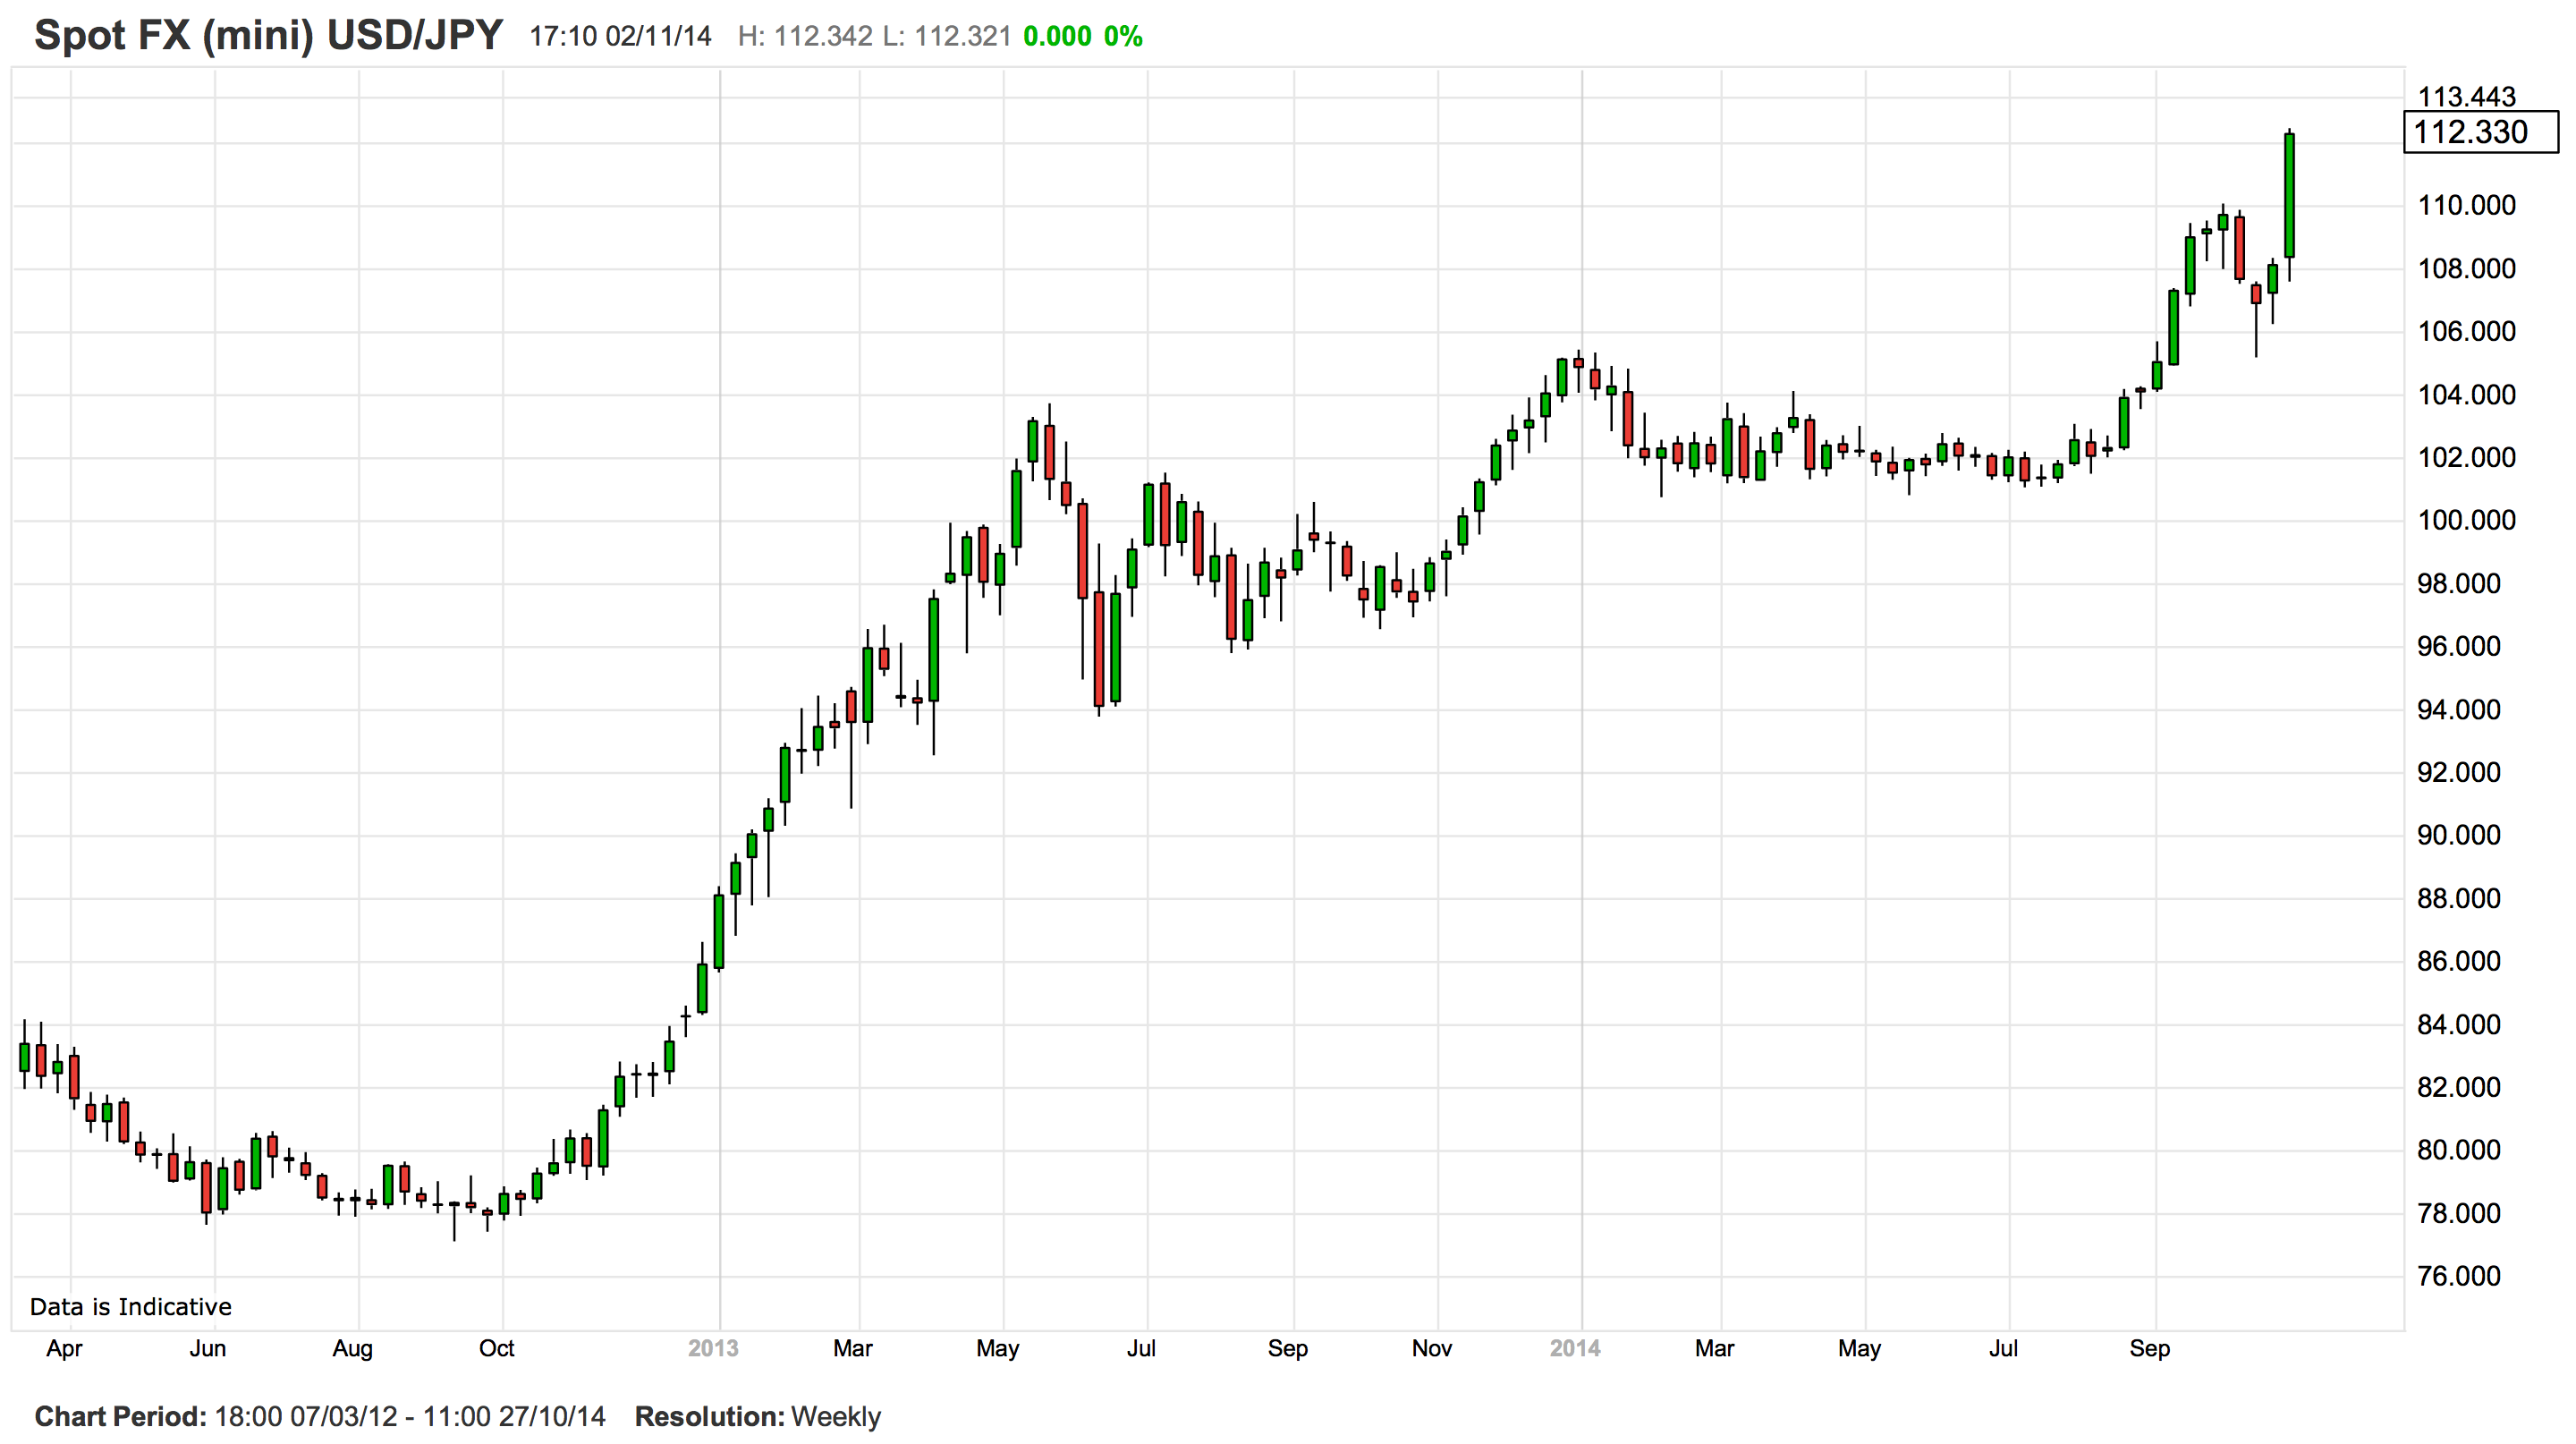
This need to improve Australia’s competitiveness was why I highlighted the Australian dollar as an additional and important consideration in Part 5 of my initial series on rates. A significant drop in the AUD would alleviate many of the structural weights hanging around the neck of the economy. It would improve the profitability of exporters, and so cushion the blow to public finances from falling commodity prices. If large and persistent (and not offset by higher nominal wages), a fall in the AUD would in time revive weak business investment outside the resource sector. All this ought to support employment. While a lower currency is not a silver bullet for all Australia’s challenges (it would make our over-inflated house prices even harder to justify, for instance), in reducing the drag on the economy from various structural weaknesses, it would reduce the likelihood of rate cuts.

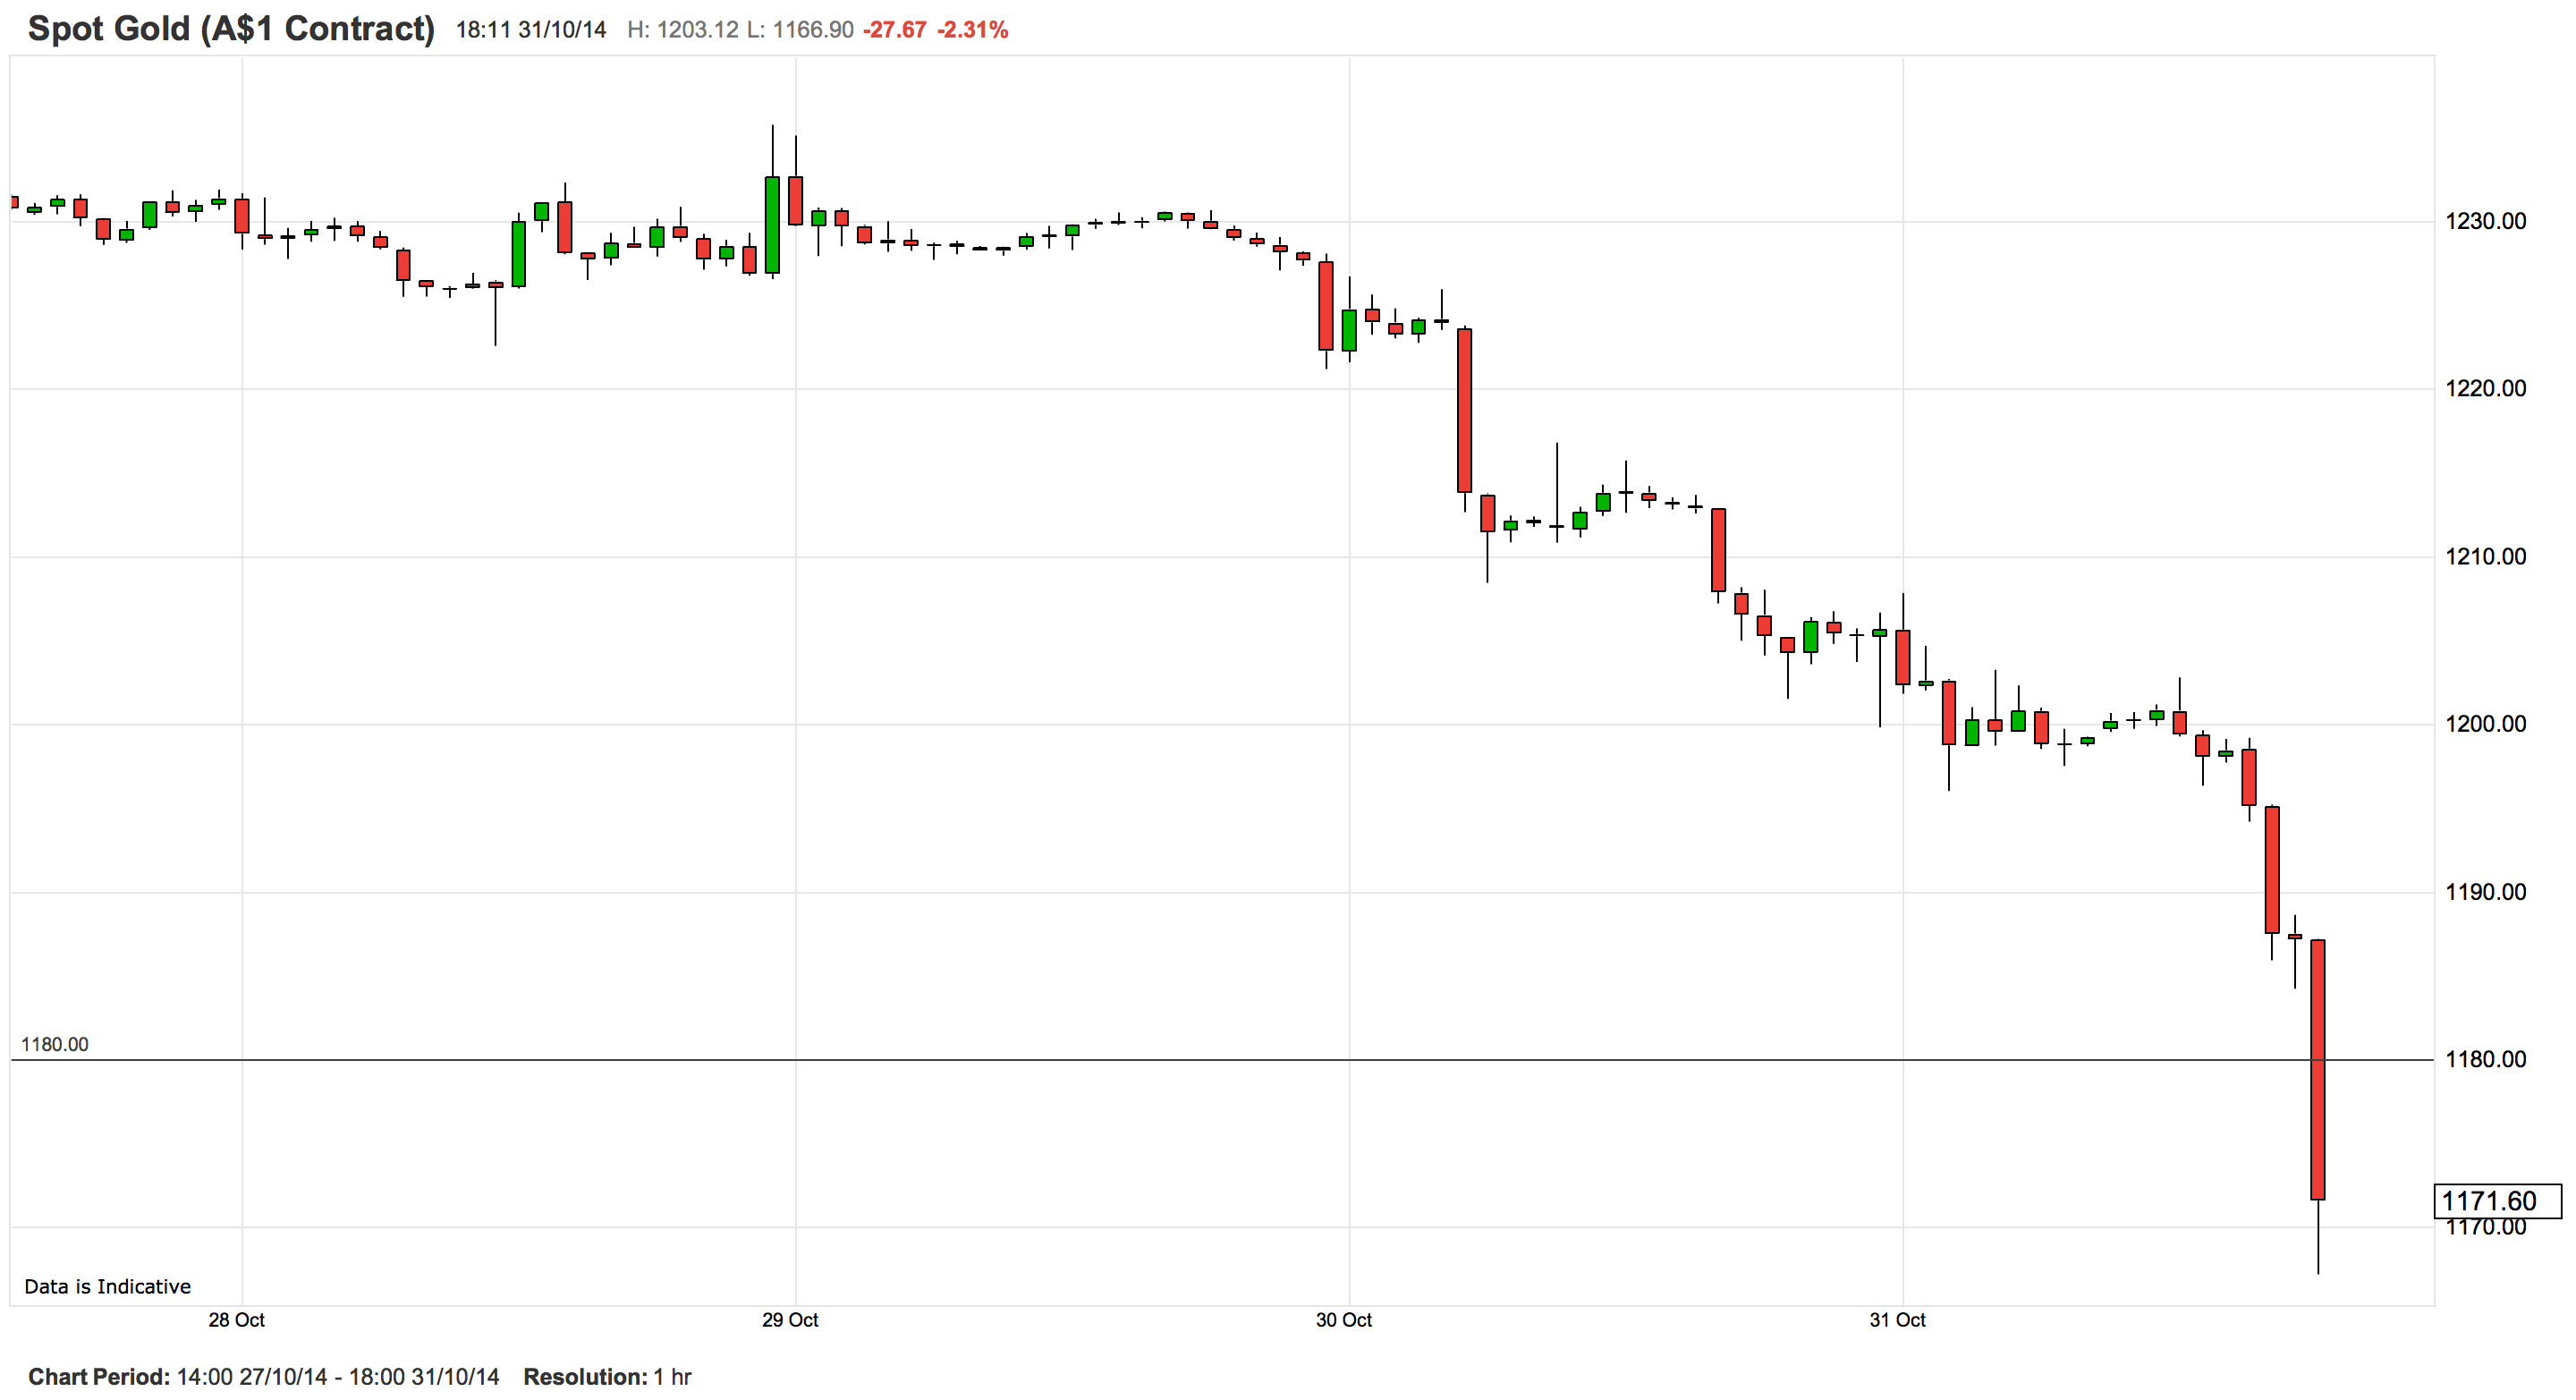
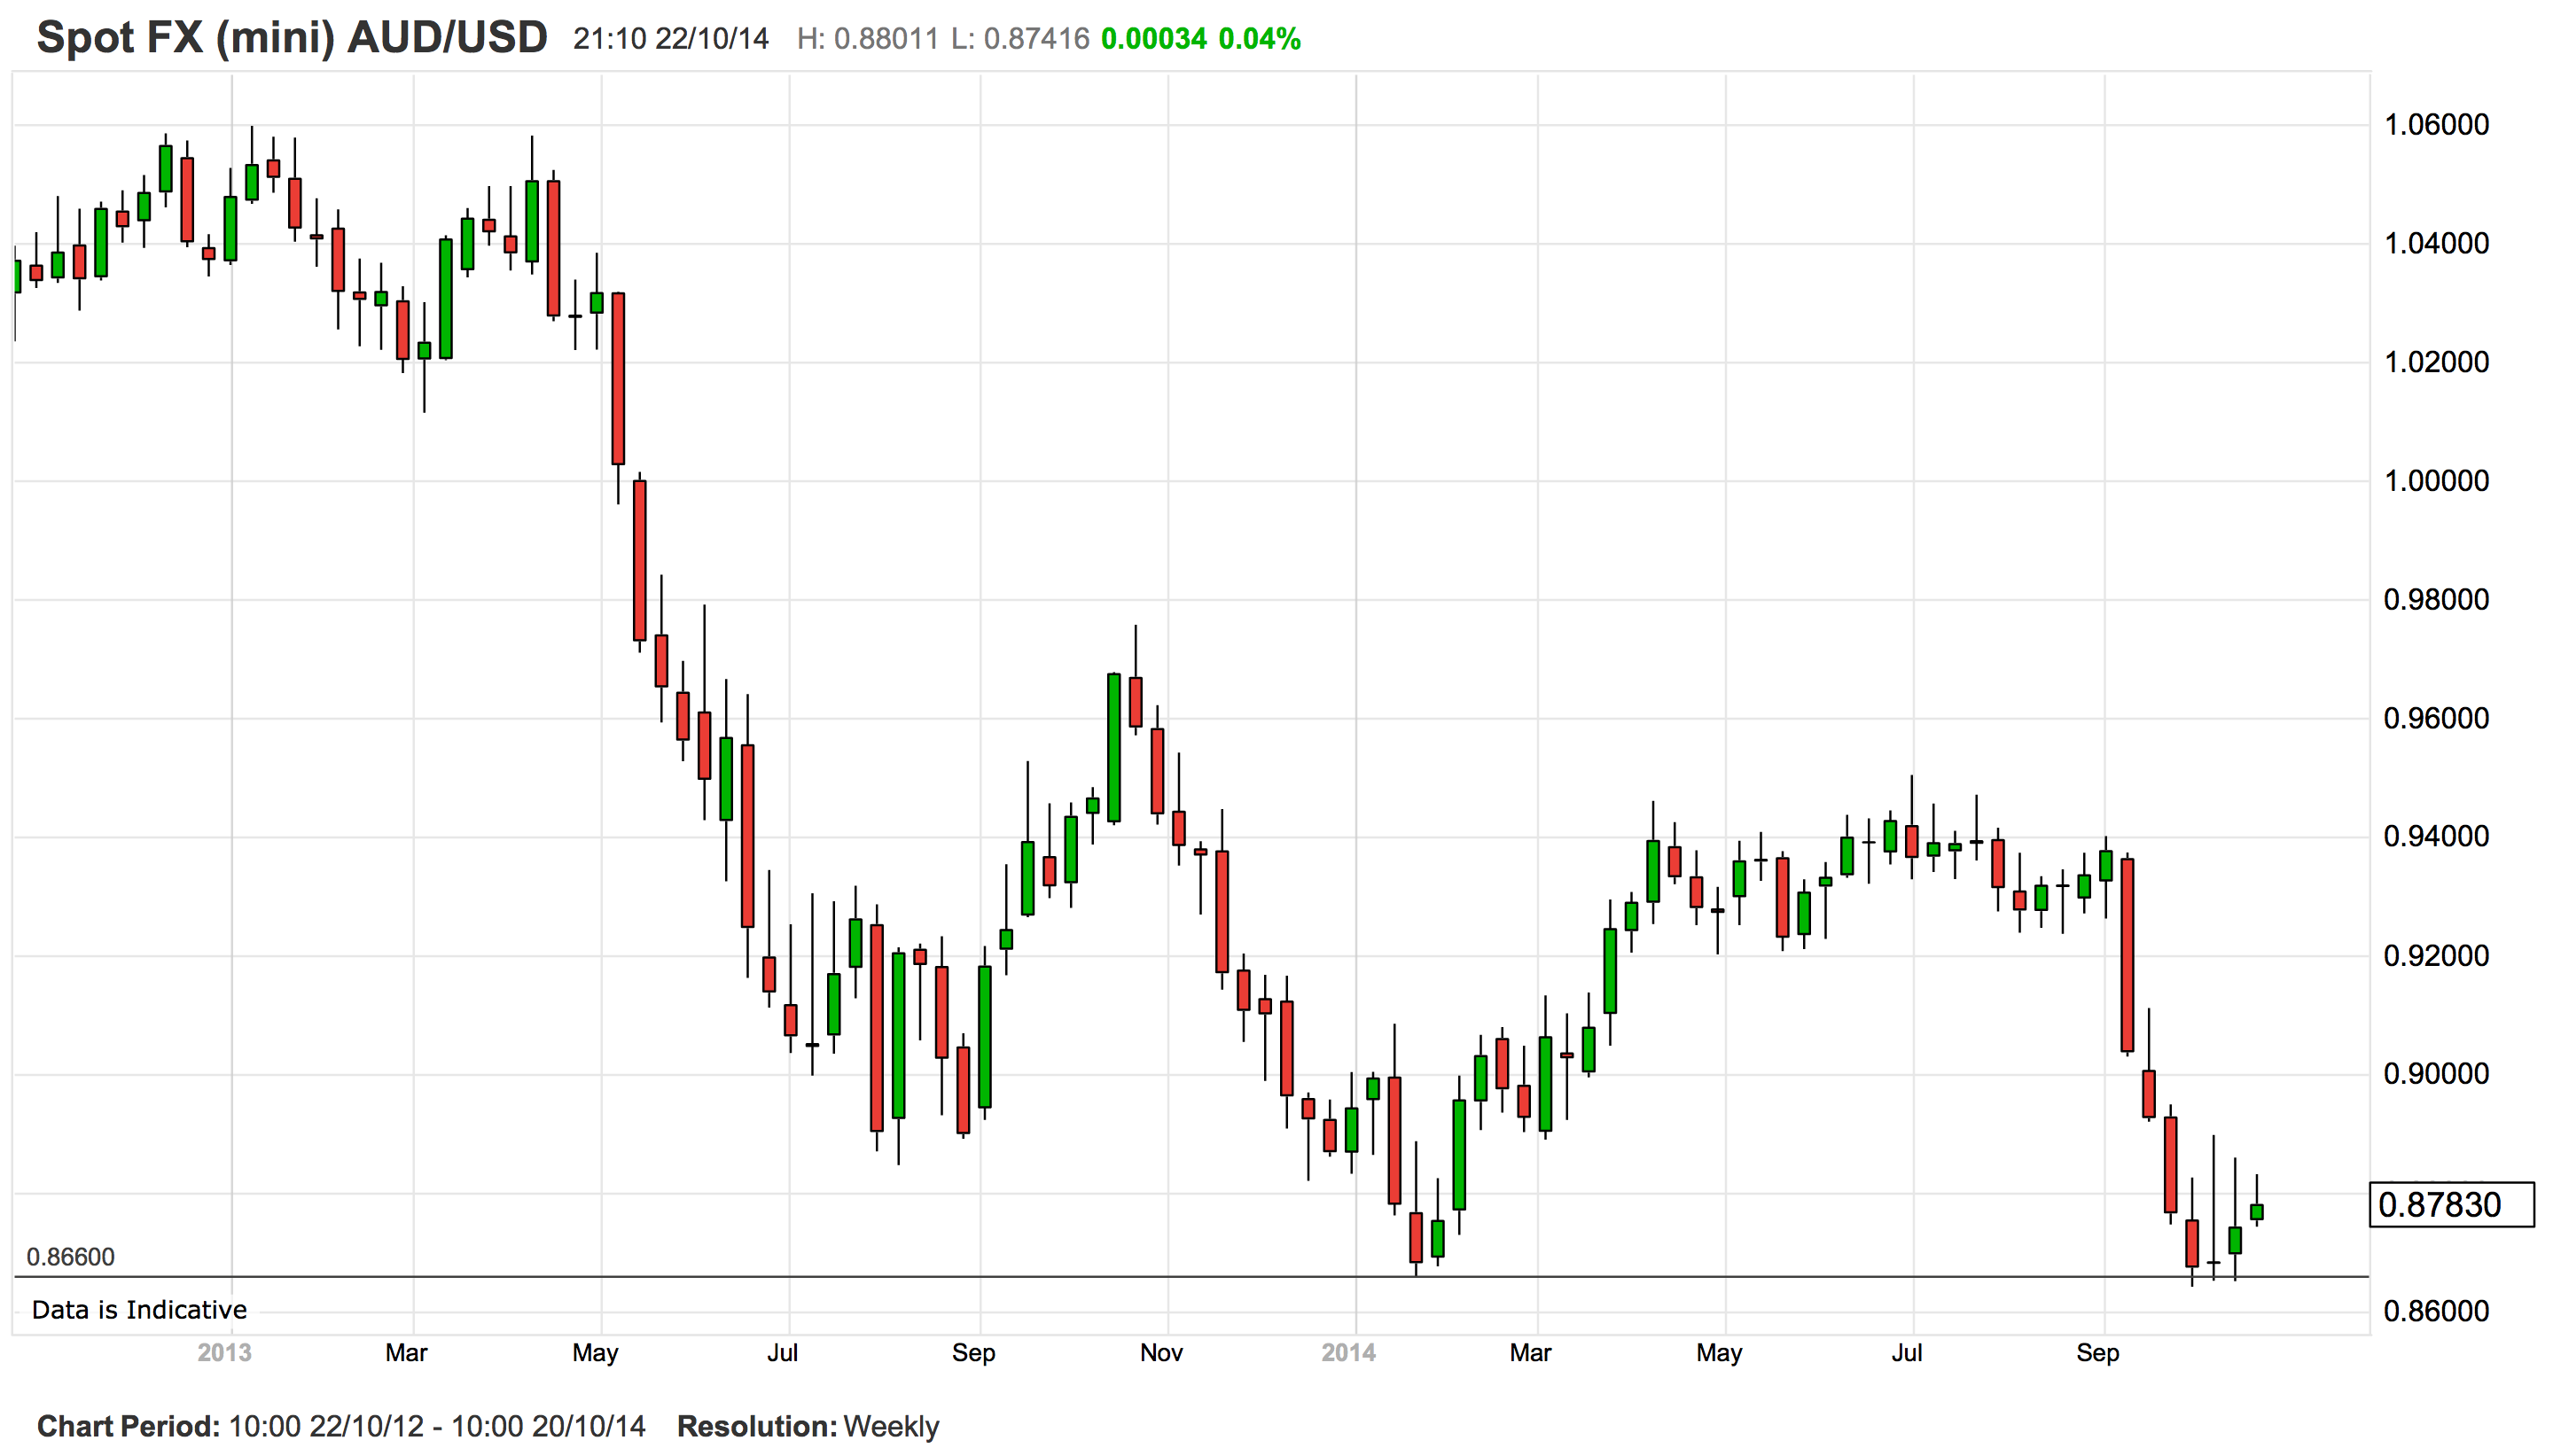
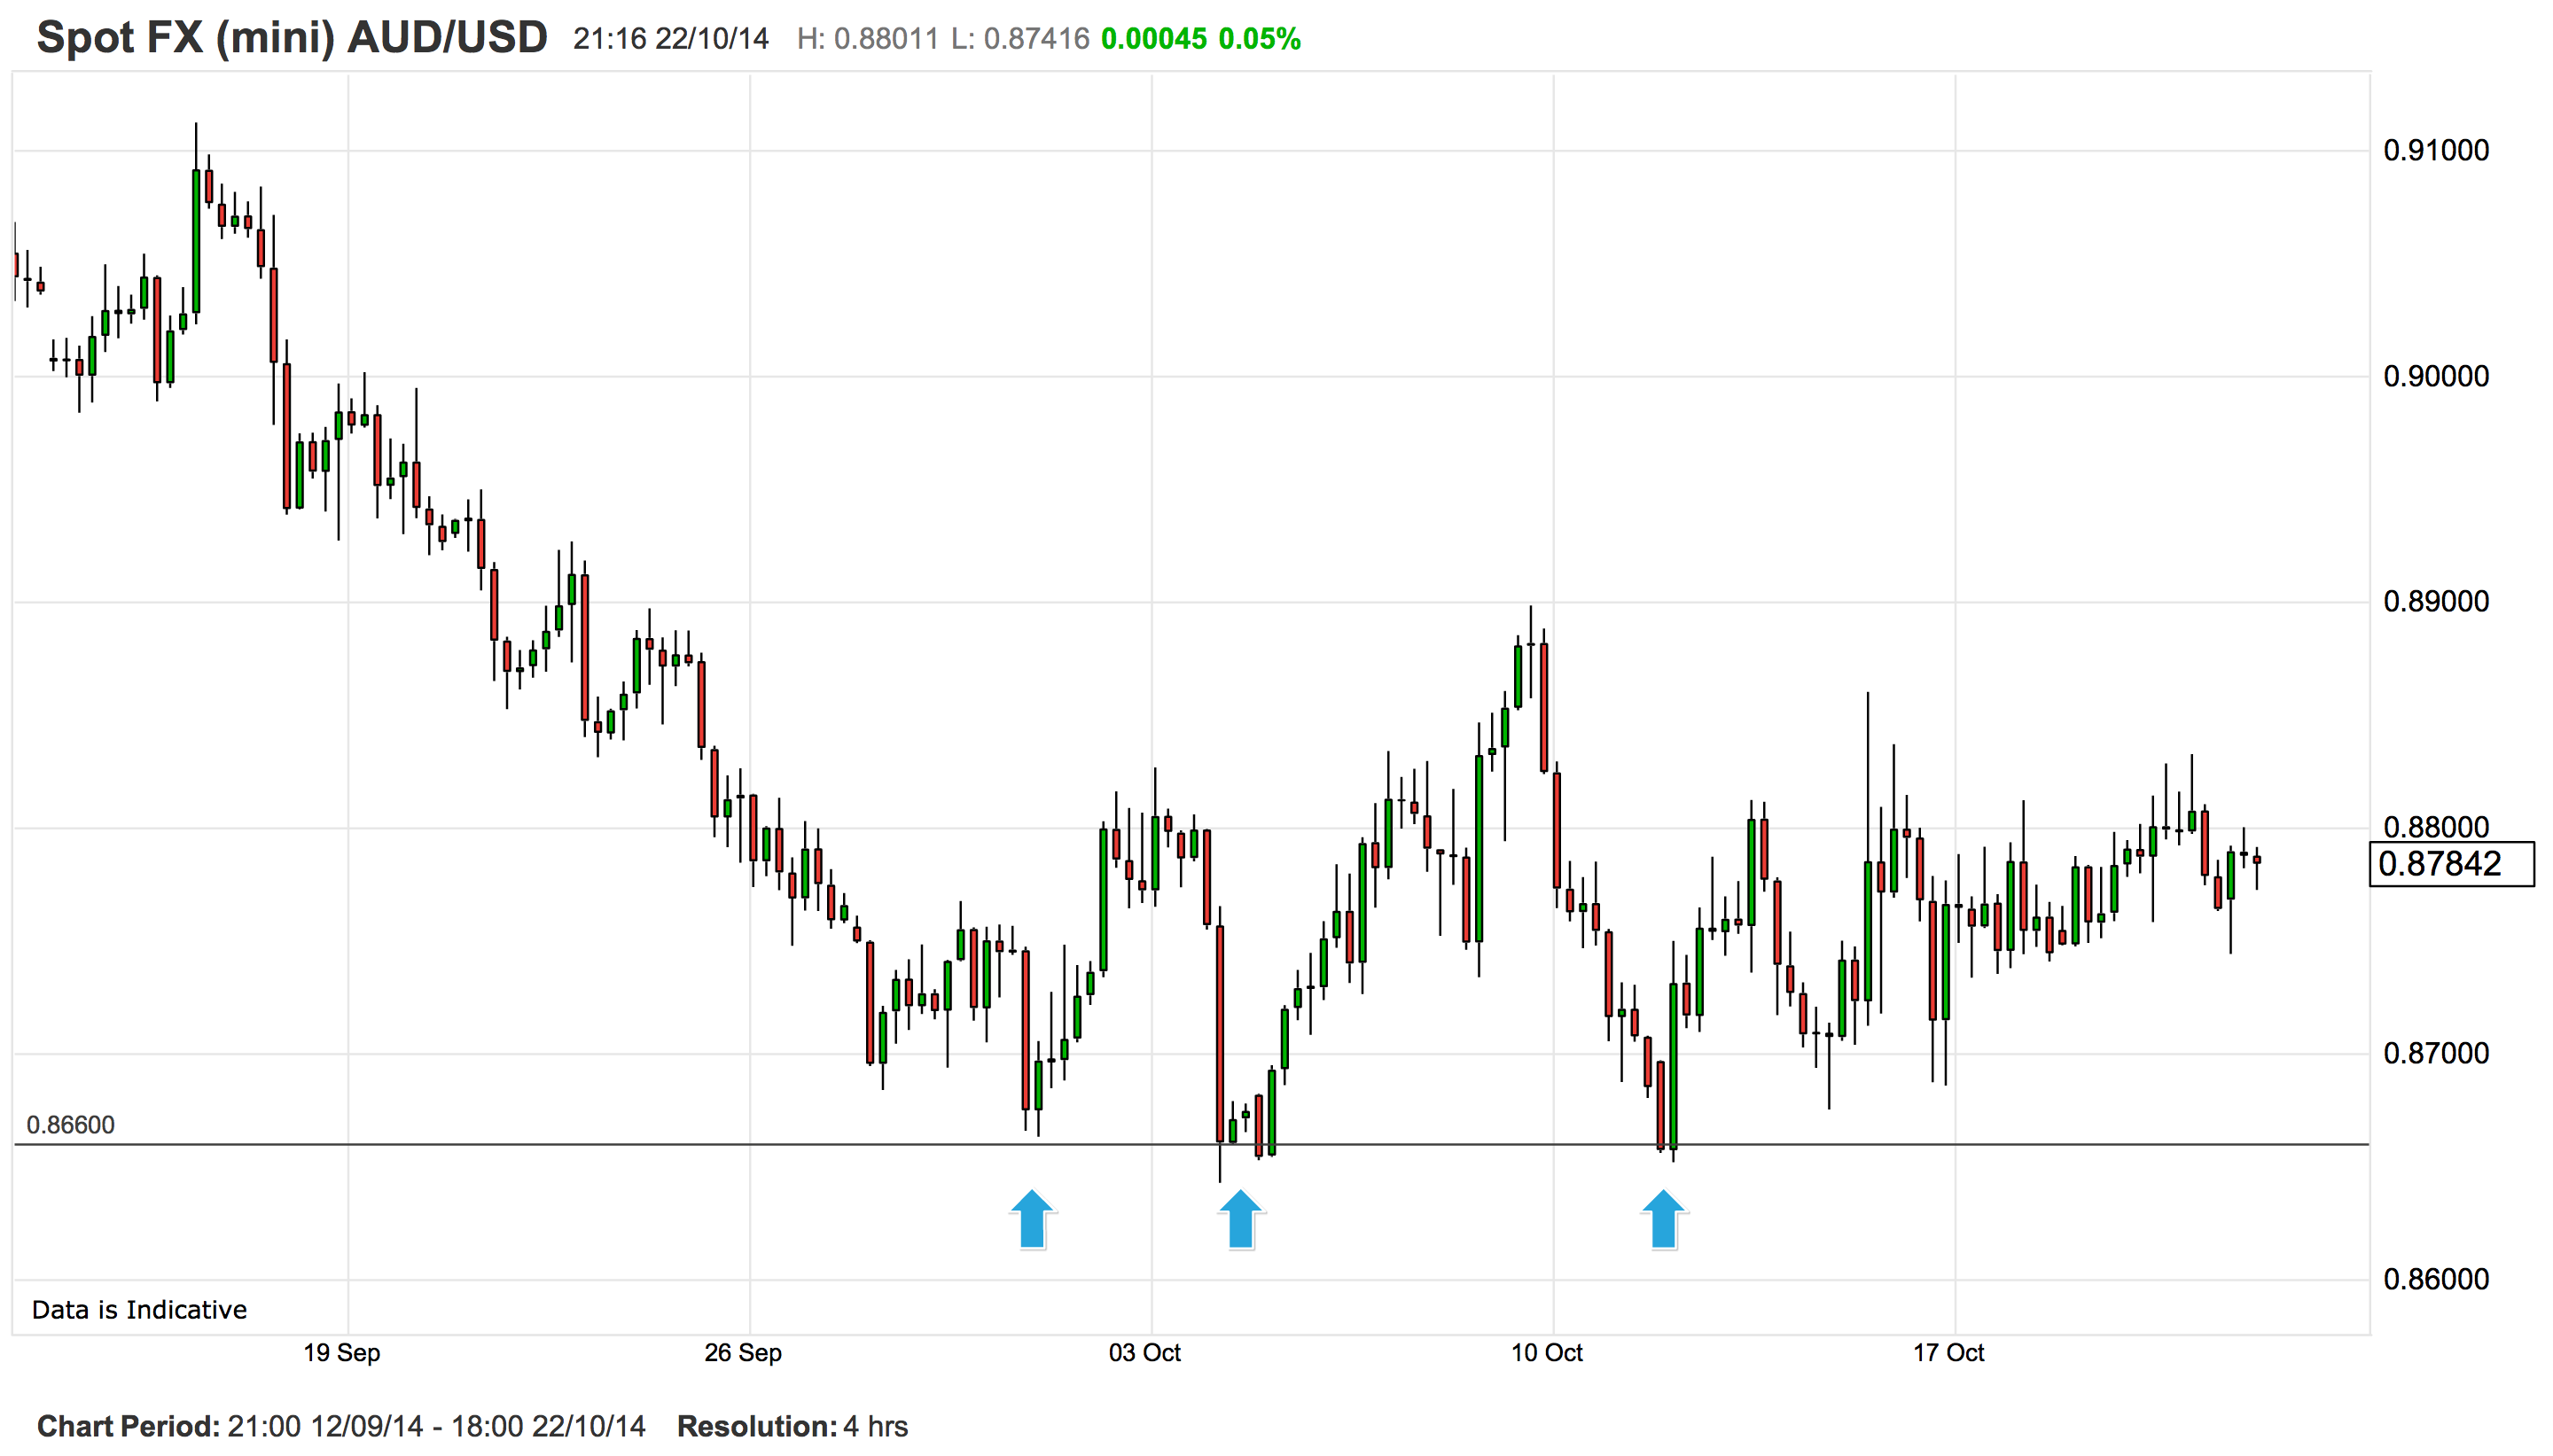
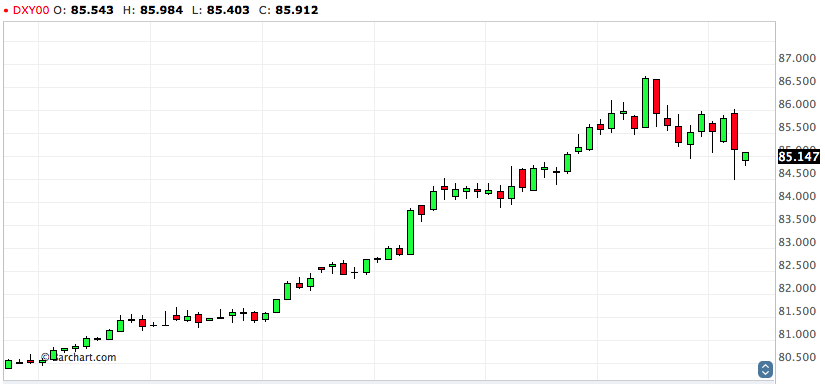
As you can see on the chart below, the AUDUSD had tumbled below support at .9200 and was trading around .8900 at the time of my last Strayan rates post. Since then, it has fallen further but stalled once it hit strong support at the previous low of .8660, set in January this year.

AUD22:10LT

The bears have mounted a concerted effort to break this support on no less than three occasions since the end of September, and failed each time. 

AUD22:10ST

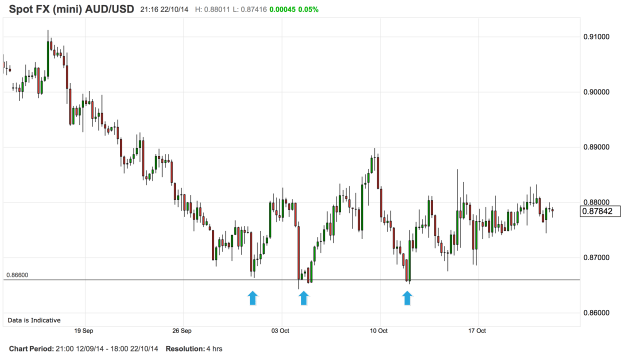
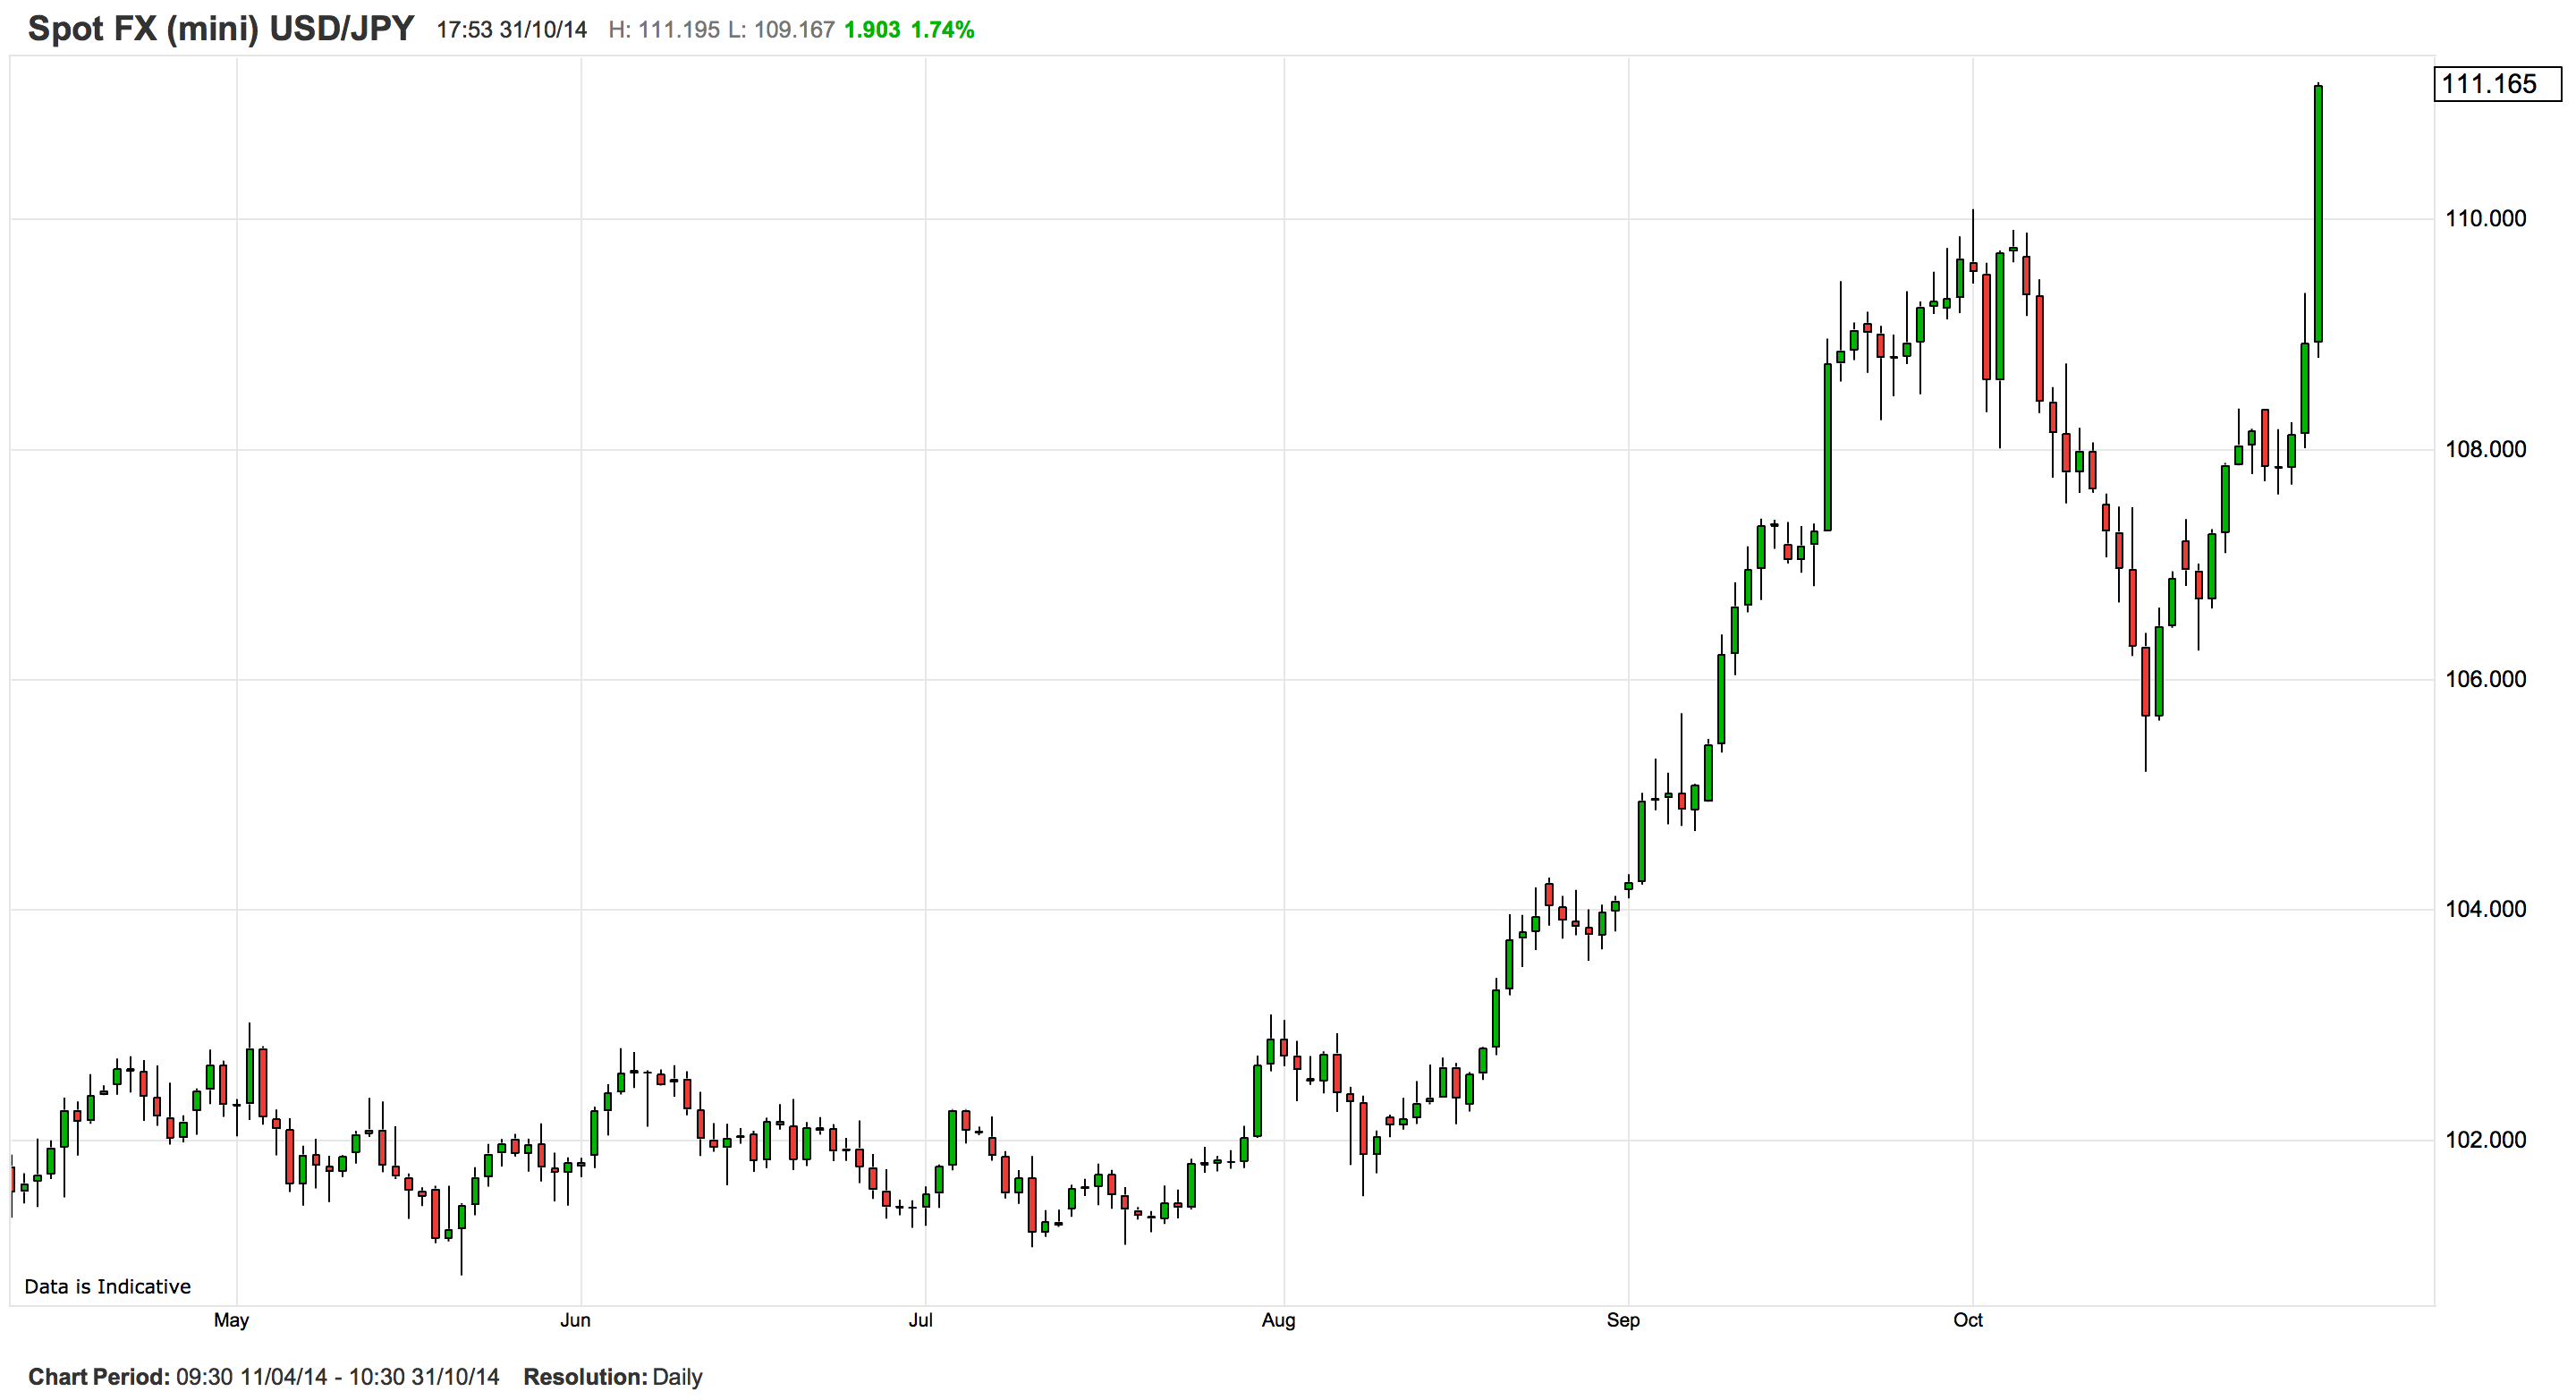
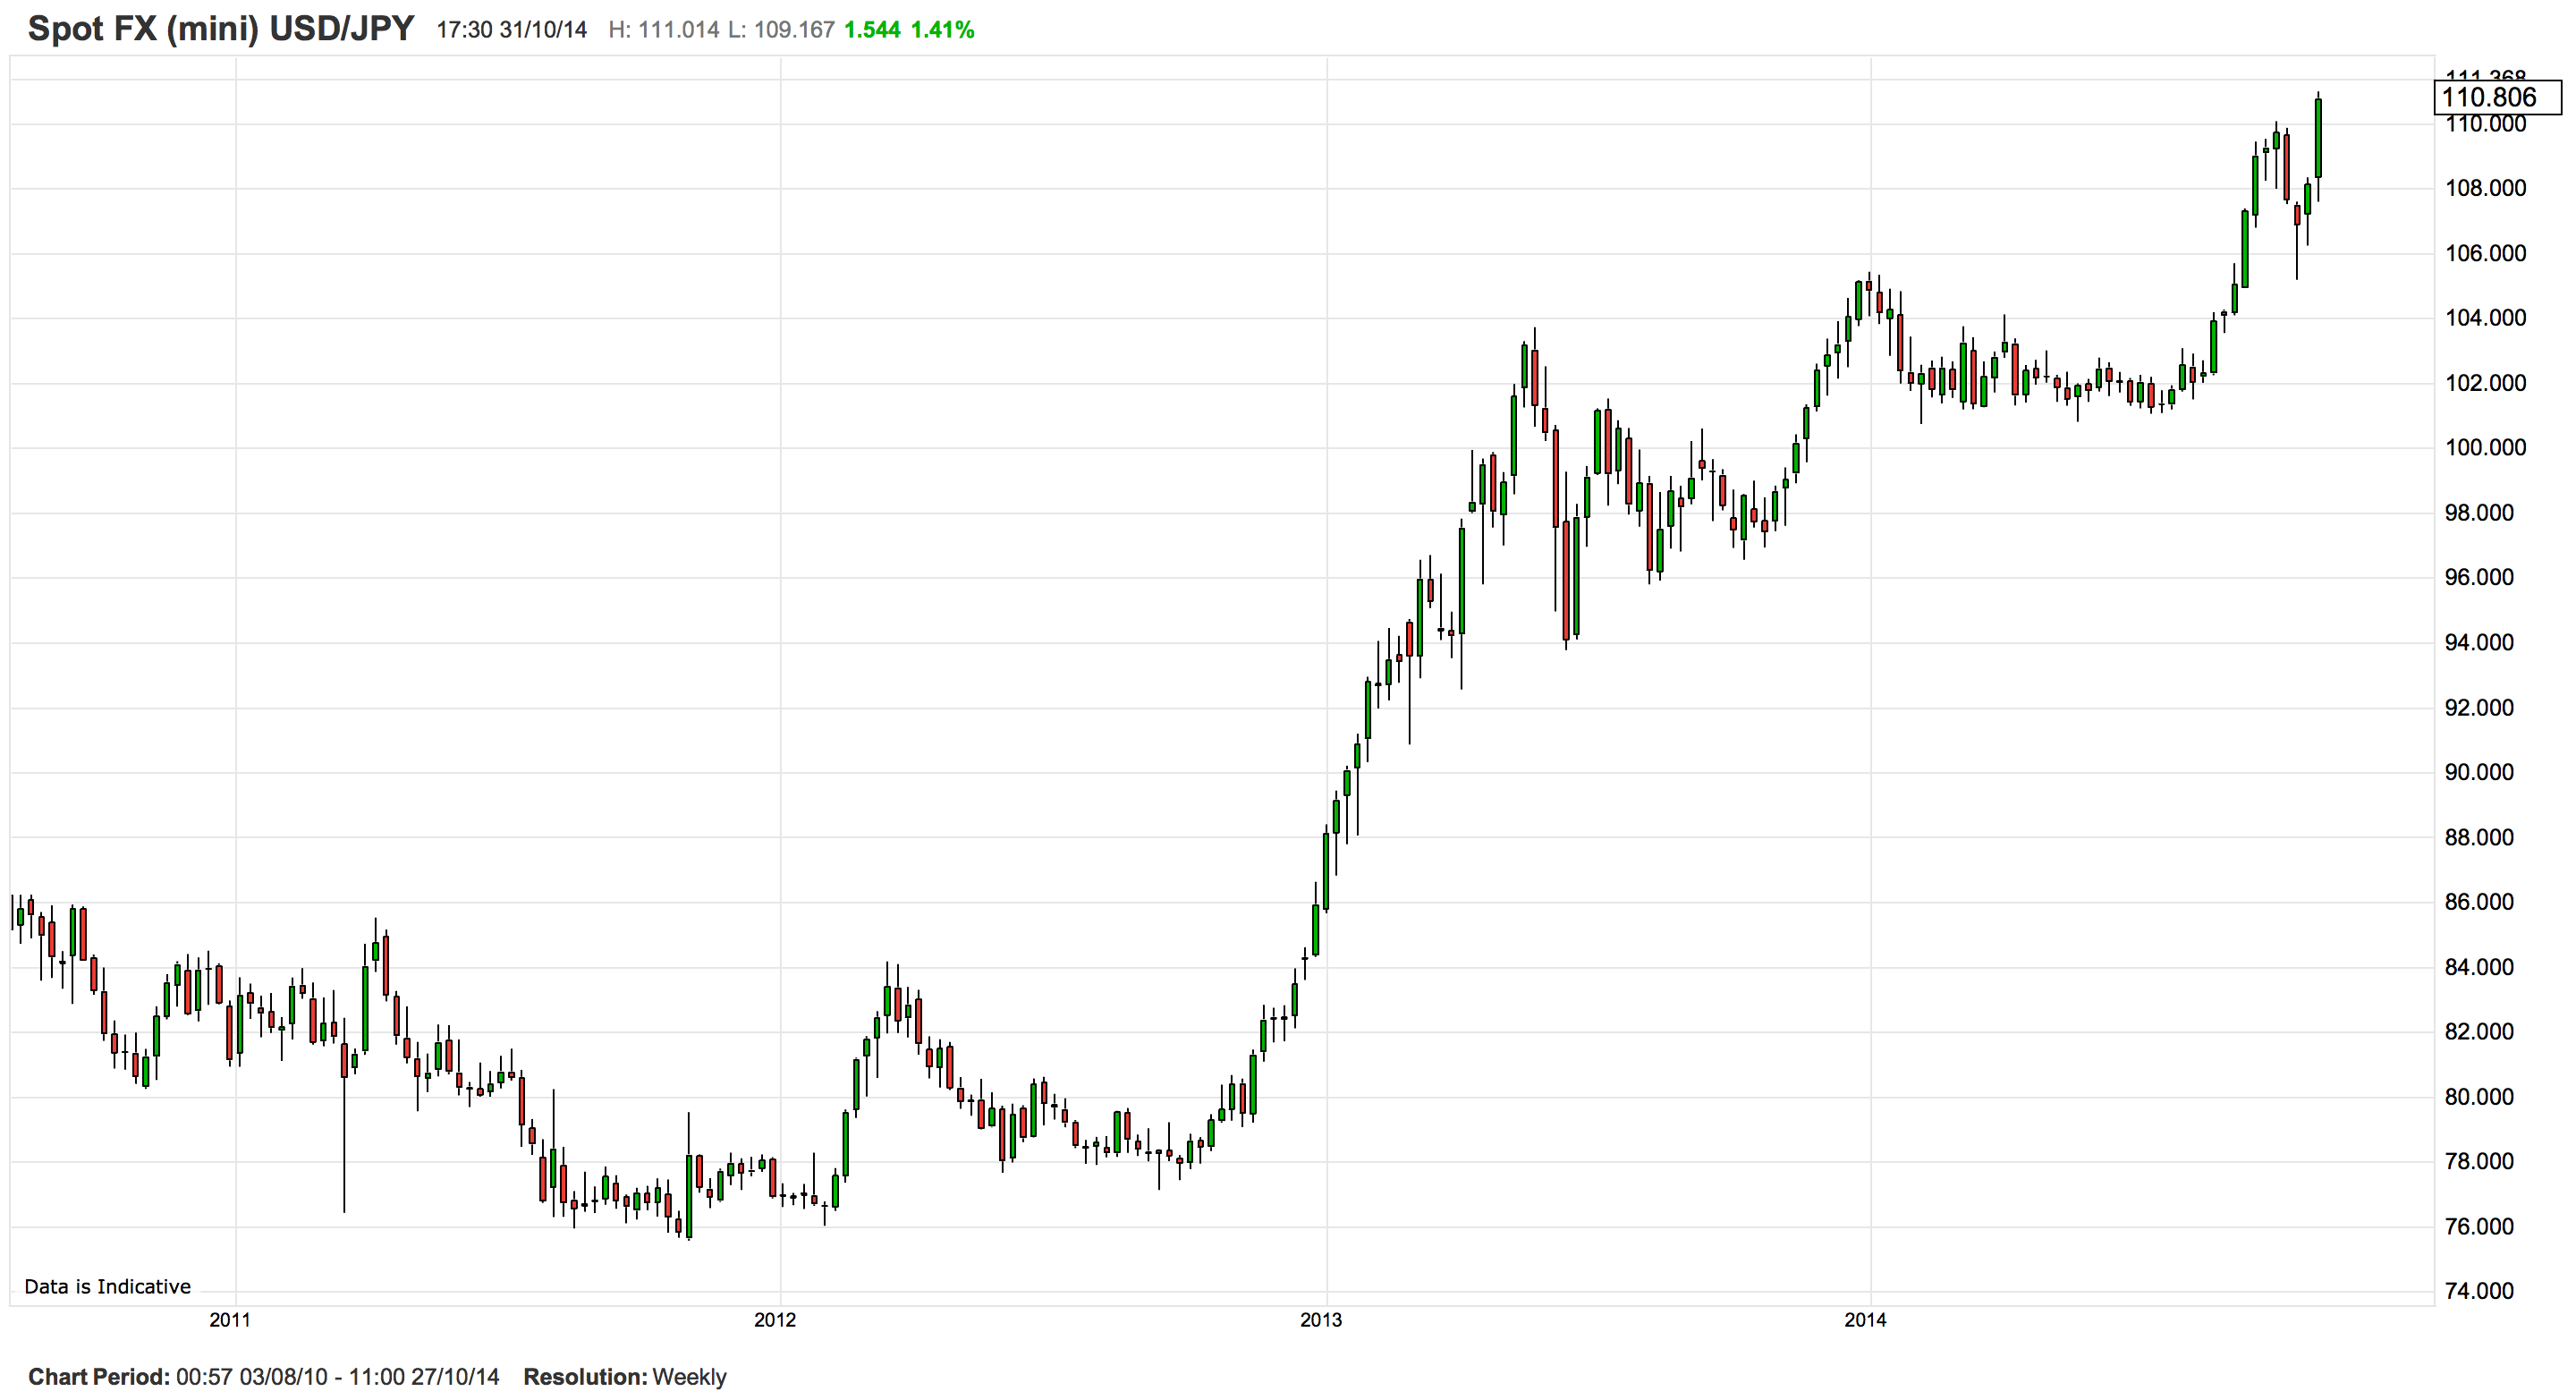
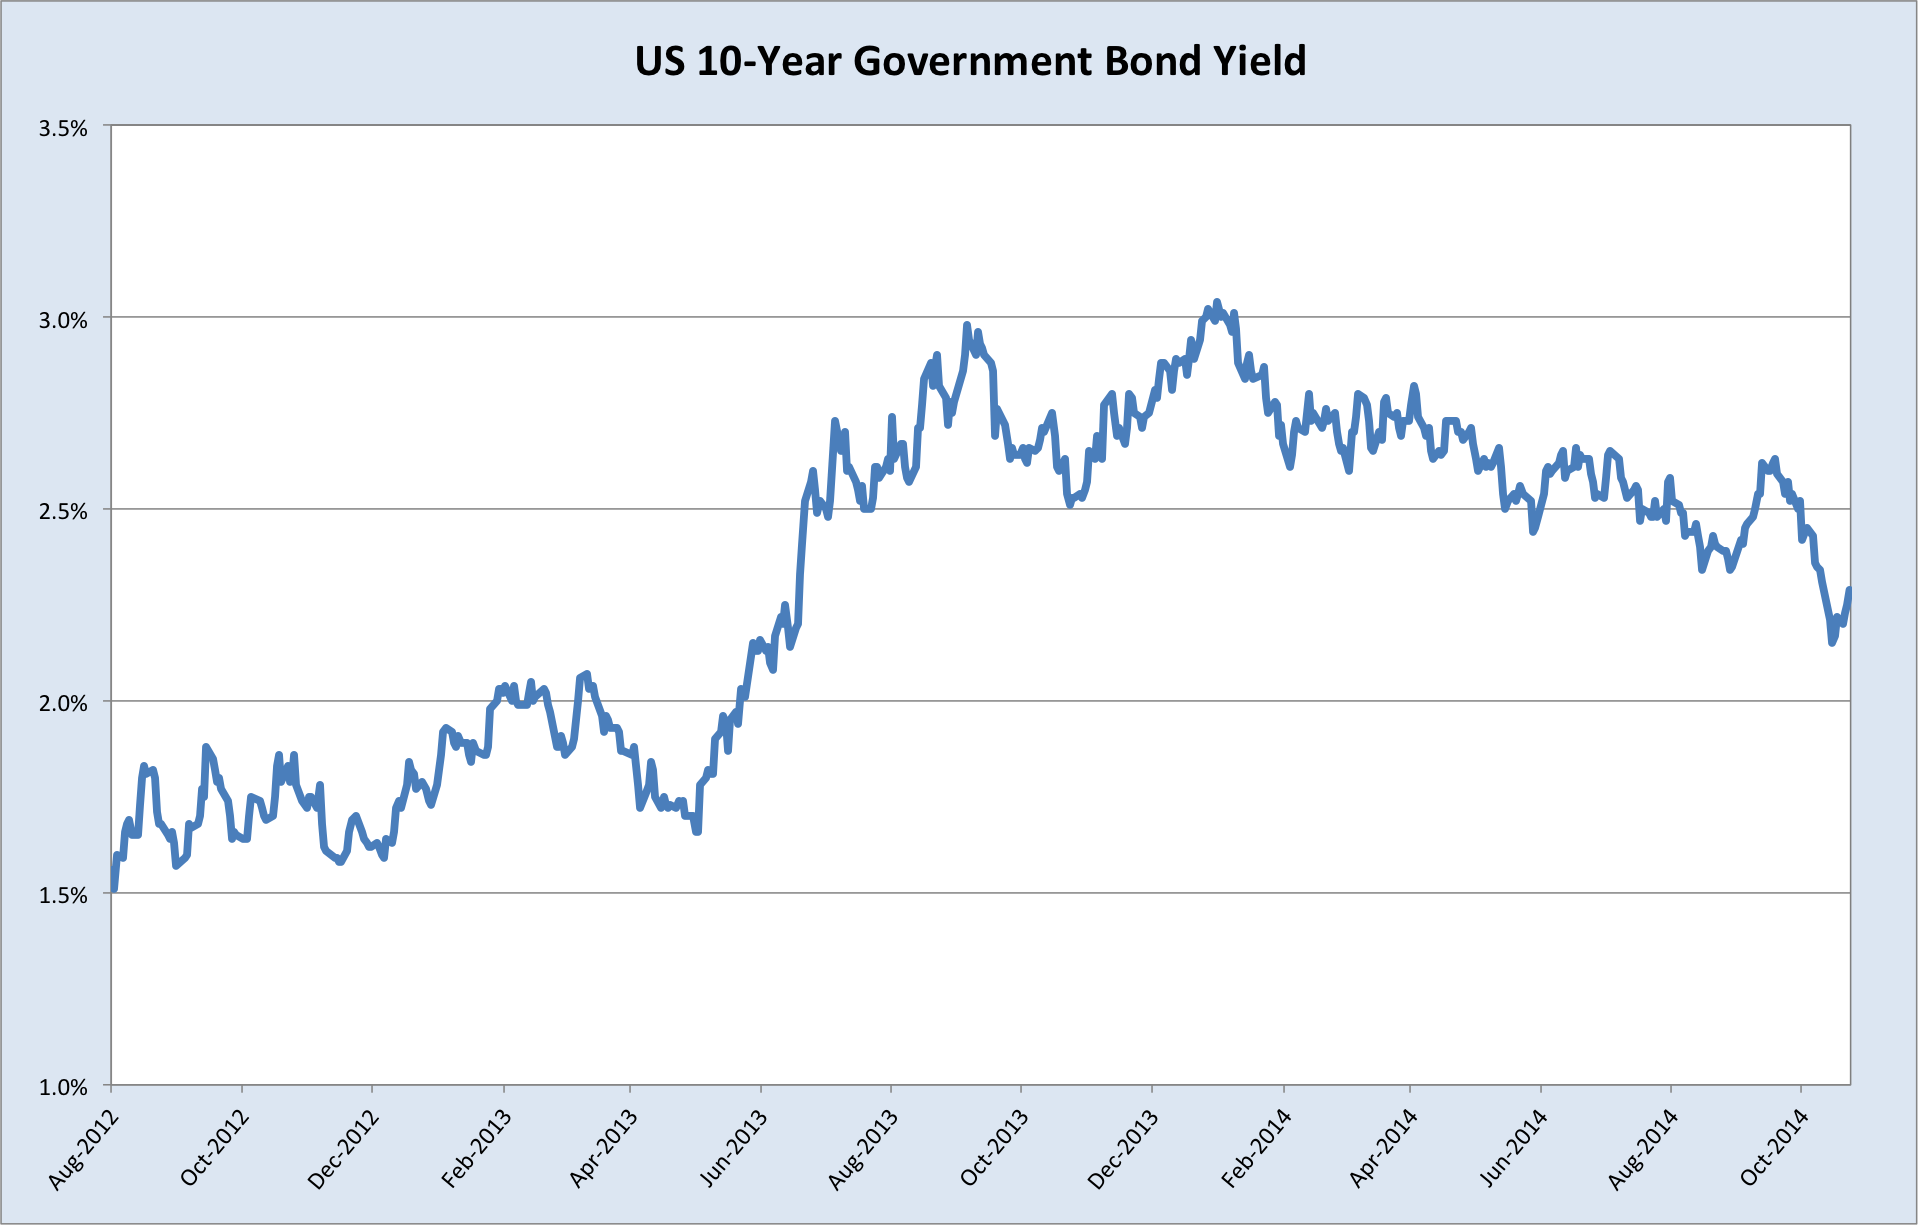
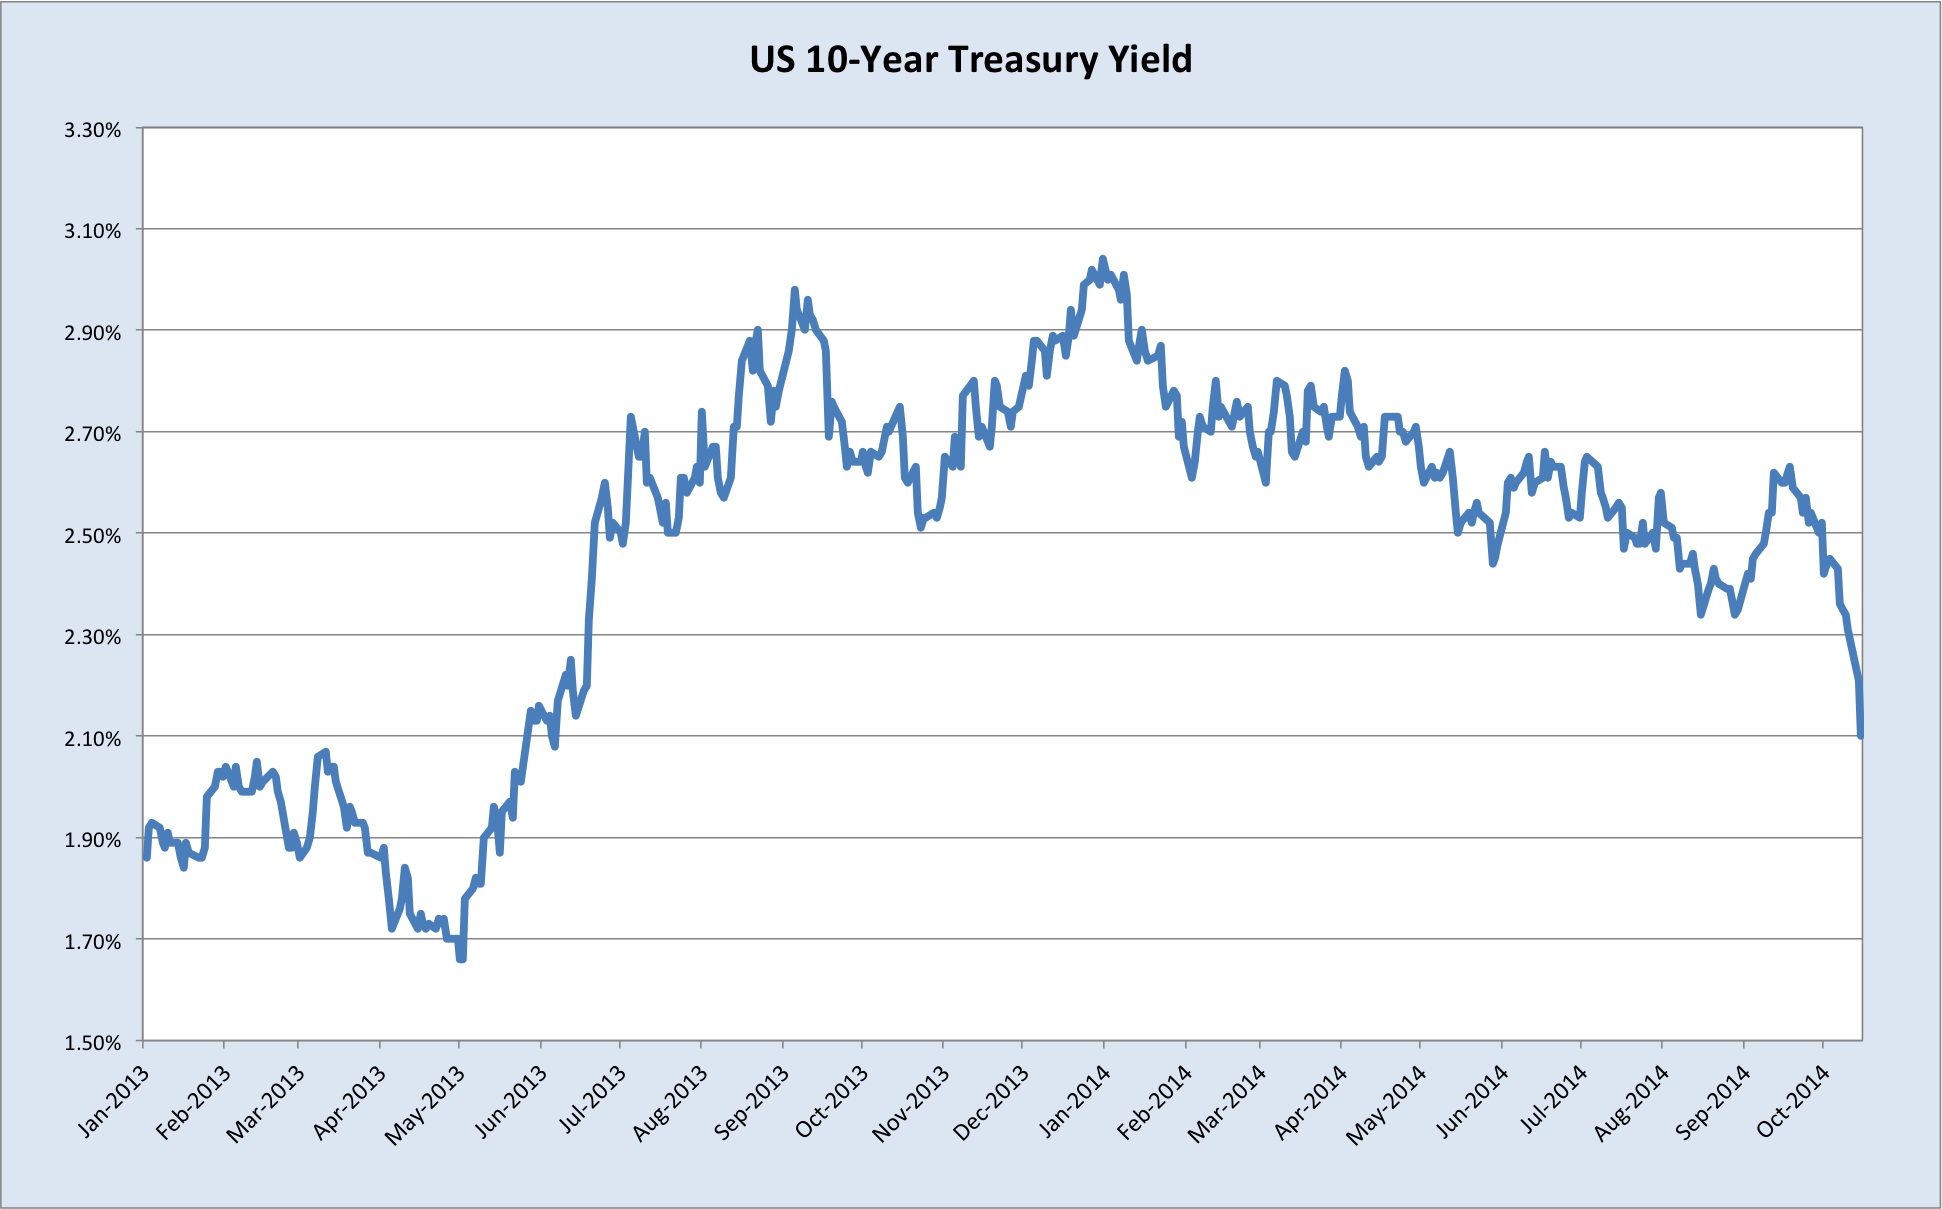
Plainly, this support is going to be harder to break than it appeared to me a couple of weeks ago. The picture is has grown a murkier due to the sharp decline in US interest rates last week. Lower interest rates reduce the attractiveness of holding a currency, and so tend to see its value decline. (charts courtesy of ForexLive).

Goldman-Sachs-USD-bulls-date

Bonds have settled down after the craziness of last week, but all eyes are now on US inflation data later tonight. Should those data undershoot expectations, and I would say that is a distinct possibility, then US yields would likely come under further pressure, which would of course favour the AUD.

As I argued in my last rates post, I would be looking for the AUDUSD to head towards .8000 before concluding that the case for a rate cut had significantly weakened. Much depends on US data, and at the risk of impeccably bad timing with the US CPI just around the corner, I’ll say that .8660 looks safe for now.

Conclusion

Evidently, the cyclical factors I highlighted at the beginning of this post are under-delivering relative to their historical performance. The most energetic phase of the housing boom has been and gone, without inducing a sustained spending response from households. This has meant that the impact on labour markets has been insufficient to reverse the uptrend in the national unemployment rate. Inflation is benign. China continues to offer a window of possibility that maybe the government will ride to the rescue again, but circumstances have not changed in the Middle Kingdom enough to alter my view that the structural weaknesses bearing down on the Australian economy will lead the RBA to cut rates the next time it adjusts the cash rate.

For now I’m going with Q2 2015.

Data and charts sourced from the RBA’s monthly chart pack, the Bureau of Resources and Energy Economics’ (BREE) latest quarterly report, the Australian Bureau of Statistics, China’s National Bureau of Statistics, and IGMarkets. 

Don’t cry for me, QE3

On May 22 last year, Chairman Ben Bernanke announced that the Fed was preparing to reduce its purchases of US Treasury bonds and mortgage-backed securities (quantitative easing). The Fed is fond of coining new lingo for its activities, and the term it chose in this case was ‘taper’.

The bond market was not impressed.

US10s

Having spiked off a low in early May, 10-year yields rose to be over 100bps higher by the end of June. The S&P500 lost around 7.5% over the same period, however this was a mere blip in the hefty rally of 2013. This episode is came to be regarded as the markets’ ‘taper tantrum’. With the dread-inducing end of QE now upon us, markets are growing similarly stroppy.

I devoted the lion’s share of my post on Friday to the heightened level of volatility ramming its way into global markets. Since then it’s been nothing but vol.

Screen Shot 2014-10-16 at 2.50.07 pm

The CBOE VIX is a measure of the expected volatility of the S&P500 over the next 30 days. It’s now at its highest level since June 2012 (it briefly soared to over 30 last night, more on that in a moment). This was around the time that the liquidity-crisis phase of the European debt saga was concluded courtesy of Mario Draghi’s promise to do ‘whatever it takes’ to prevent a member state government from defaulting (meaning the ECB would buy as many sovereign bonds as was required to stem a meltdown). Until the last month or so, the VIX had been trending downwards thenceforth, which was both indicative and encouraging of risk-taking.

Much of this latest spike in volatility is attributable to the end of the Federal Reserve’s balance sheet expansion, however the timing is as much to blame, coming as it is when global growth expectations are taking a battering.

QE4?

Over the weekend a thought began to creep into my mind that I must confess I’d given barely a moment’s consideration to up until that point: What if the Fed isn’t done with its asset purchases just yet? What if we get QE4 or an extension of QE3?

I’m sure others more bearish than I have long been alert to this possibility, however I think it’s fair to say that recent data on the US economy, especially the labour market, have pointed to a steady healing. Not a roaring boom, by any measure; wage and other price pressures have been scant, but in all it looked like the US was on the right highway, albeit in a slow lane. Thus I had the following to say regarding the strong dollar:

The case for a stronger dollar has therefore centred on the miserable state of its peers. Germany is sinking into recession, adding to the persistent weakness plaguing the Eurozone, Japan is looking sickly after hiking the sales tax earlier this year, and China is doing its best to rebalance without detonating its debt time-bomb. Combined with the end of QE this month, the USD is looking the least ugly out of a pretty ordinary bunch.

Sadly, last night the US took a few steps closer to its miserable peers, with retail sales missing badly, registering the first negative print since the polar vortex froze activity in January, the Empire State Manufacturing Index falling back to Earth, and producer prices also in negative territory. I was surprised by the weakness in retail sales, I will admit, though the soft PPI shouldn’t come as a great surprise, when we consider recent developments in commodities.

Along with rising volatility, another major theme I discussed on Friday was the slump in oil prices. (Here’s a useful recap of the reasons why this is happening.) Oil has been pummelled again this week, and is now down a jaw-dropping 27% since mid-June, to its lowest level in 4 years (and, it must be said, looking thoroughly oversold).

brentoilprice

This pattern is being repeated across the commodity space, with the Thomson-Reuters CRB Index also nose-diving over the same period (oil and gas make up a large share of that index, it should be noted).

Screen Shot 2014-10-16 at 4.00.09 pm

The sharp drop in commodities is draining price pressures out of the global economy at a rapid clip. Some of the recent drop is undoubtedly due to the USD rally. Nevertheless, from the US to the UK to China to Japan to Europe and even Australia, the spectre of deflation looms large over the global economy.

It’s beyond the scope of this post to delve into the possible explanations for this phenomenon, but suffice it to say, short of some radical shifts like a big cut to OPEC oil production or consumption-driven trade deficits in China or a credit boom in the US, I believe this phenomenon is likely to persist. The market agrees, and this is why US bonds have been soaring lately, and yields collapsing (see above chart), as expectations for US rate hikes are deferred.

Last night’s price action in equities was similarly informative.

S&P16:10

Look at the enormous intraday volatility in that last candle, which saw the VIX briefly breach 30. A move like that suggests the equities market is extremely jittery but also still heavily imbued with the belief that the Fed will not hesitate to lend the support of its balance sheet if conditions deteriorate.

The USD sold off sharply, before recovering somewhat.

Screen Shot 2014-10-16 at 5.00.05 pm

And gold caught a nice bid amongst the turmoil, helped as it always is by lower yields and a lower USD.

GOLD

On Friday I highlighted the neat triple bottom that spot gold as put in. Although, at the time I said I was unconvinced that this would herald a sustained rally, as one may well be inclined to think it would looking at the chart. It’s now looking firmer, and this week’s movements in bonds make it much harder to see that support giving way in the near future.

GOLDLT

So, QE4?

It has to be said that I didn’t expect last night’s data to be as bad as it was, nor that US yields would collapse this week in the manner they have. Nevertheless, one night of poor data of course does not mean that the wheels are falling off the slow but steady US recovery; it merely reinforces my view that “the US is looking the least ugly out of a pretty ordinary bunch”, as opposed to being in a robust upswing.

At this stage I find it far more likely that the Fed will simply defer its rate hikes, in preference to further asset purchases. But a fortnight ago I would have attached effectively zero probability to another round of asset purchases. Now I see somewhere between a 5-10% chance. And it’s not just me… John Williams of the San Francisco Federal Reserve conceded recently that if inflation remains low or declines further, another round of asset purchases is not out of the question.

Much therefore depends on how commodities fair and how soft things get in China, Japan and especially Europe. If inflation keeps wilting in these regions, and especially if the USD continues to rally, then the US will be importing disinflationary pressures regardless of whether its tepid recovery continues unimpeded. The Fed’s inclination to renew its asset purchases would come very quickly in that scenario.